Download to read offline

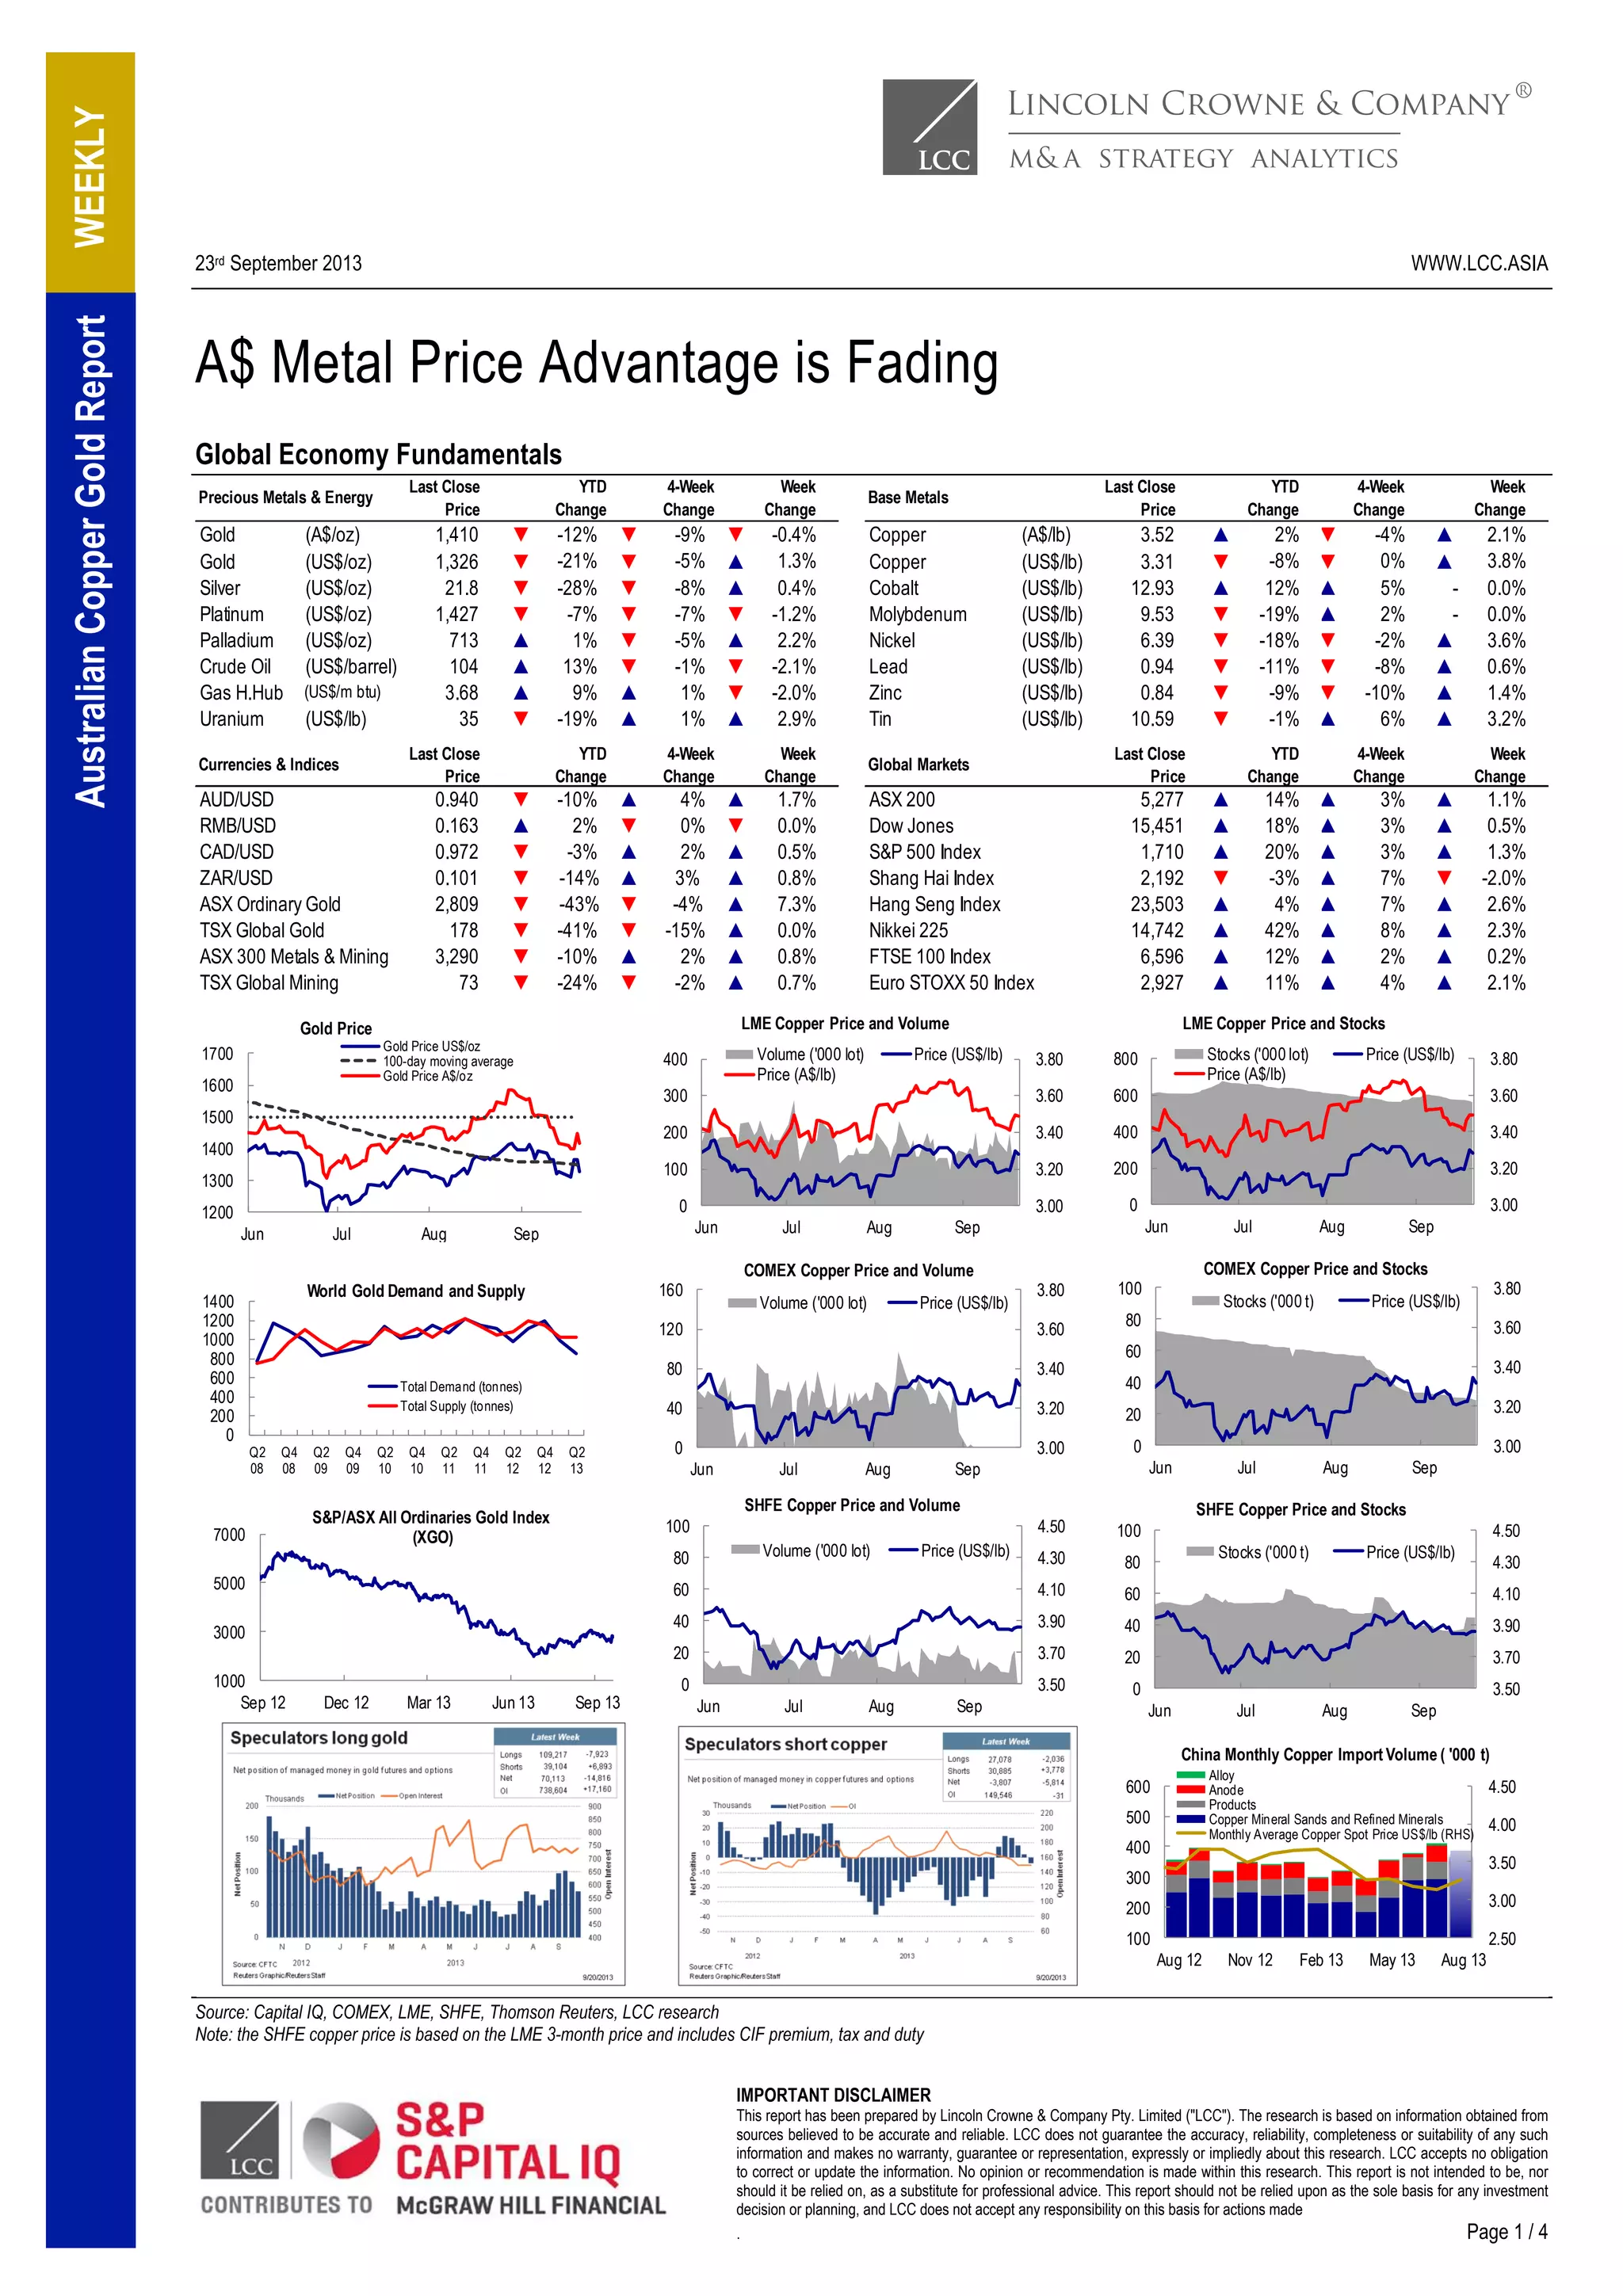
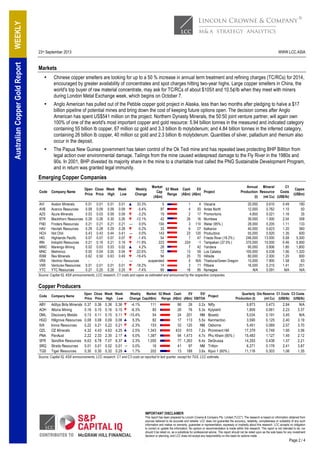
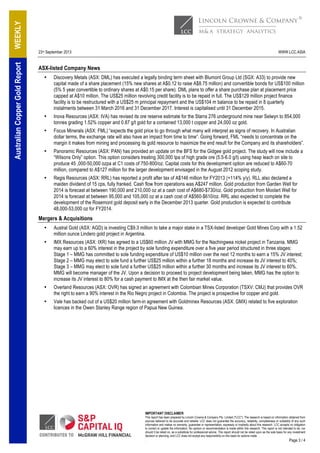
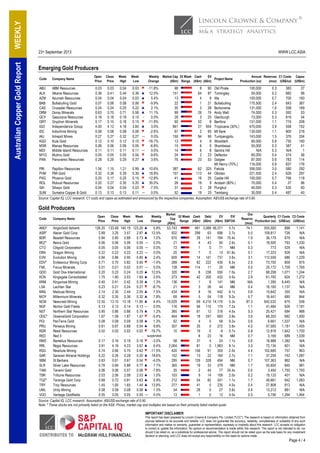

The report outlines the current state of the copper and gold markets, noting that the price advantage for metals is declining amidst changing global economic fundamentals. Key developments include Chinese copper smelters seeking significant increases in treatment charges and Anglo American's withdrawal from a major copper-gold project in Alaska. Additionally, the Papua New Guinea government is asserting control over the Ok Tedi mine, previously shielded from legal action regarding environmental damage.


