Download to read offline
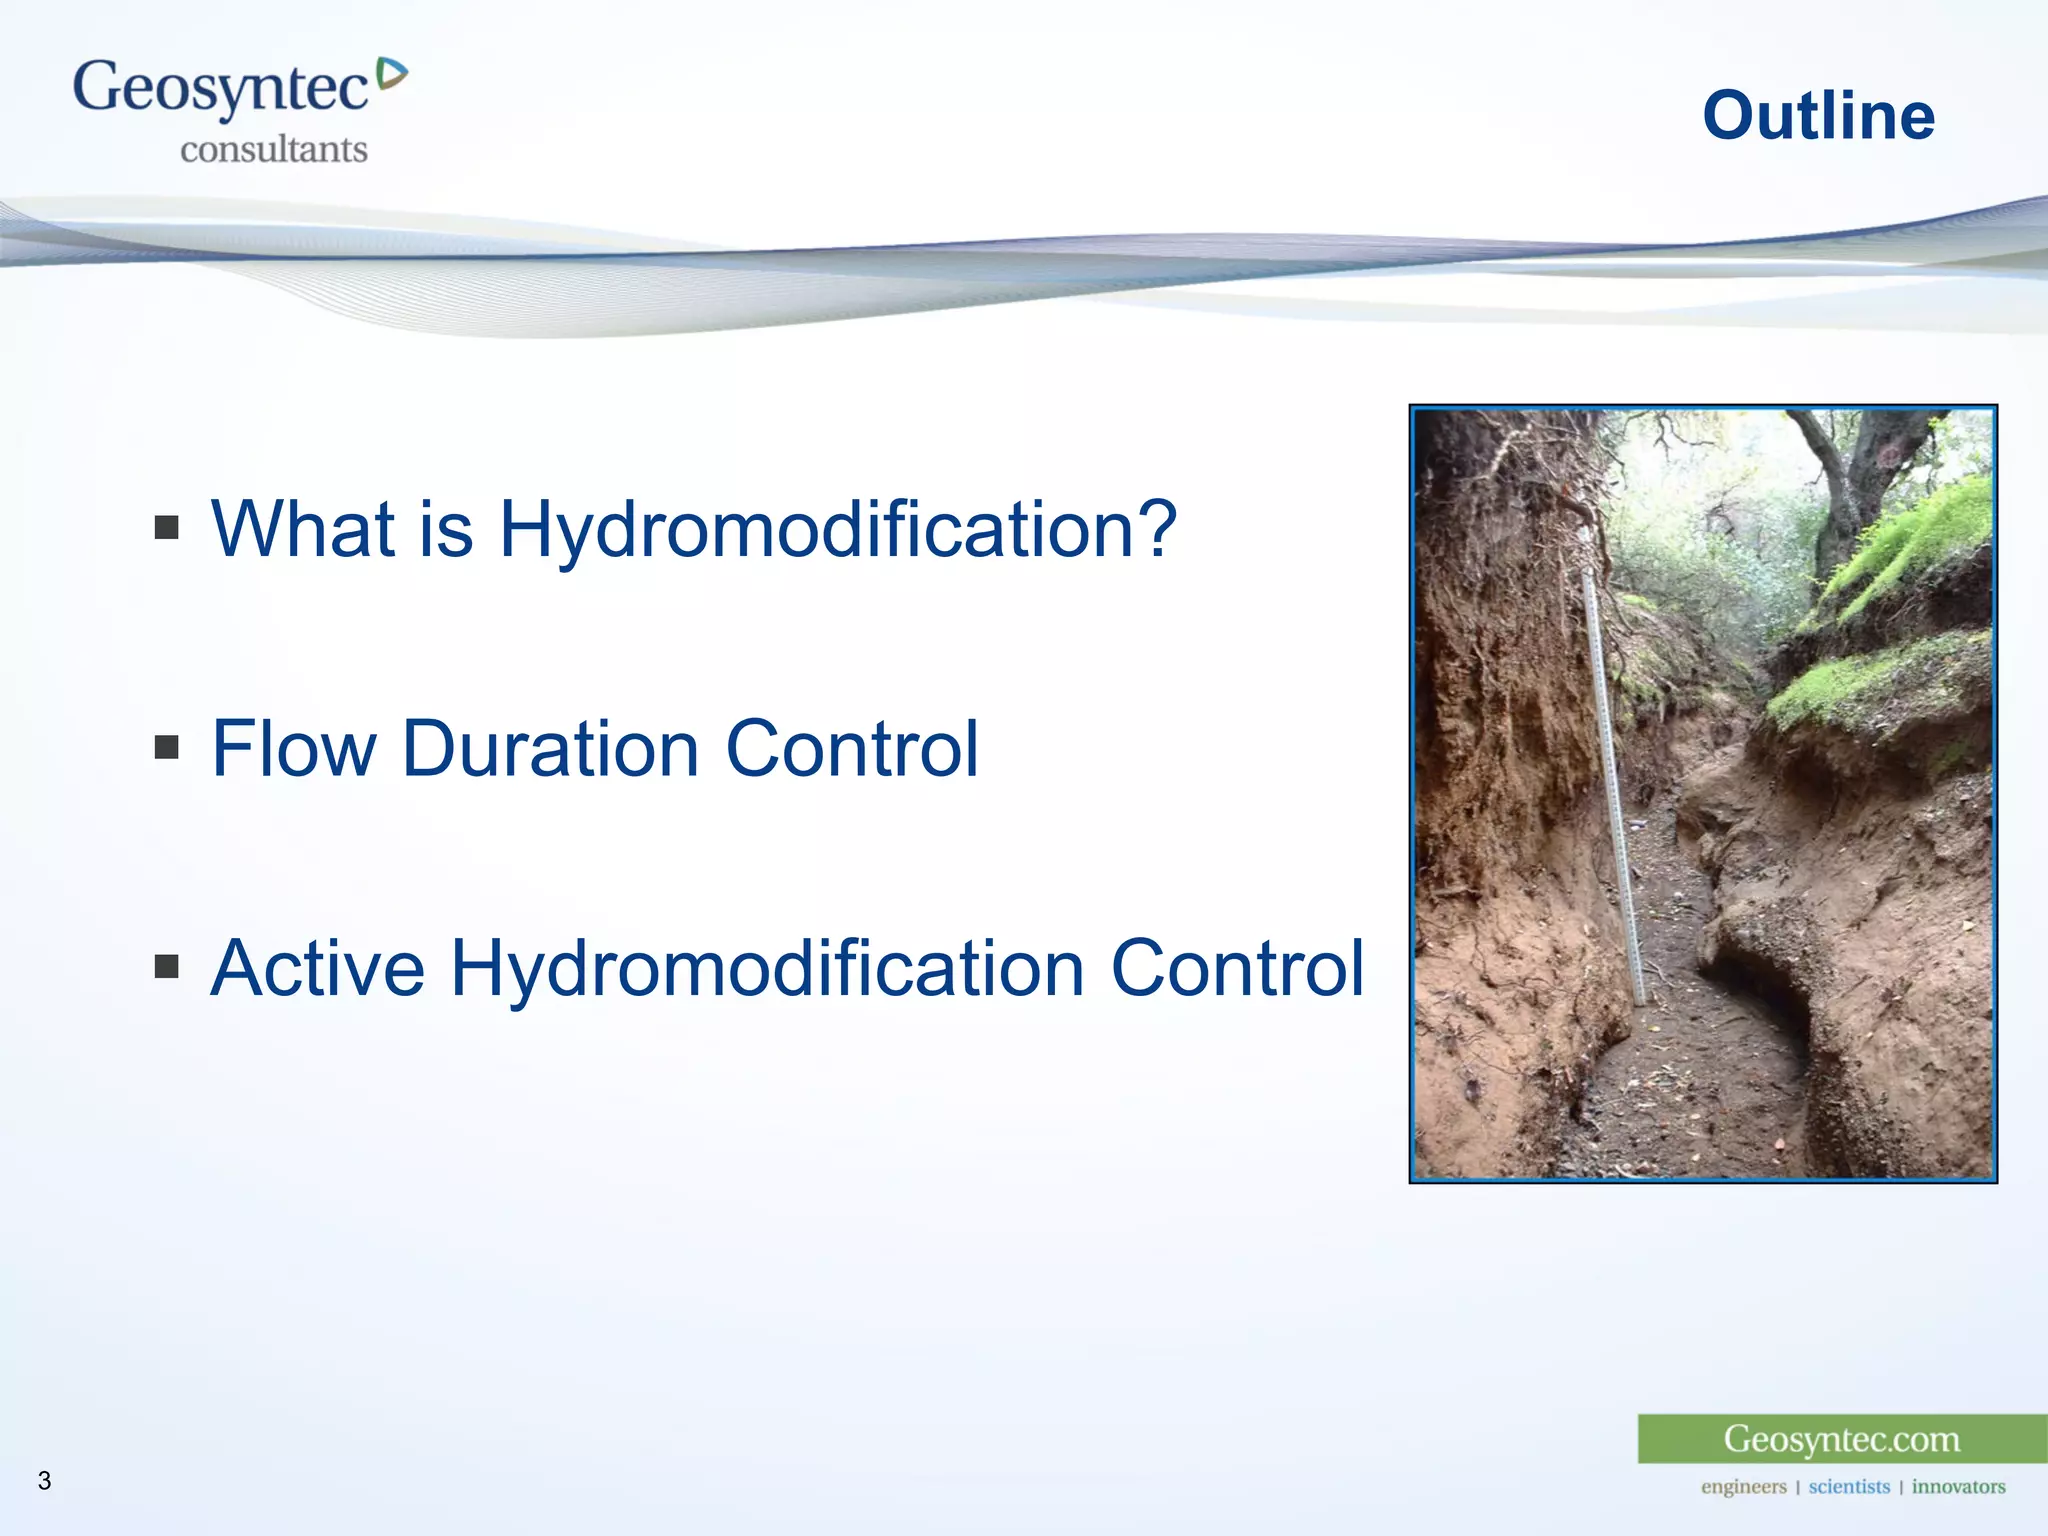
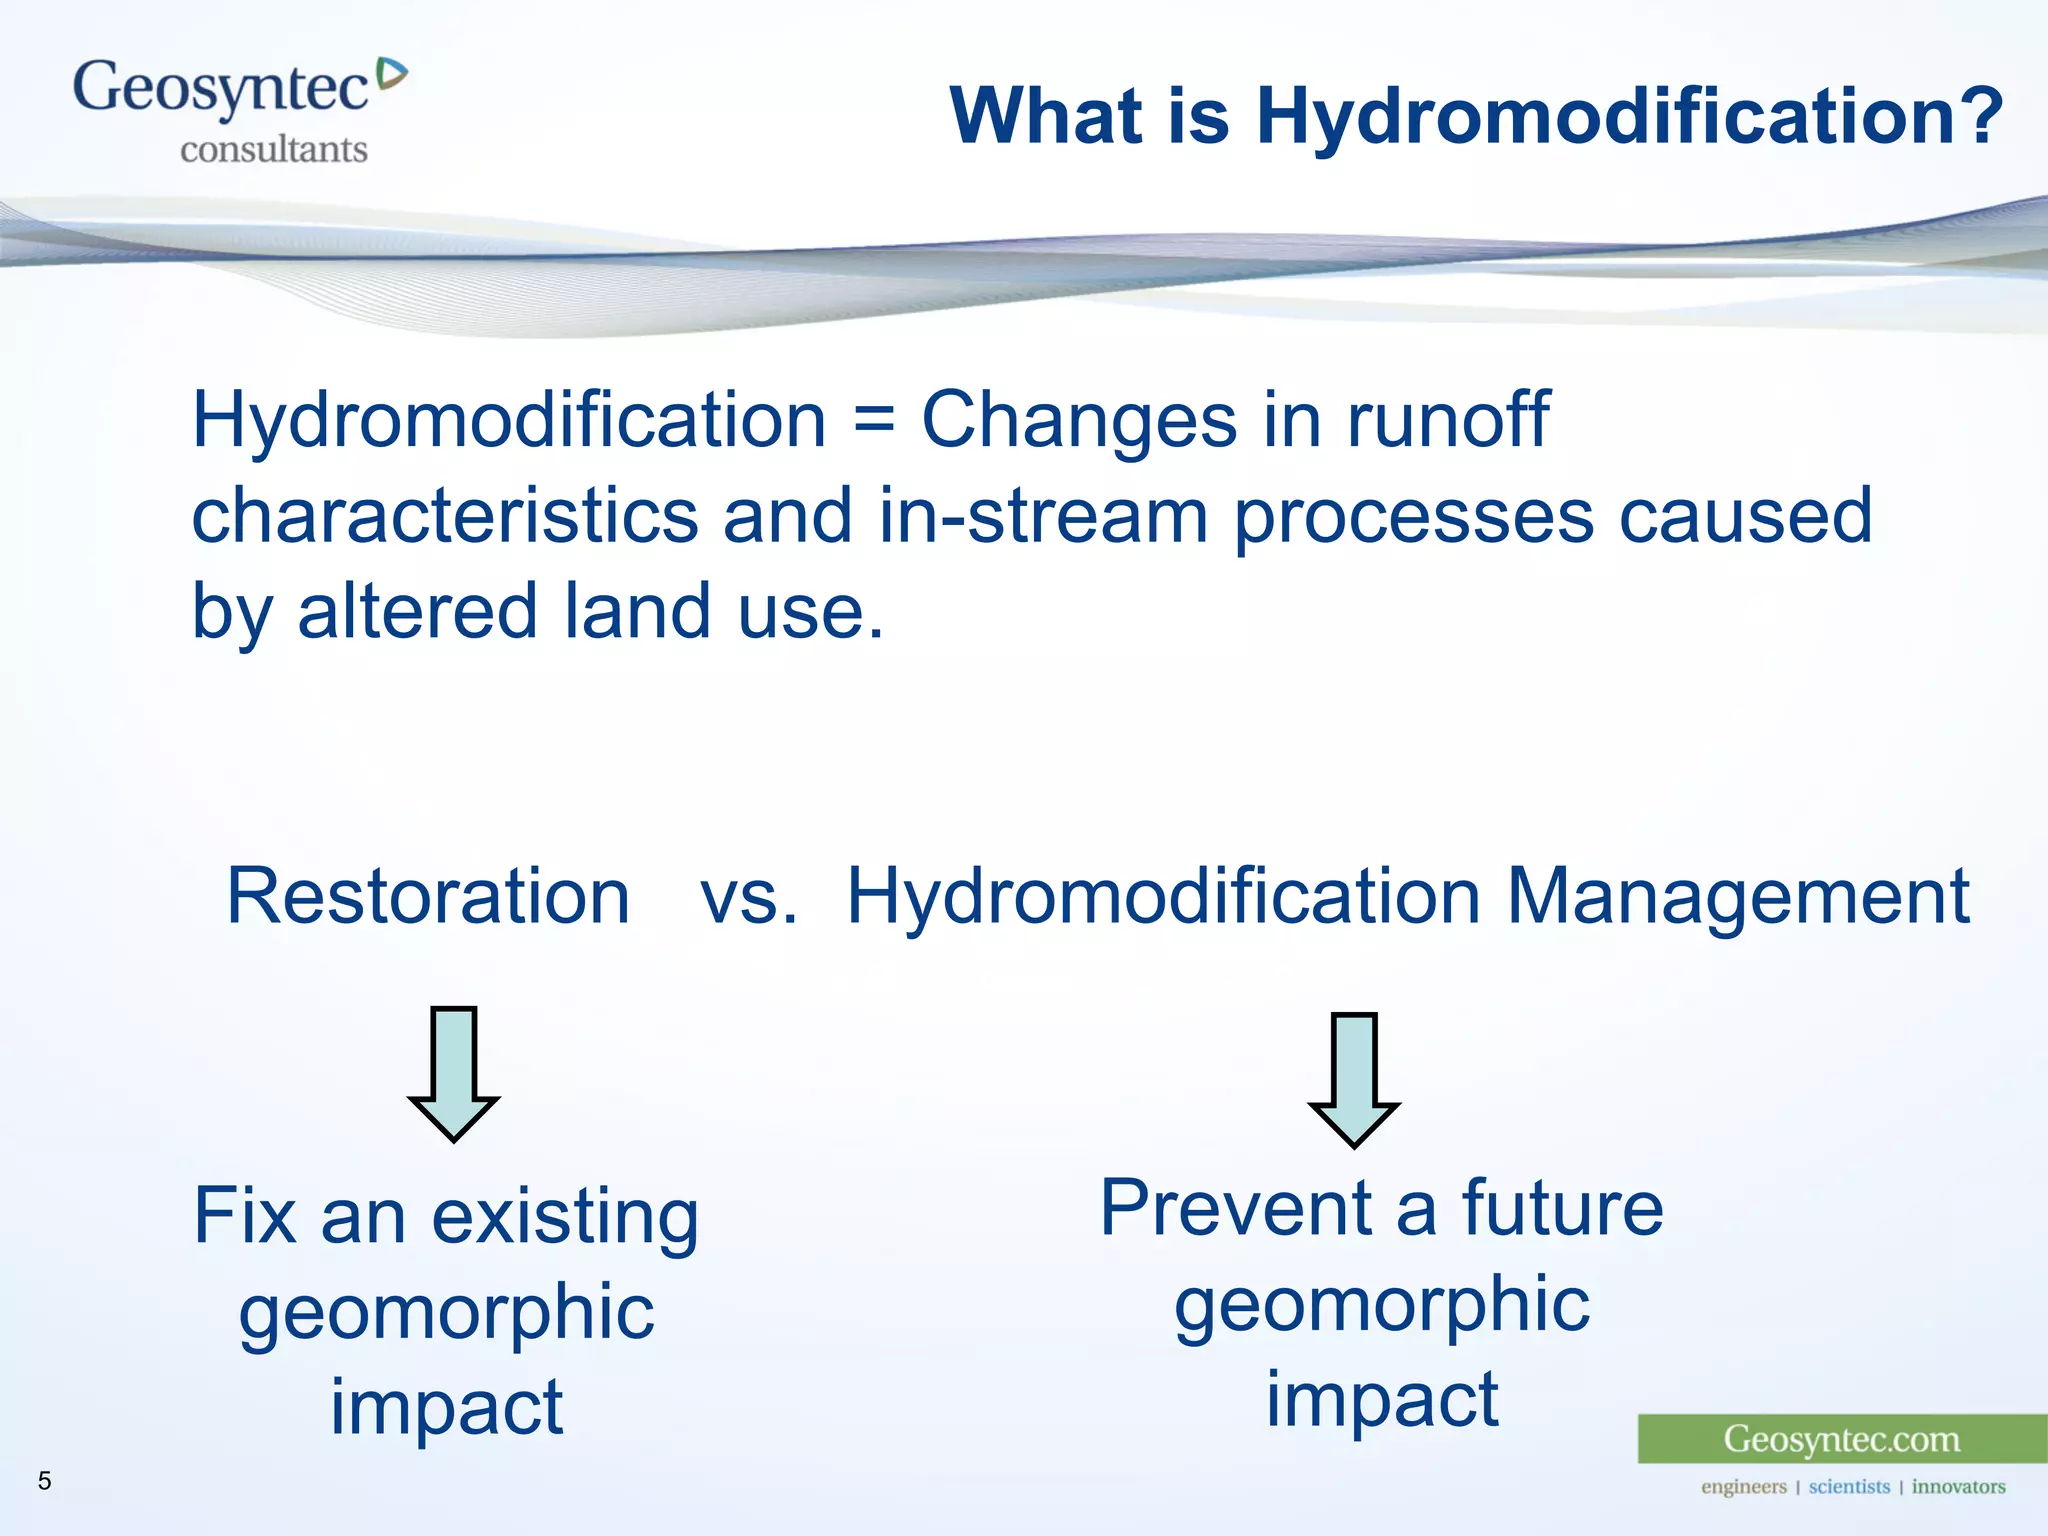
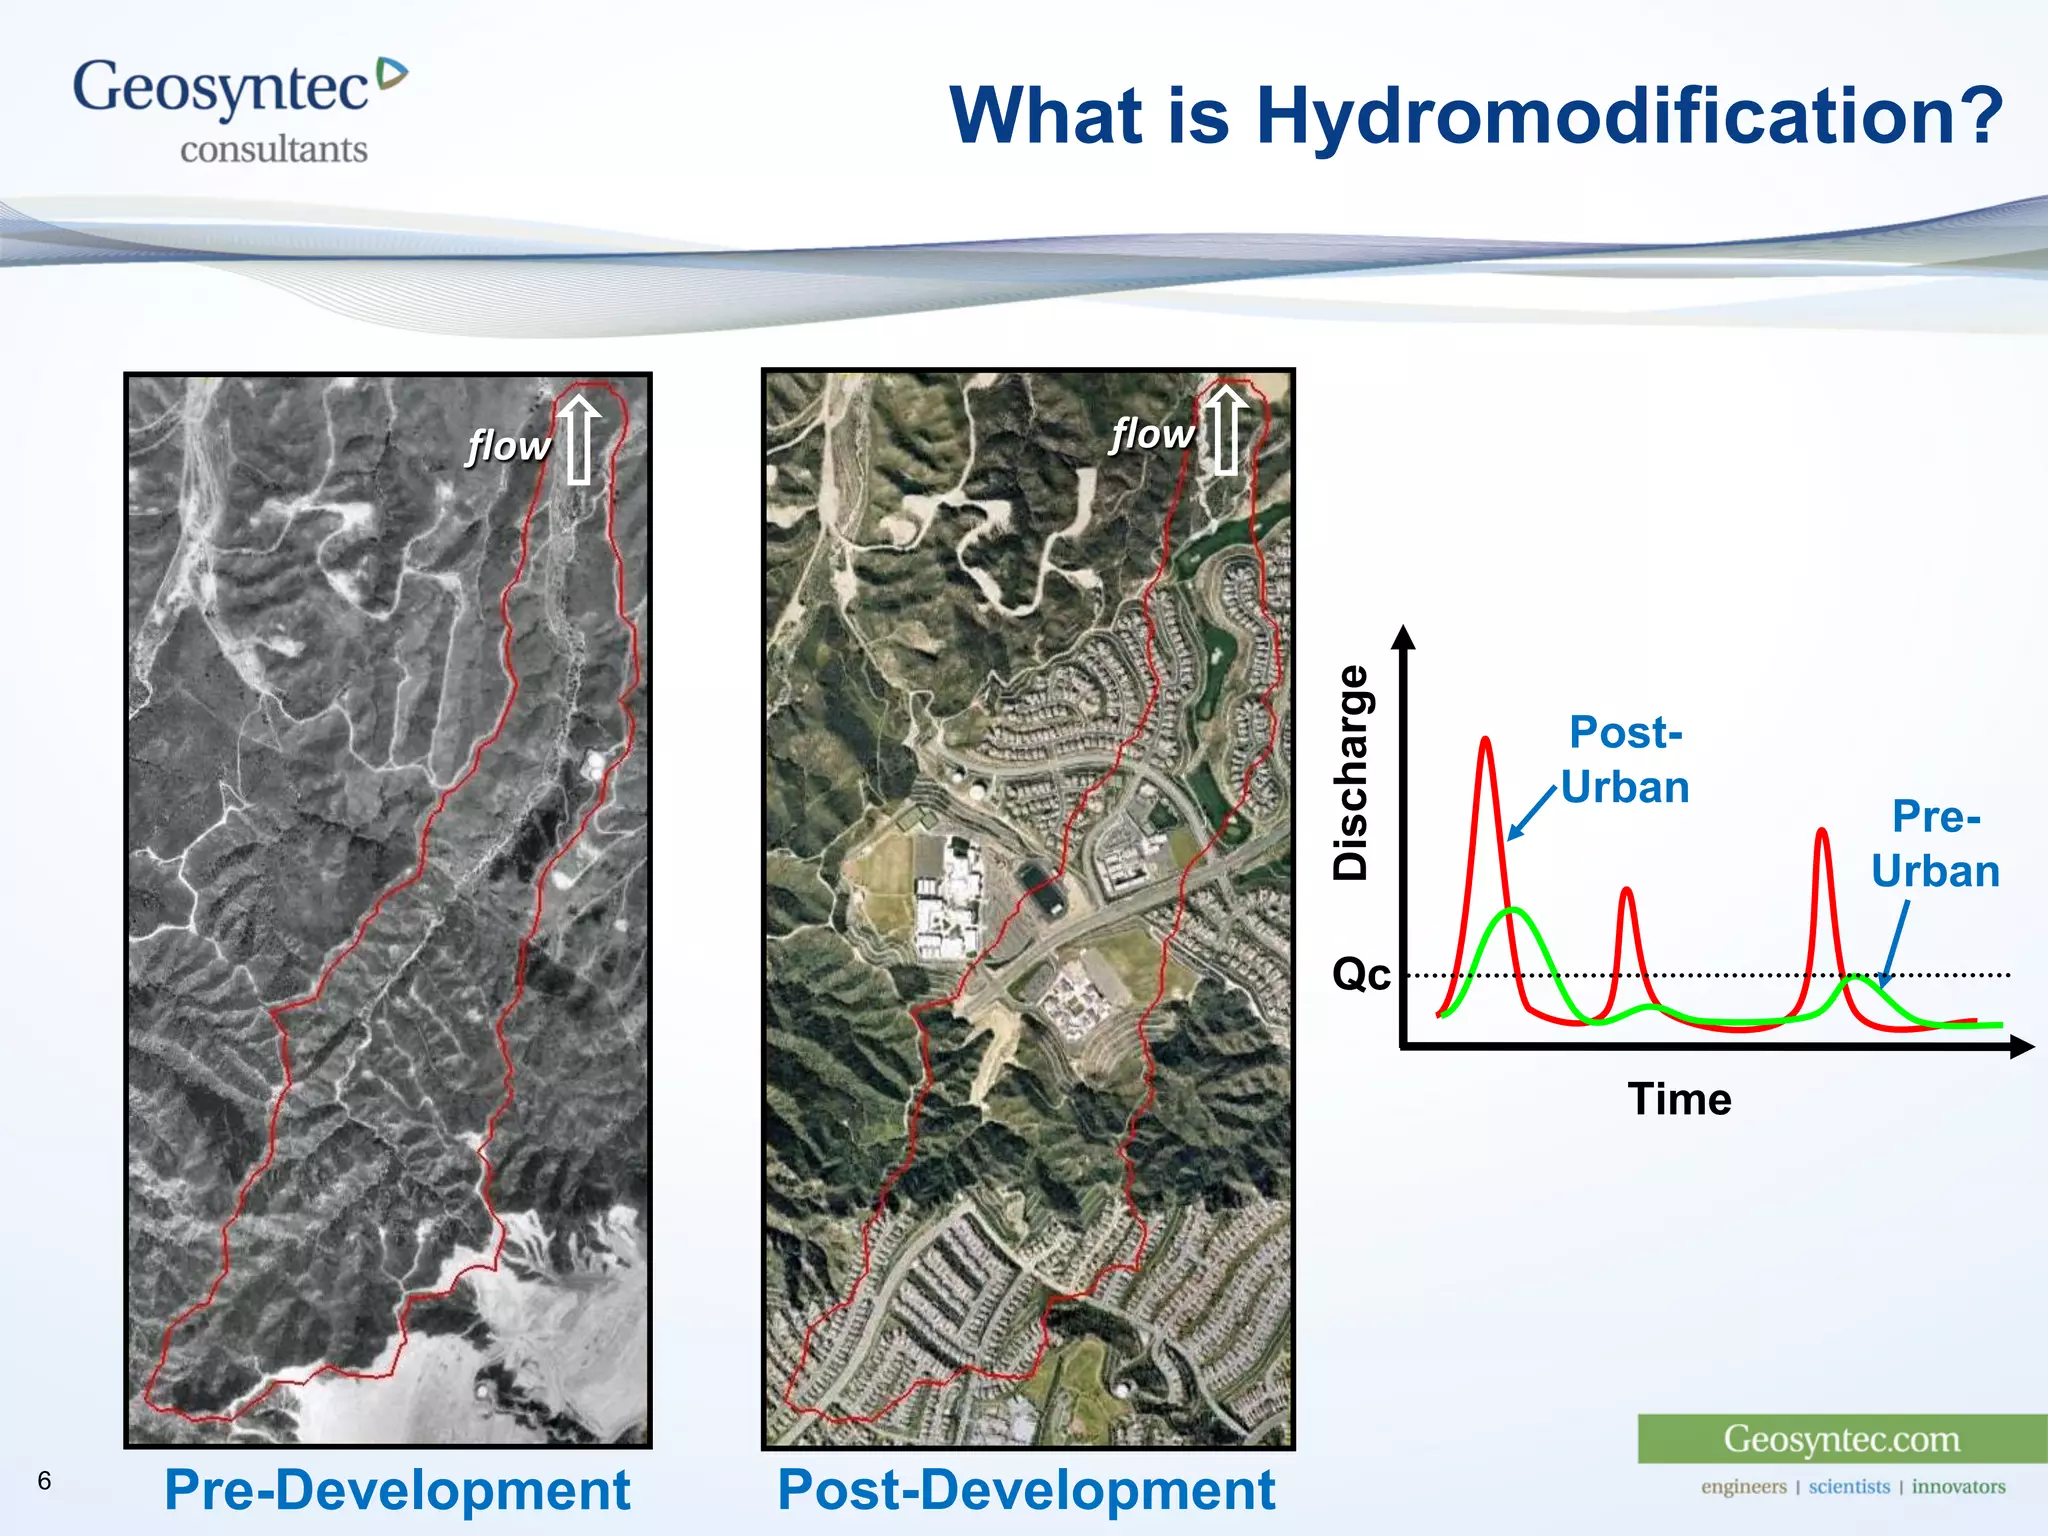
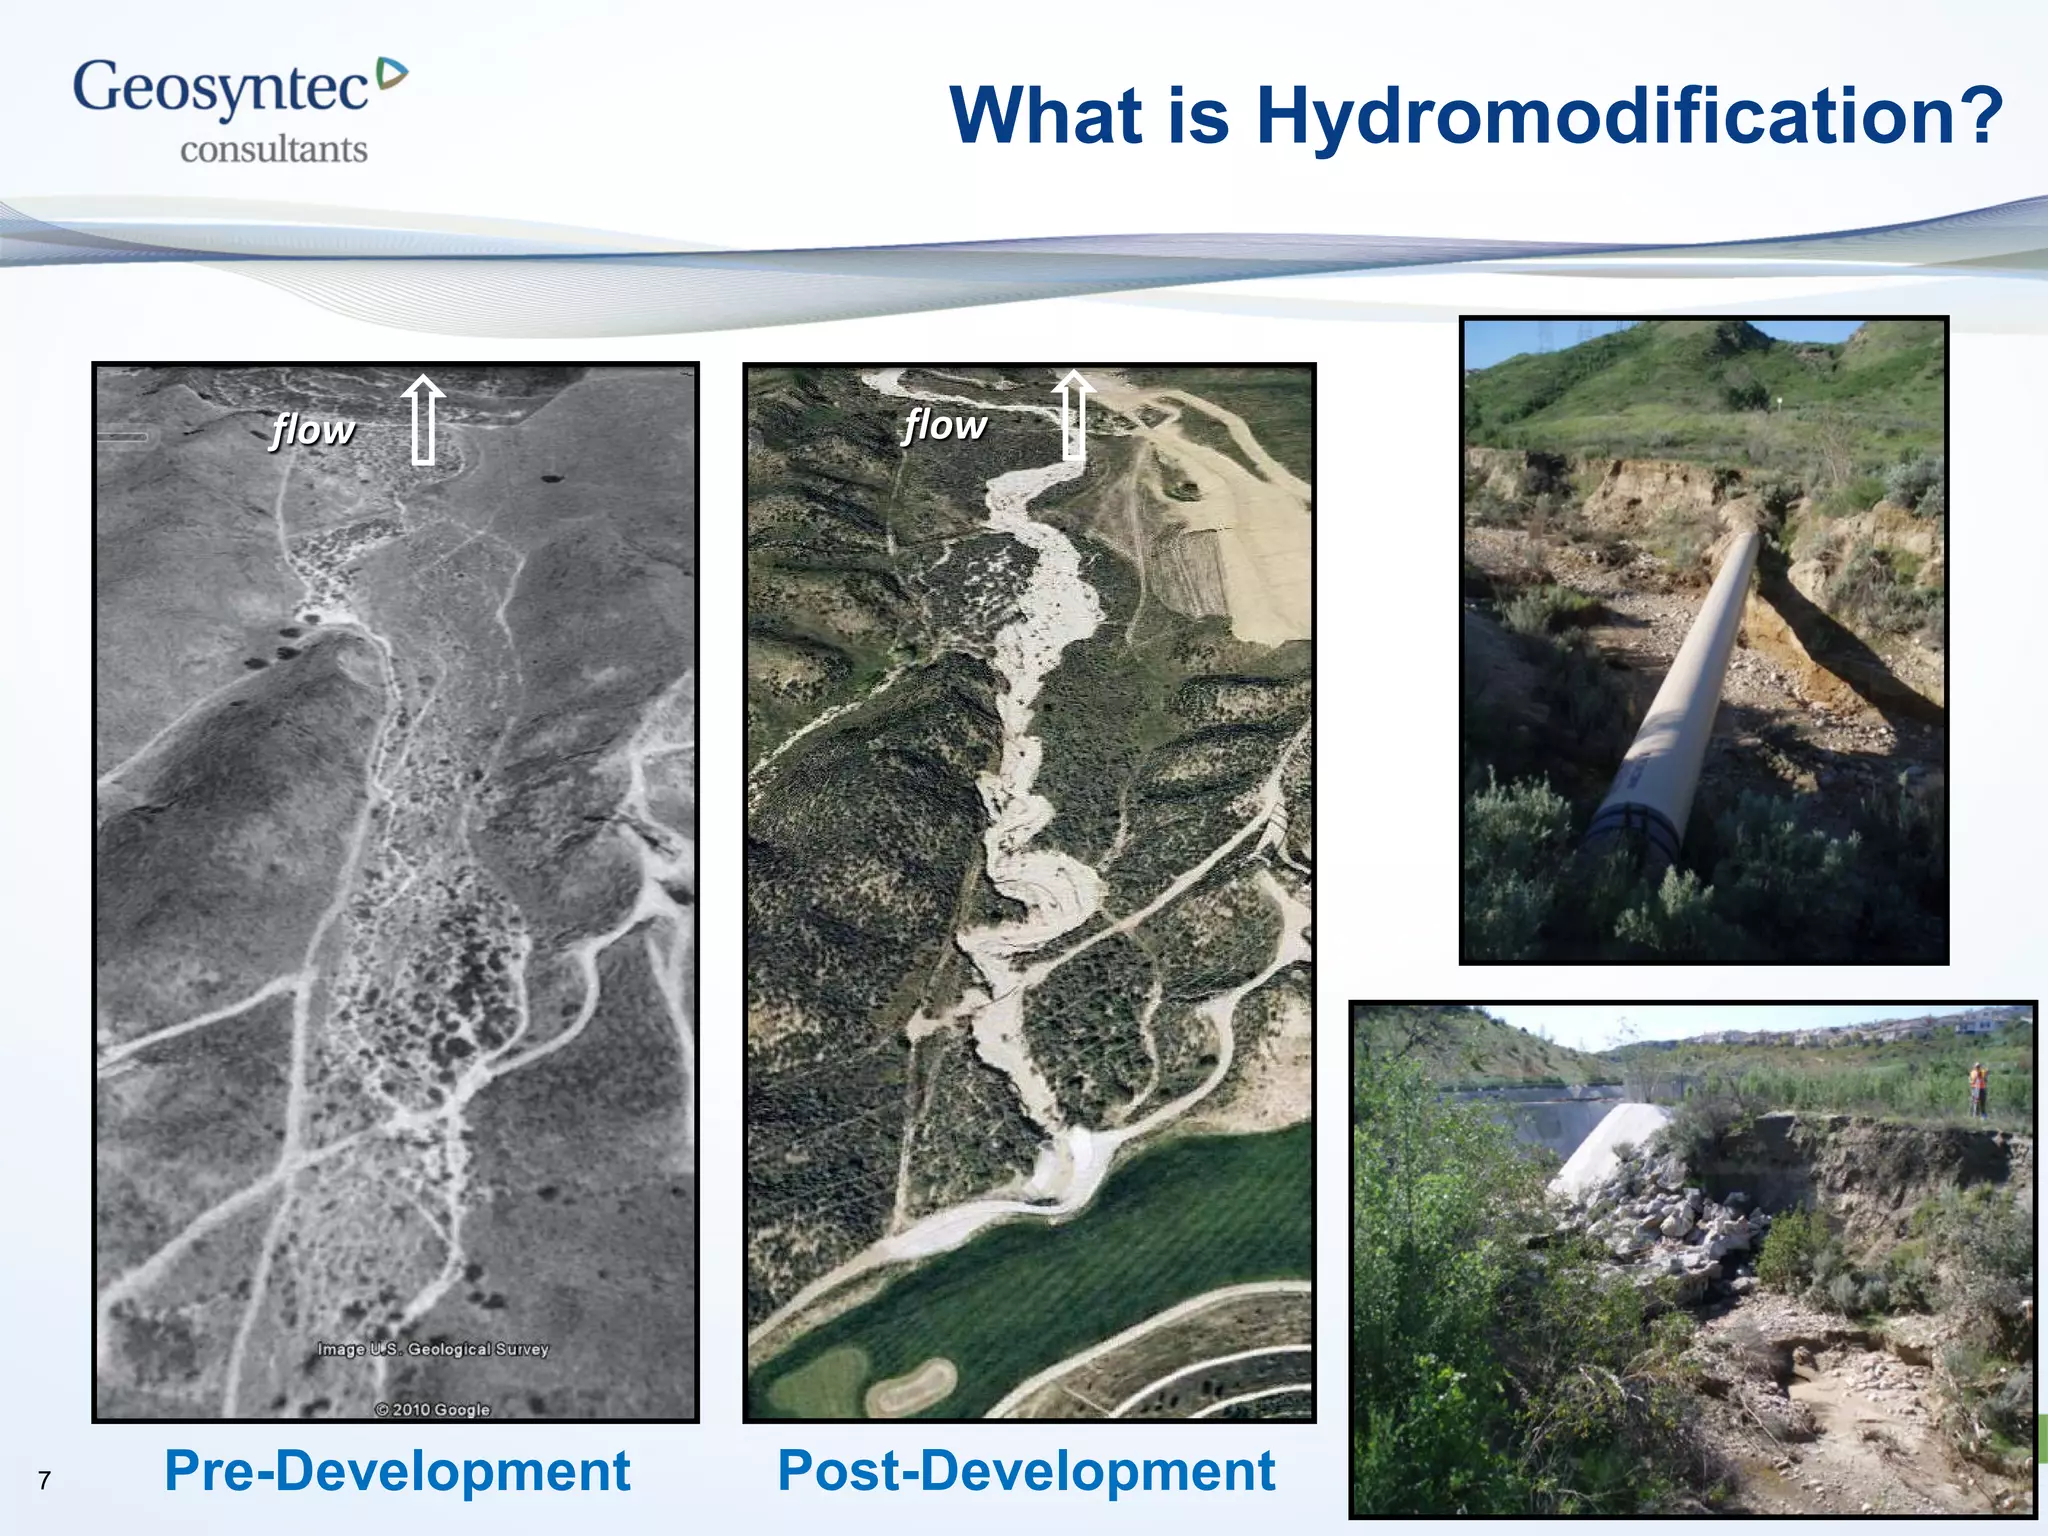
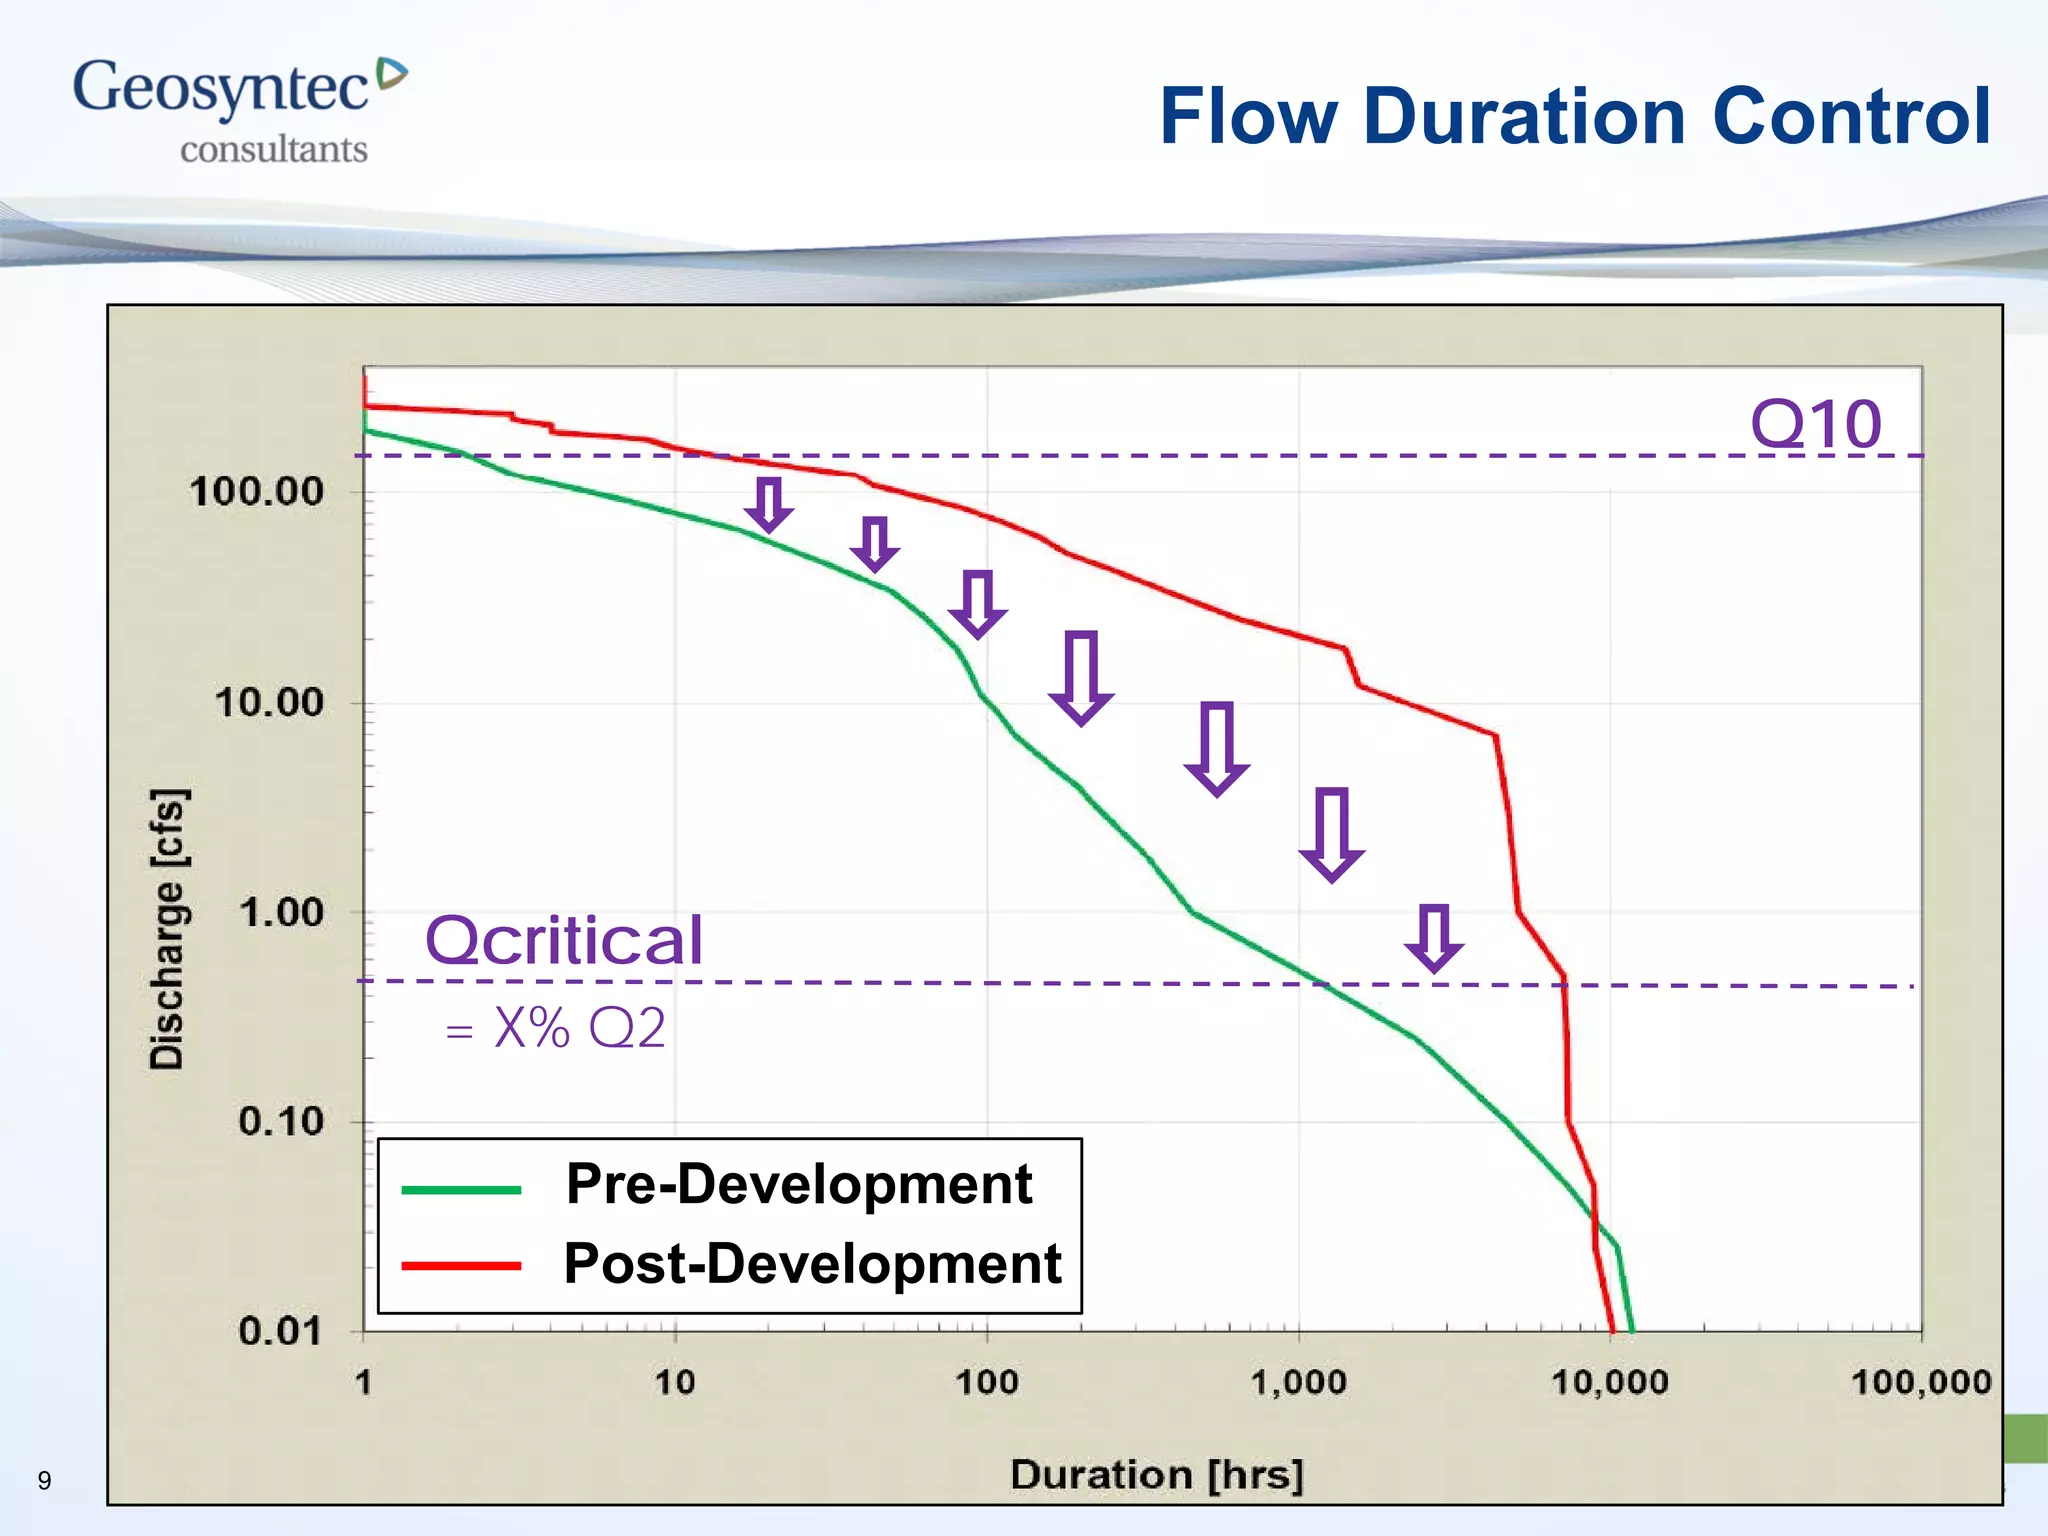
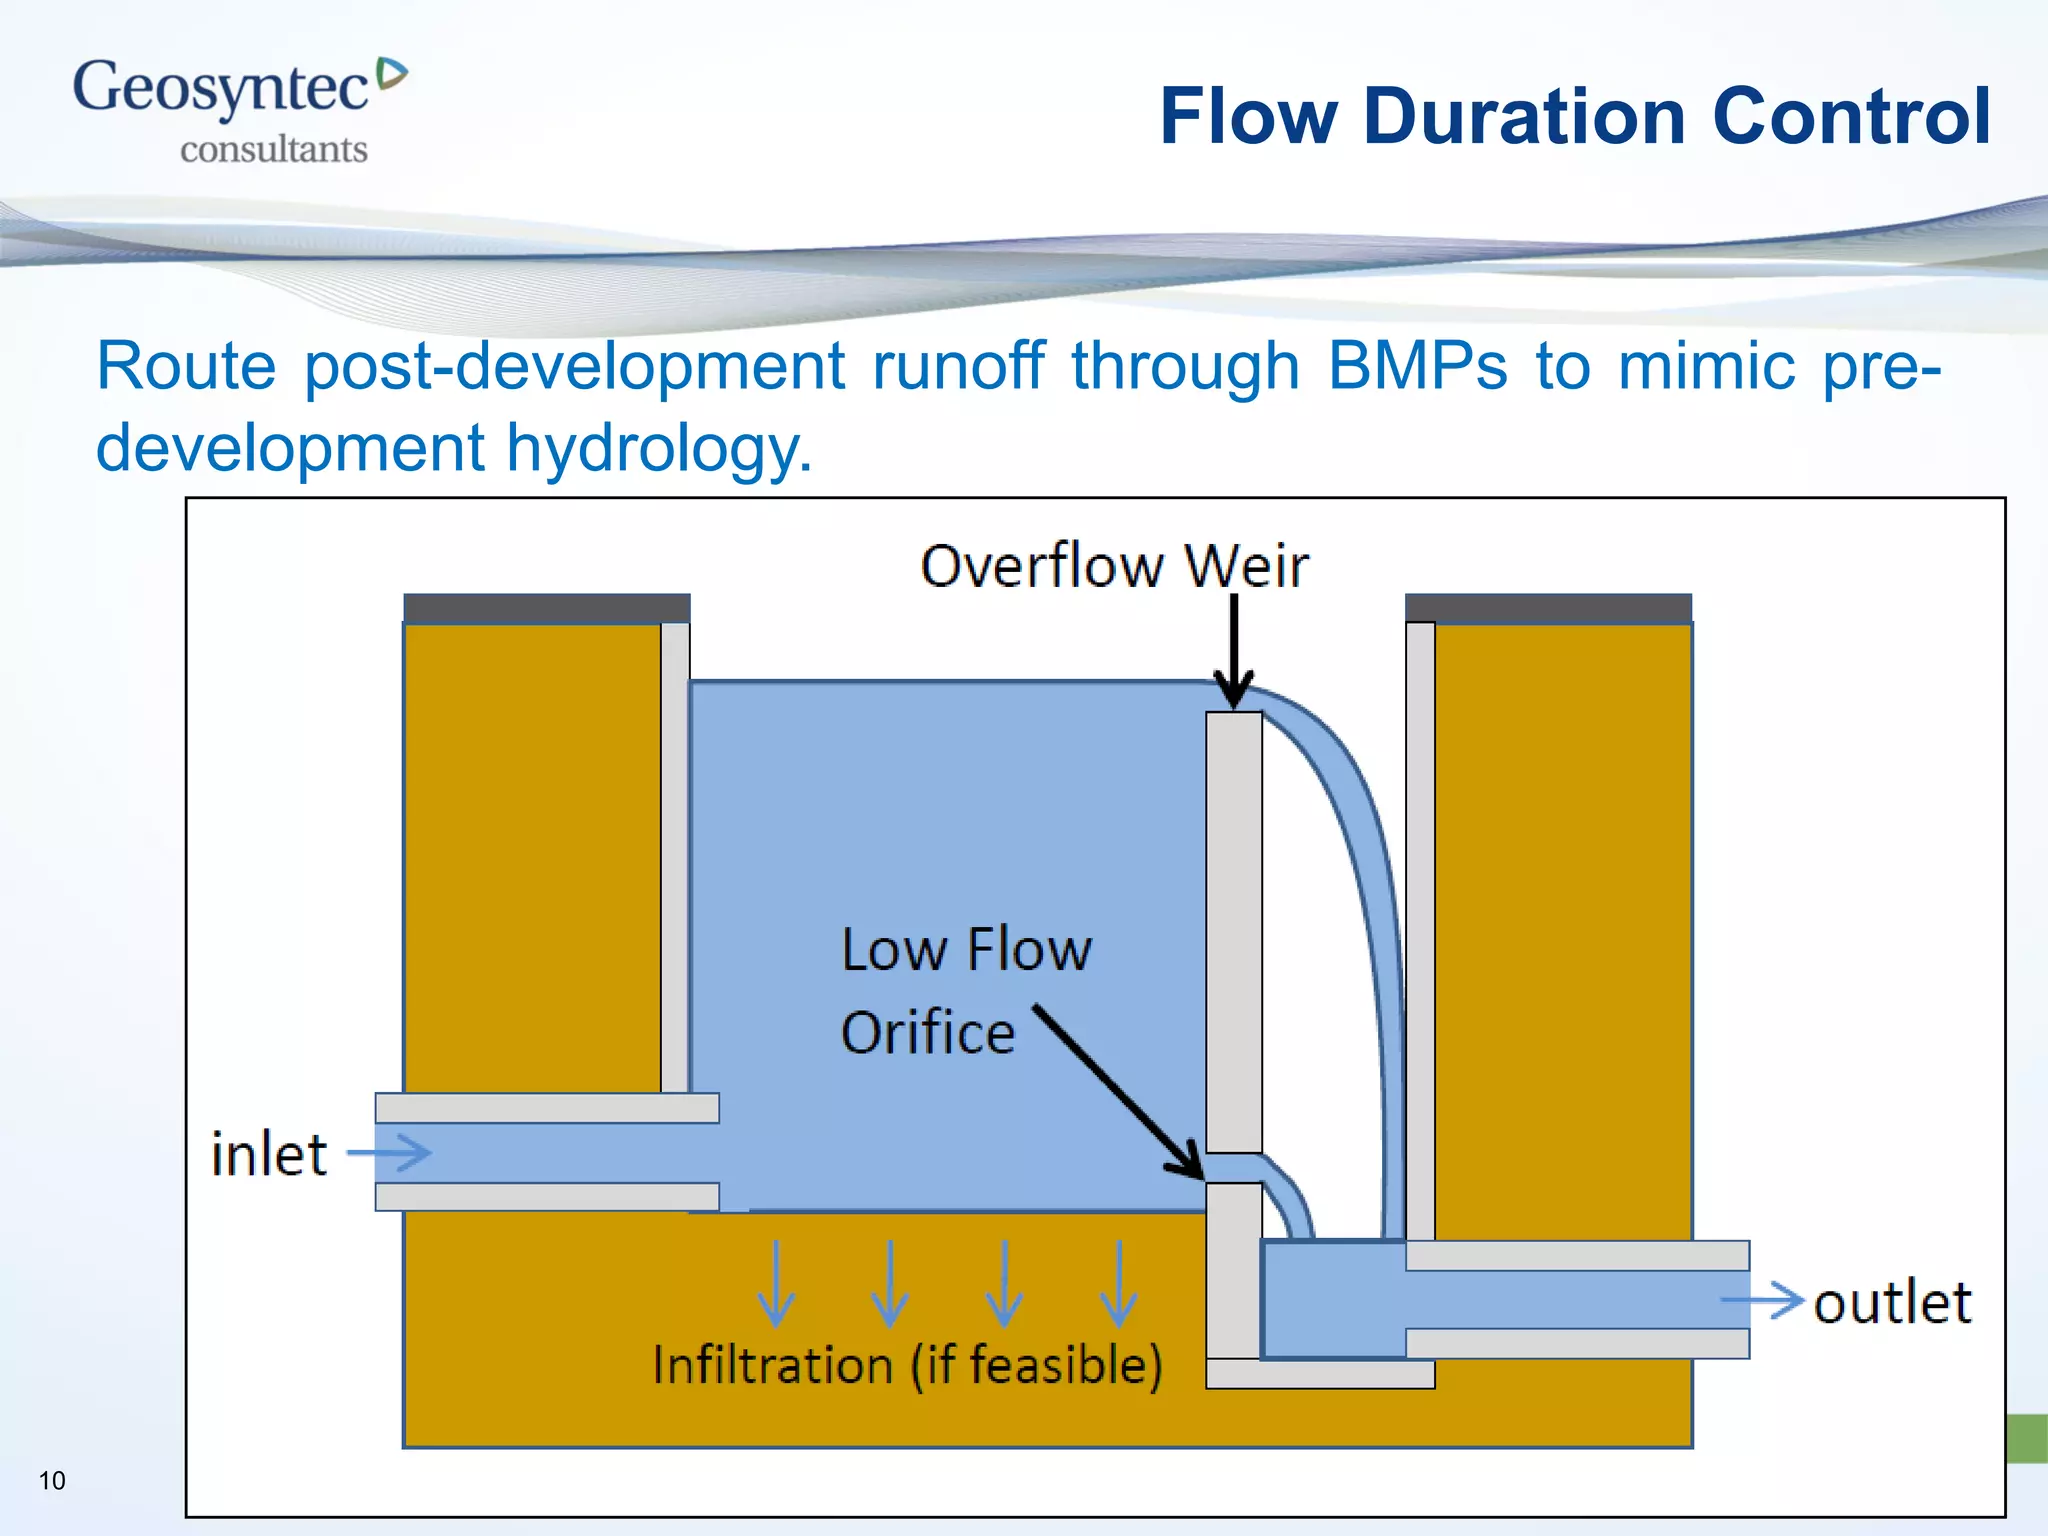
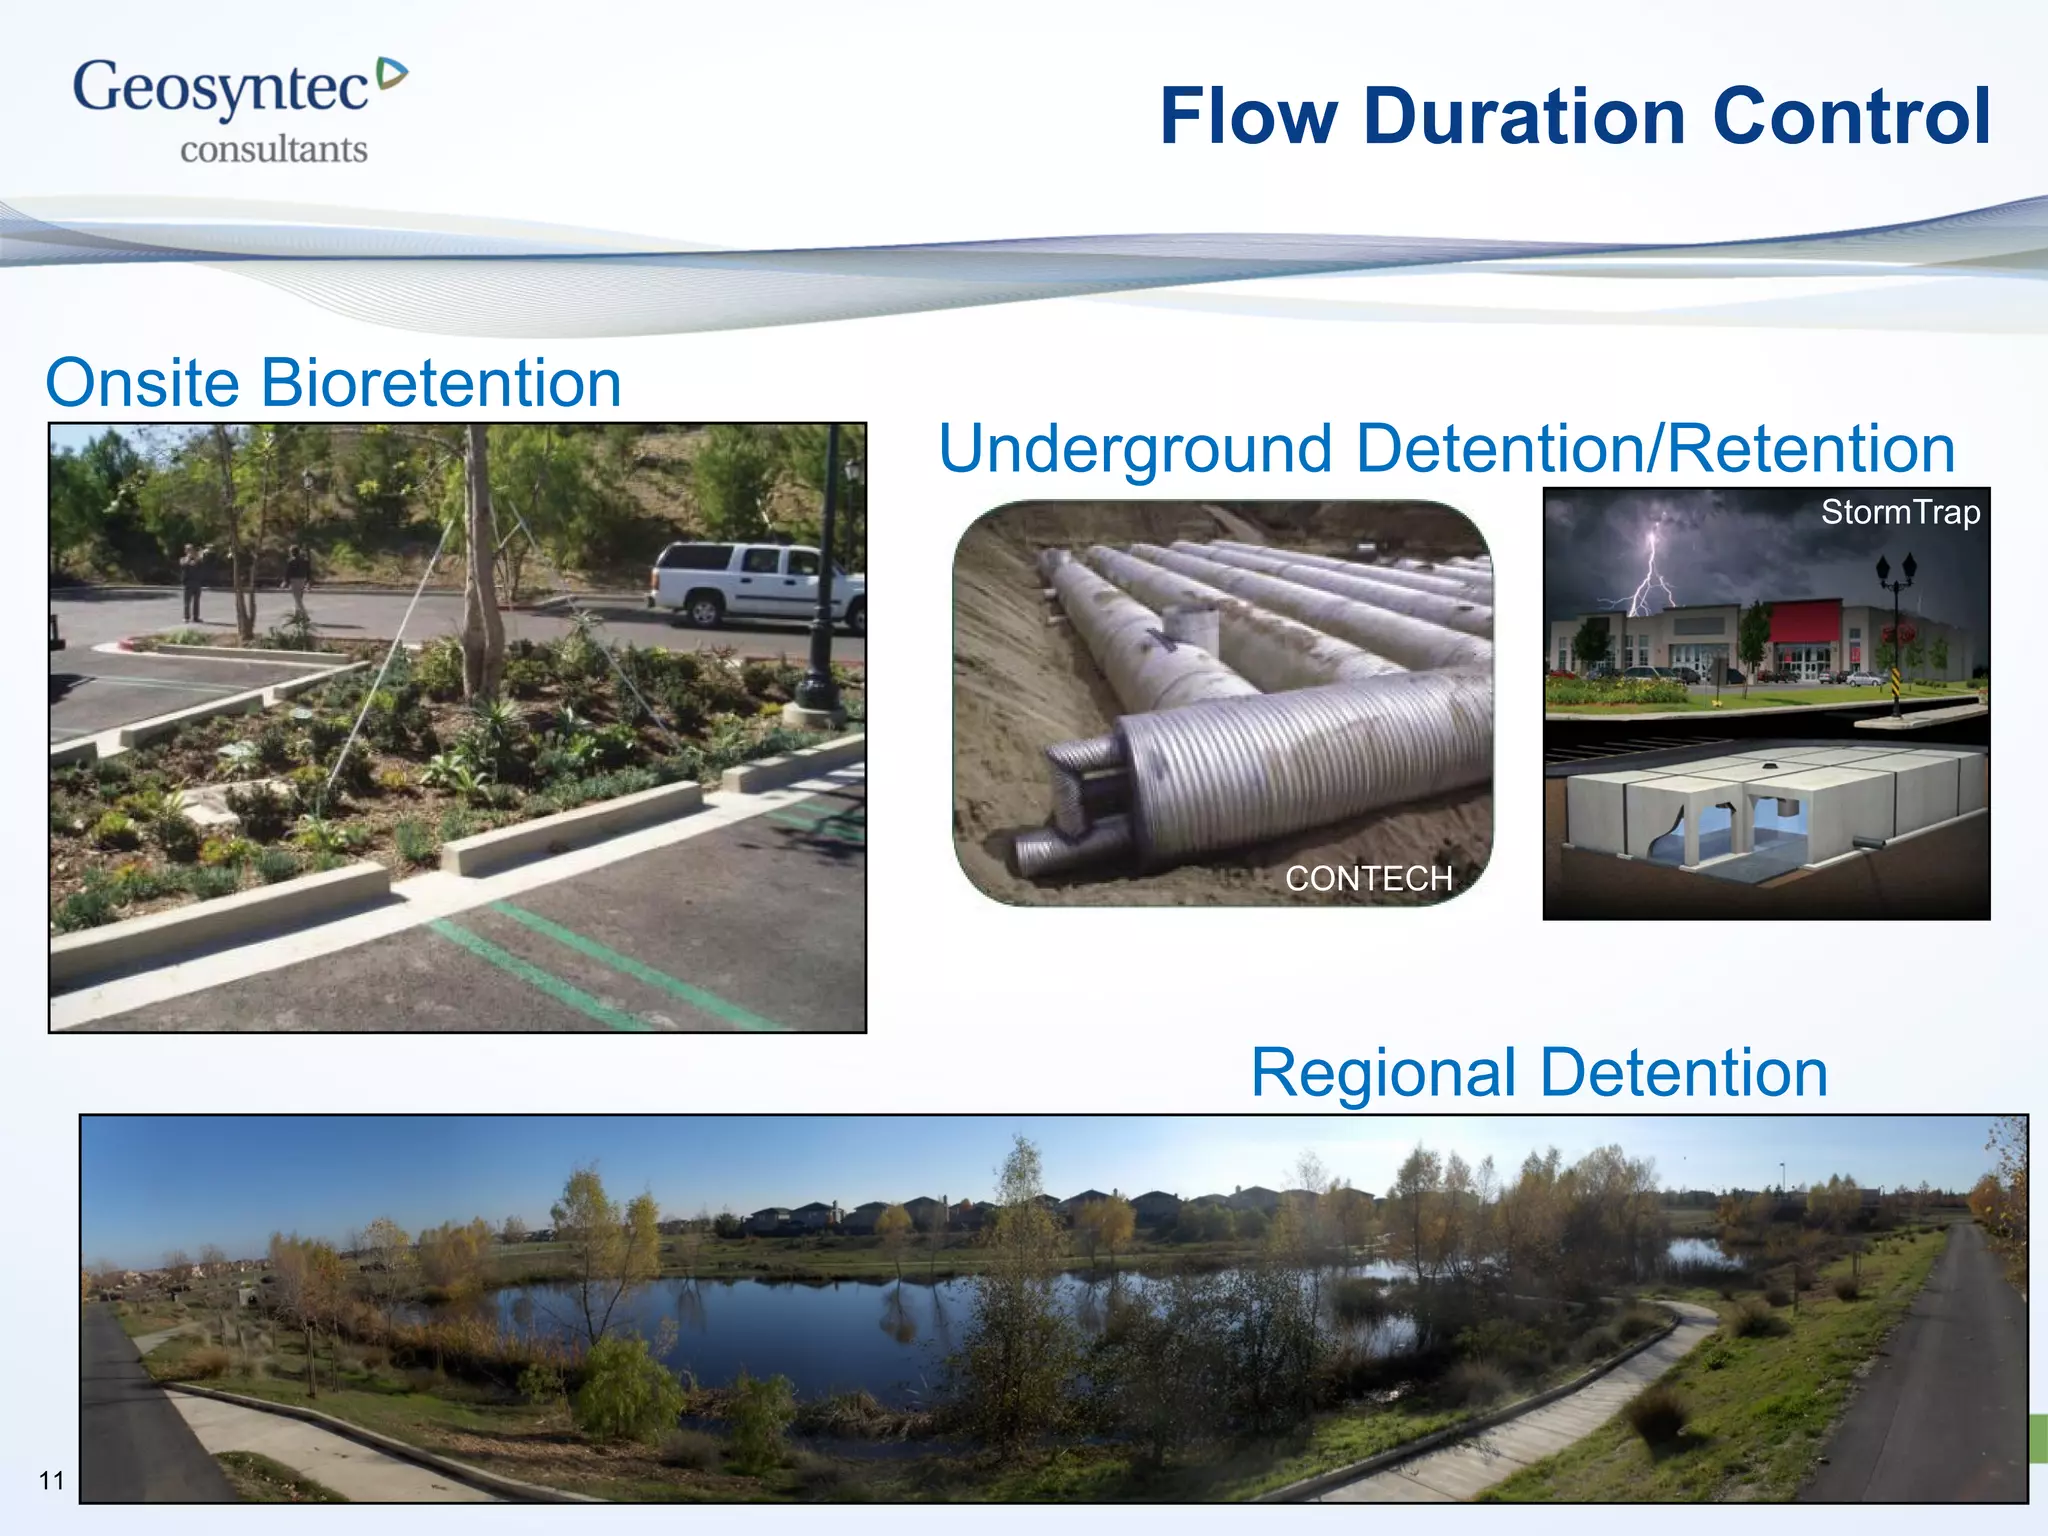
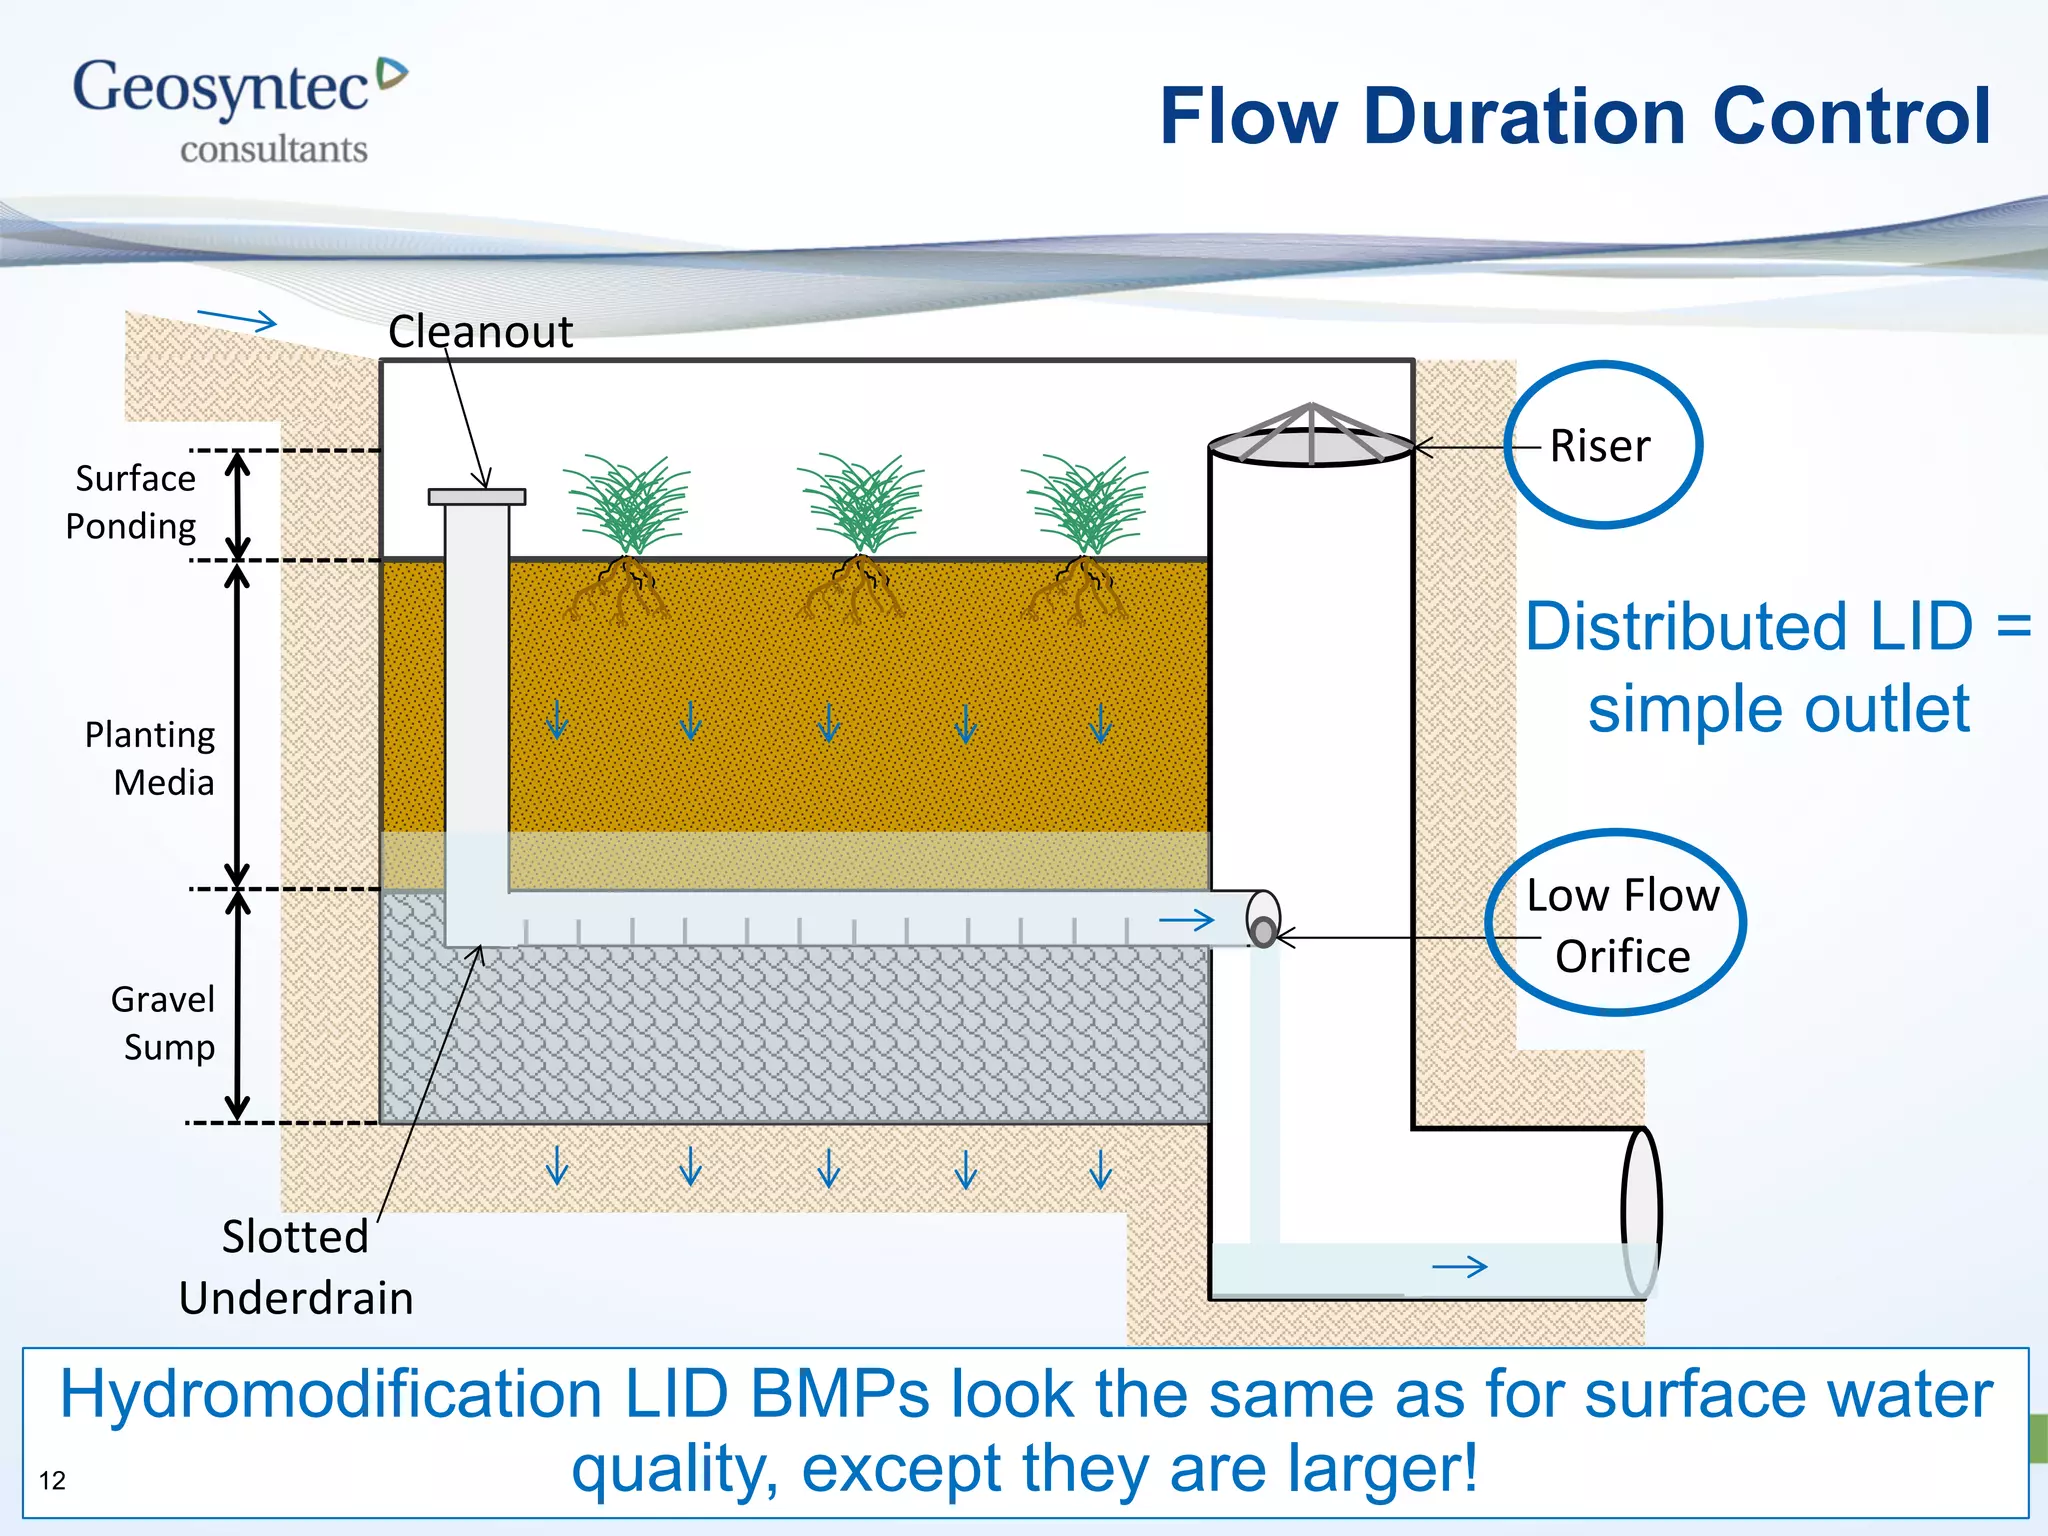
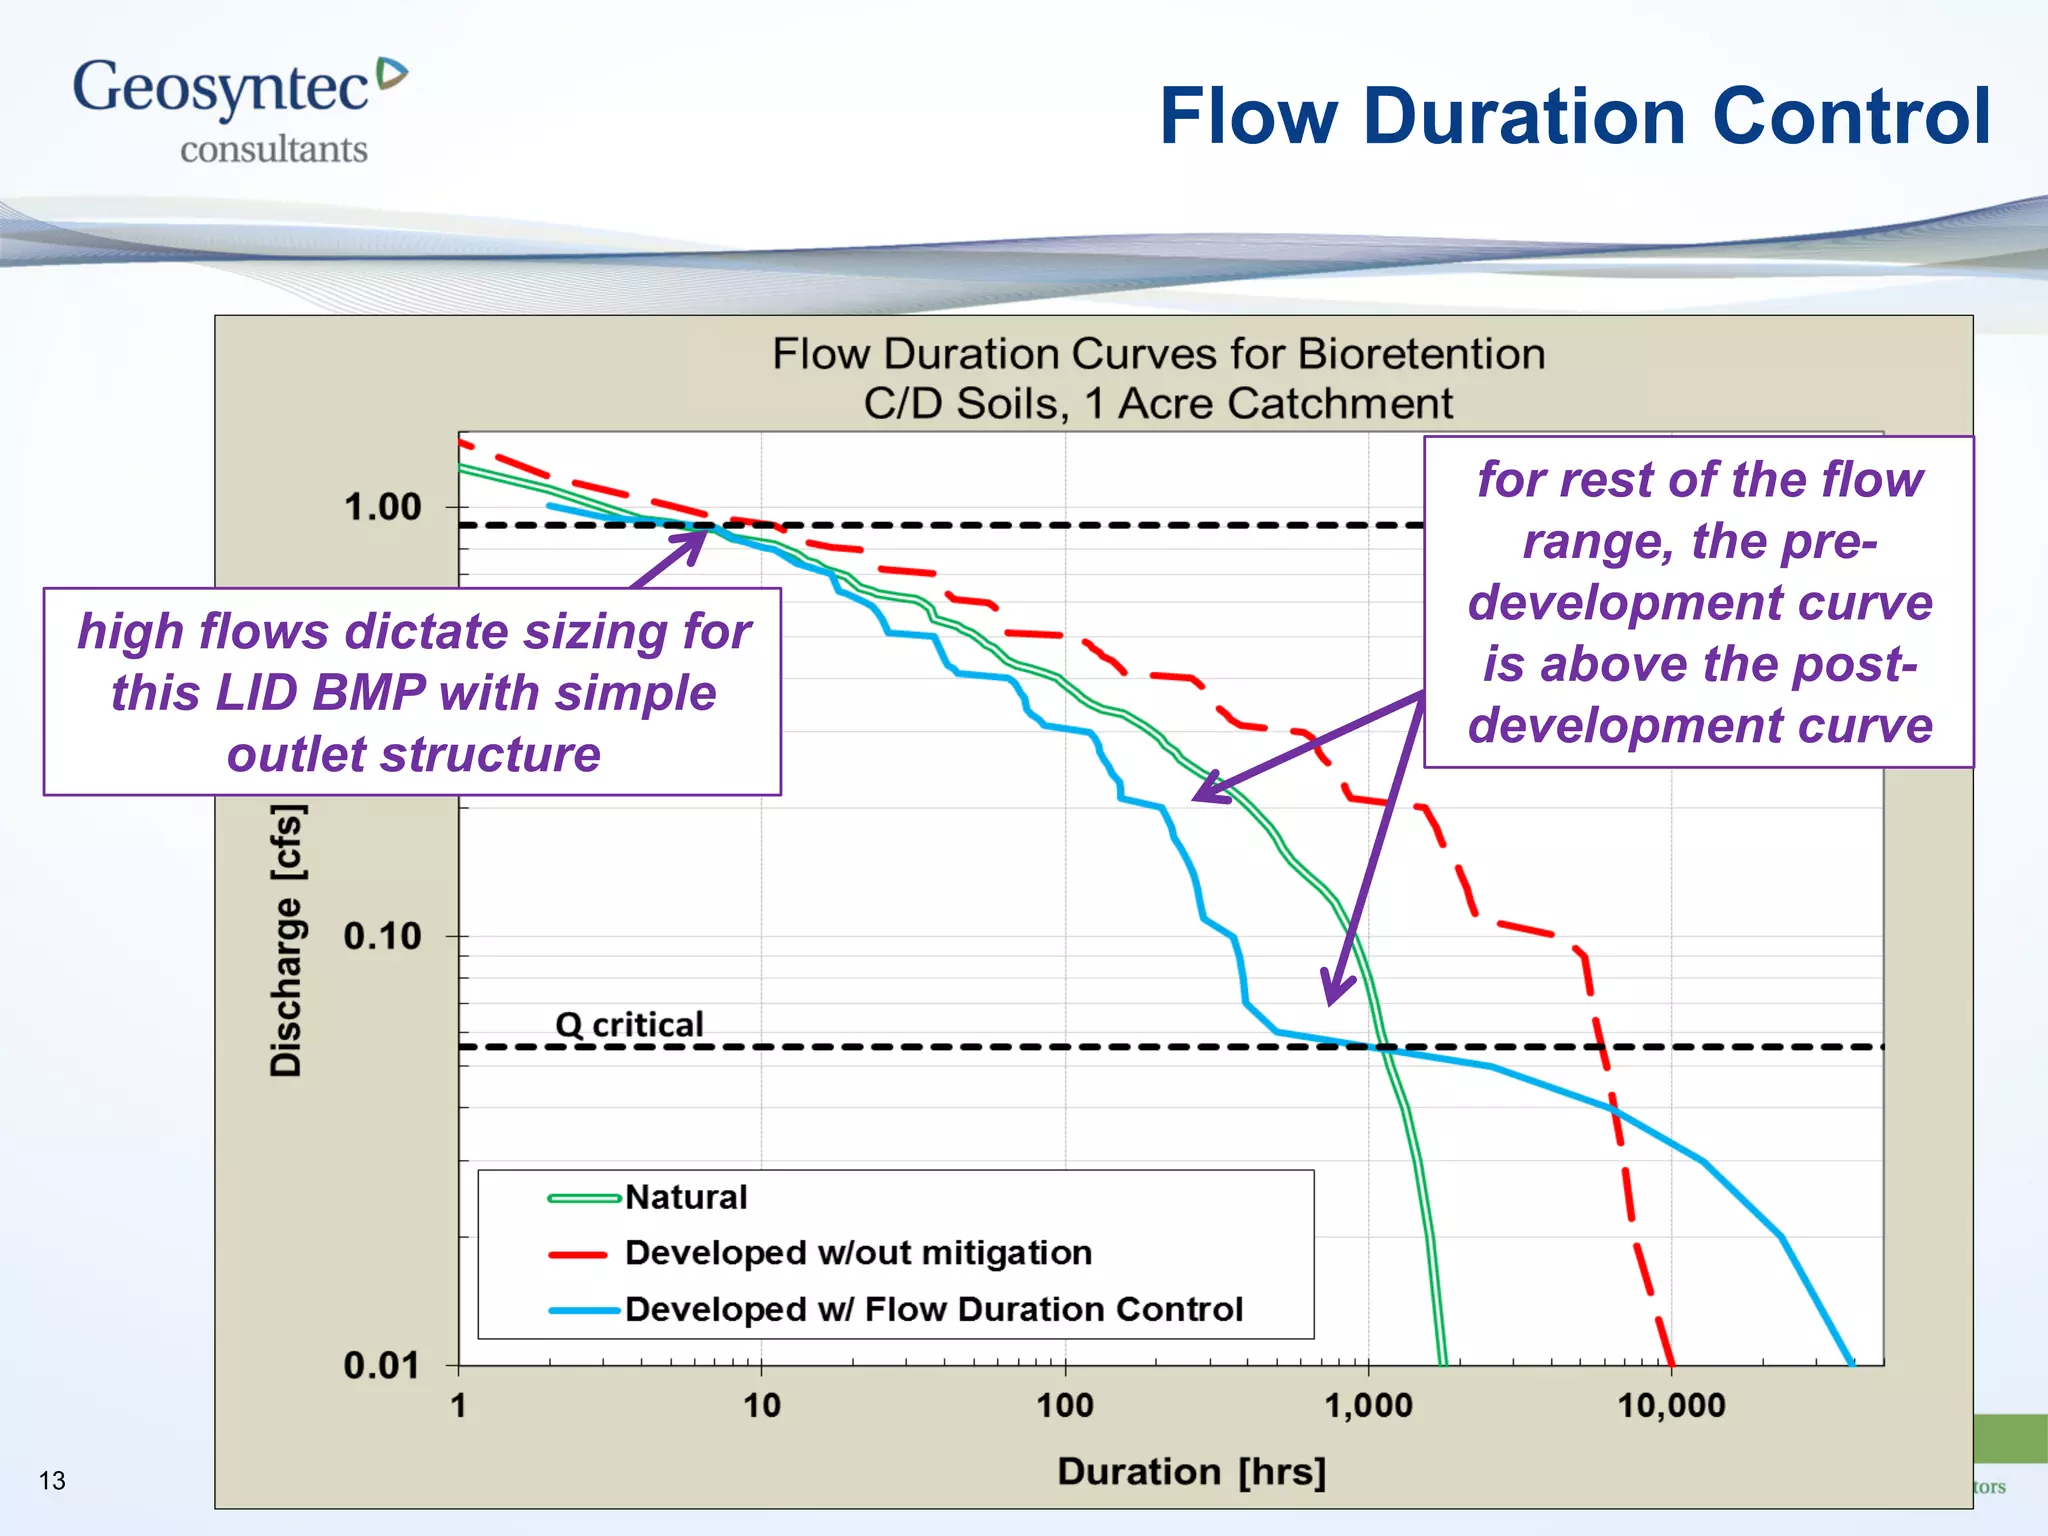
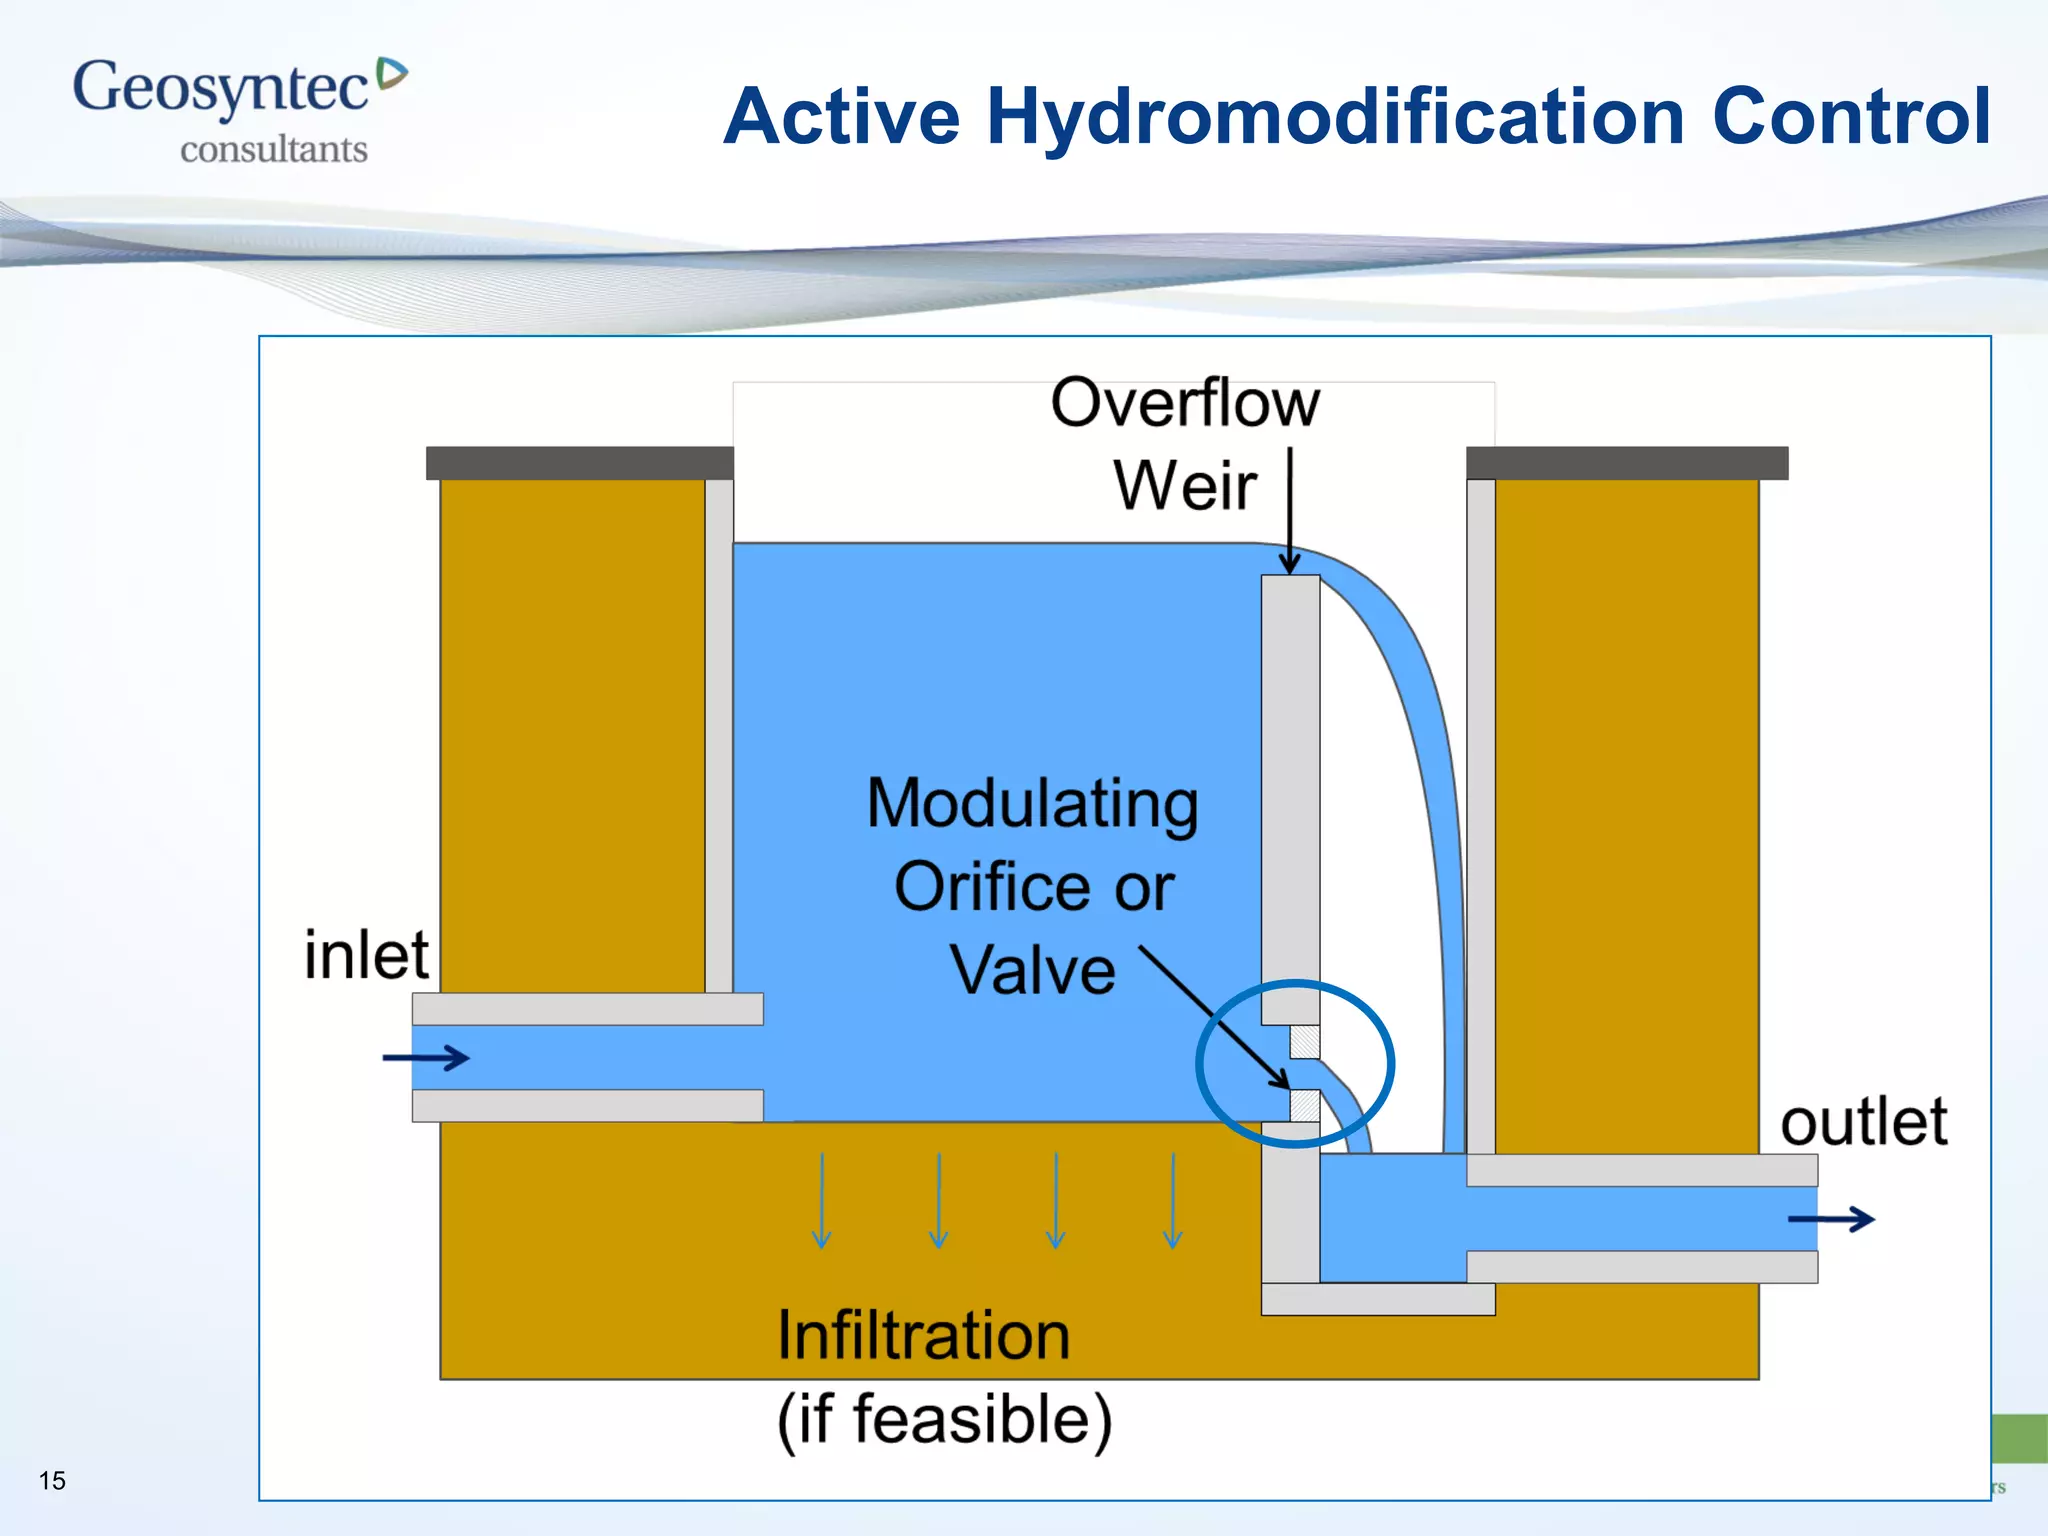
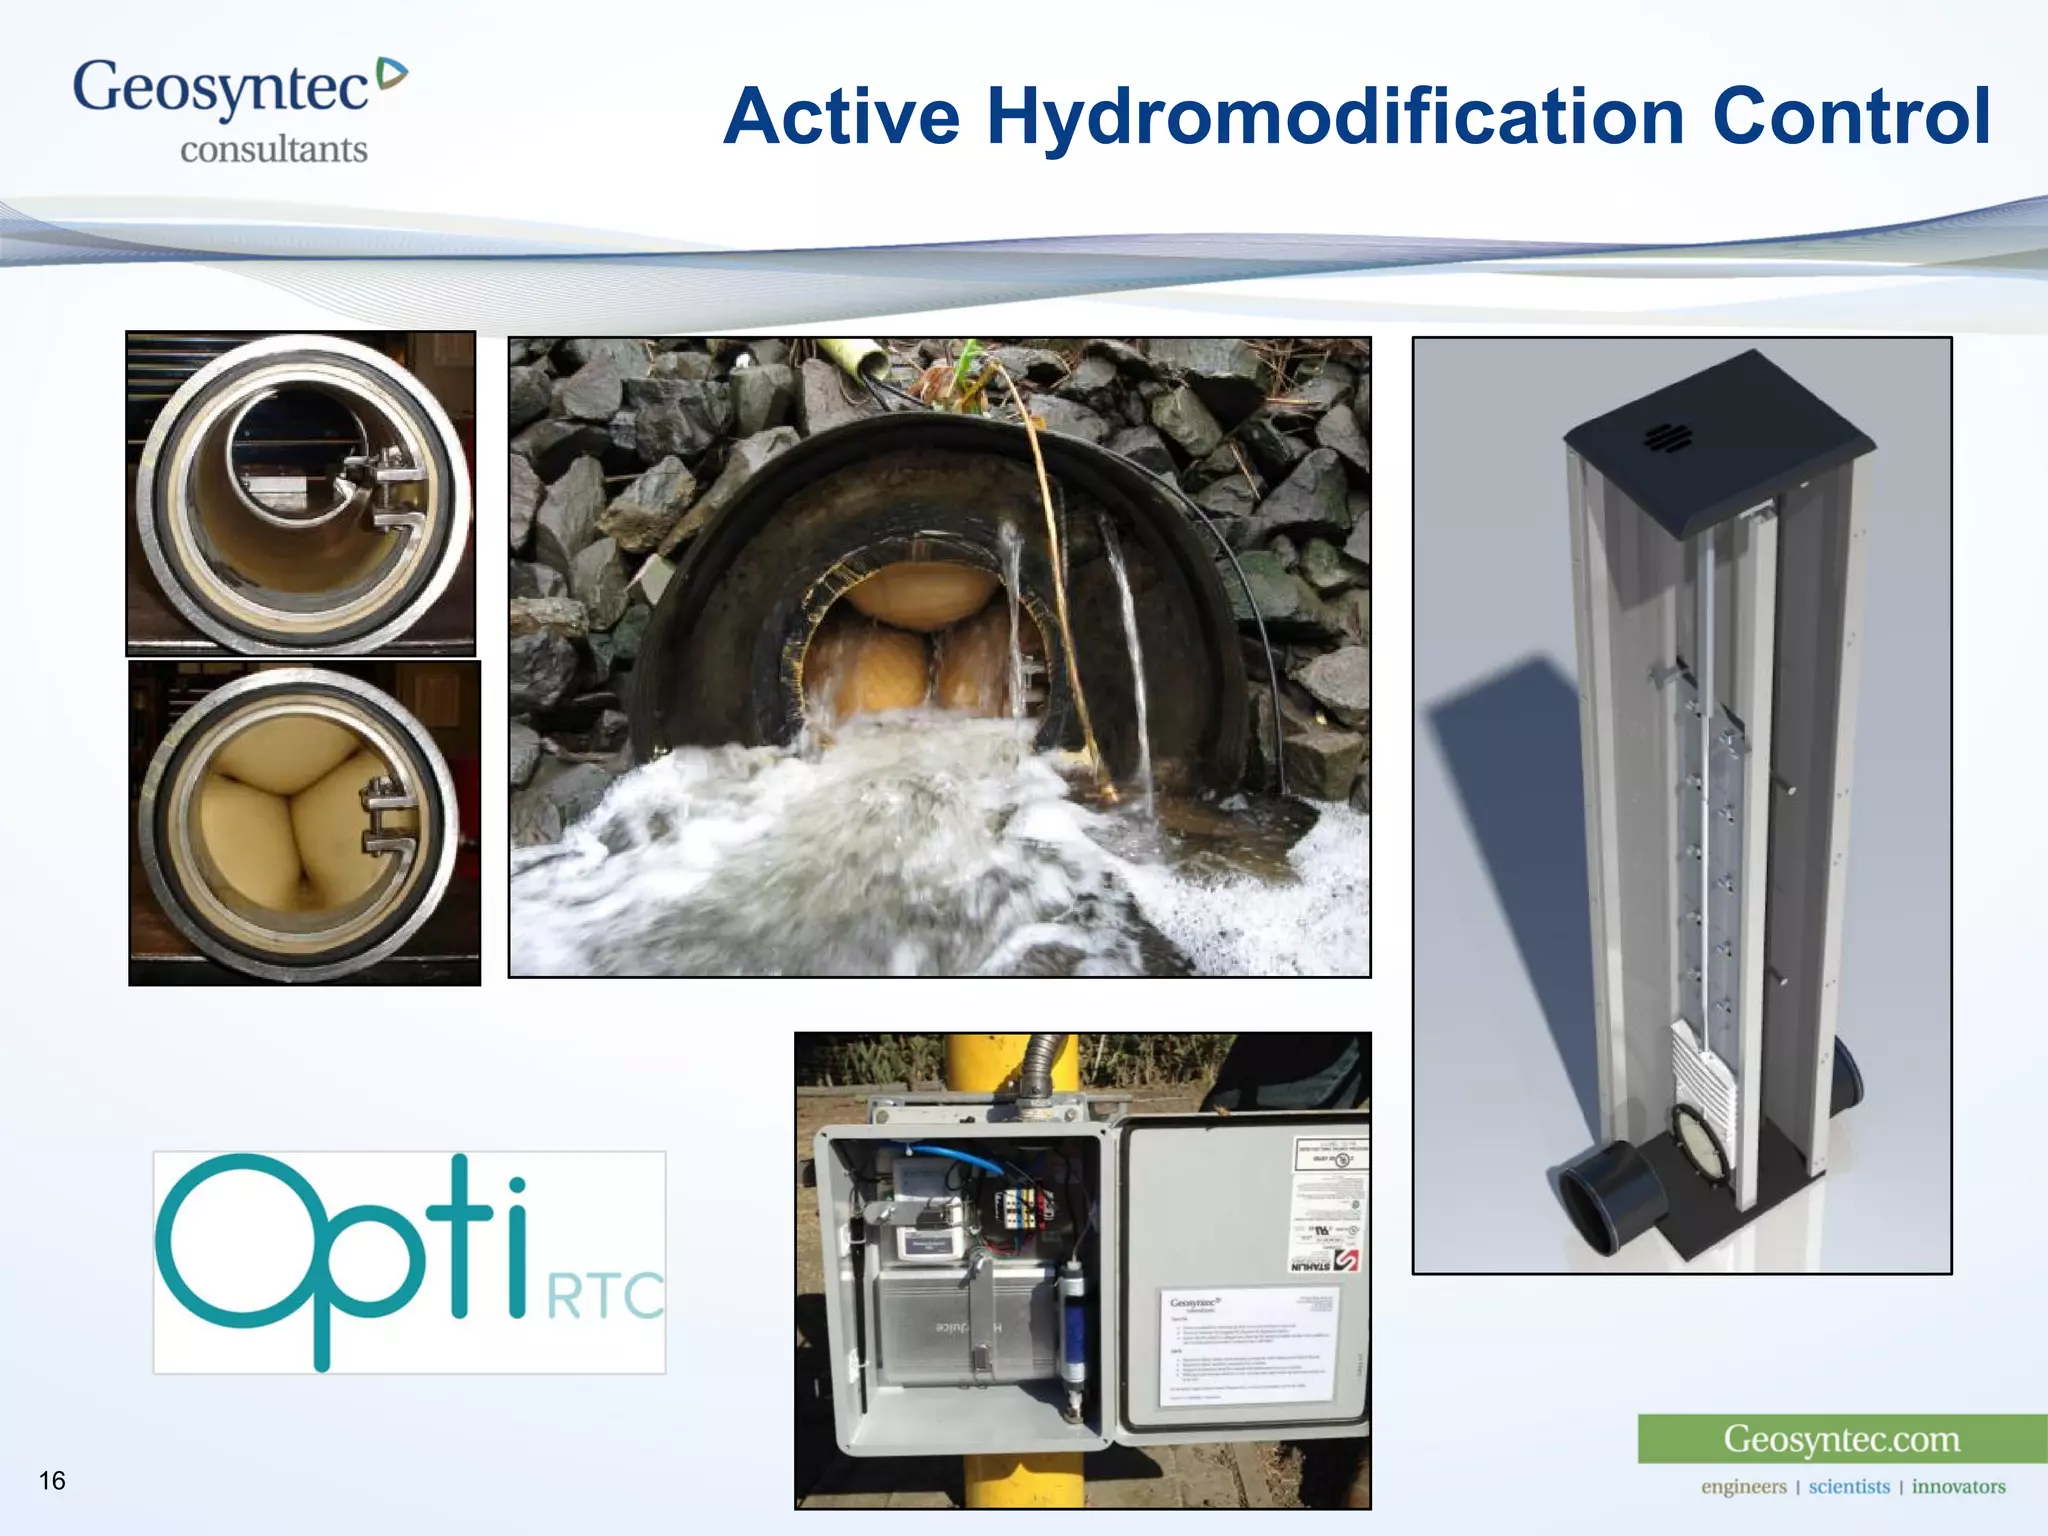
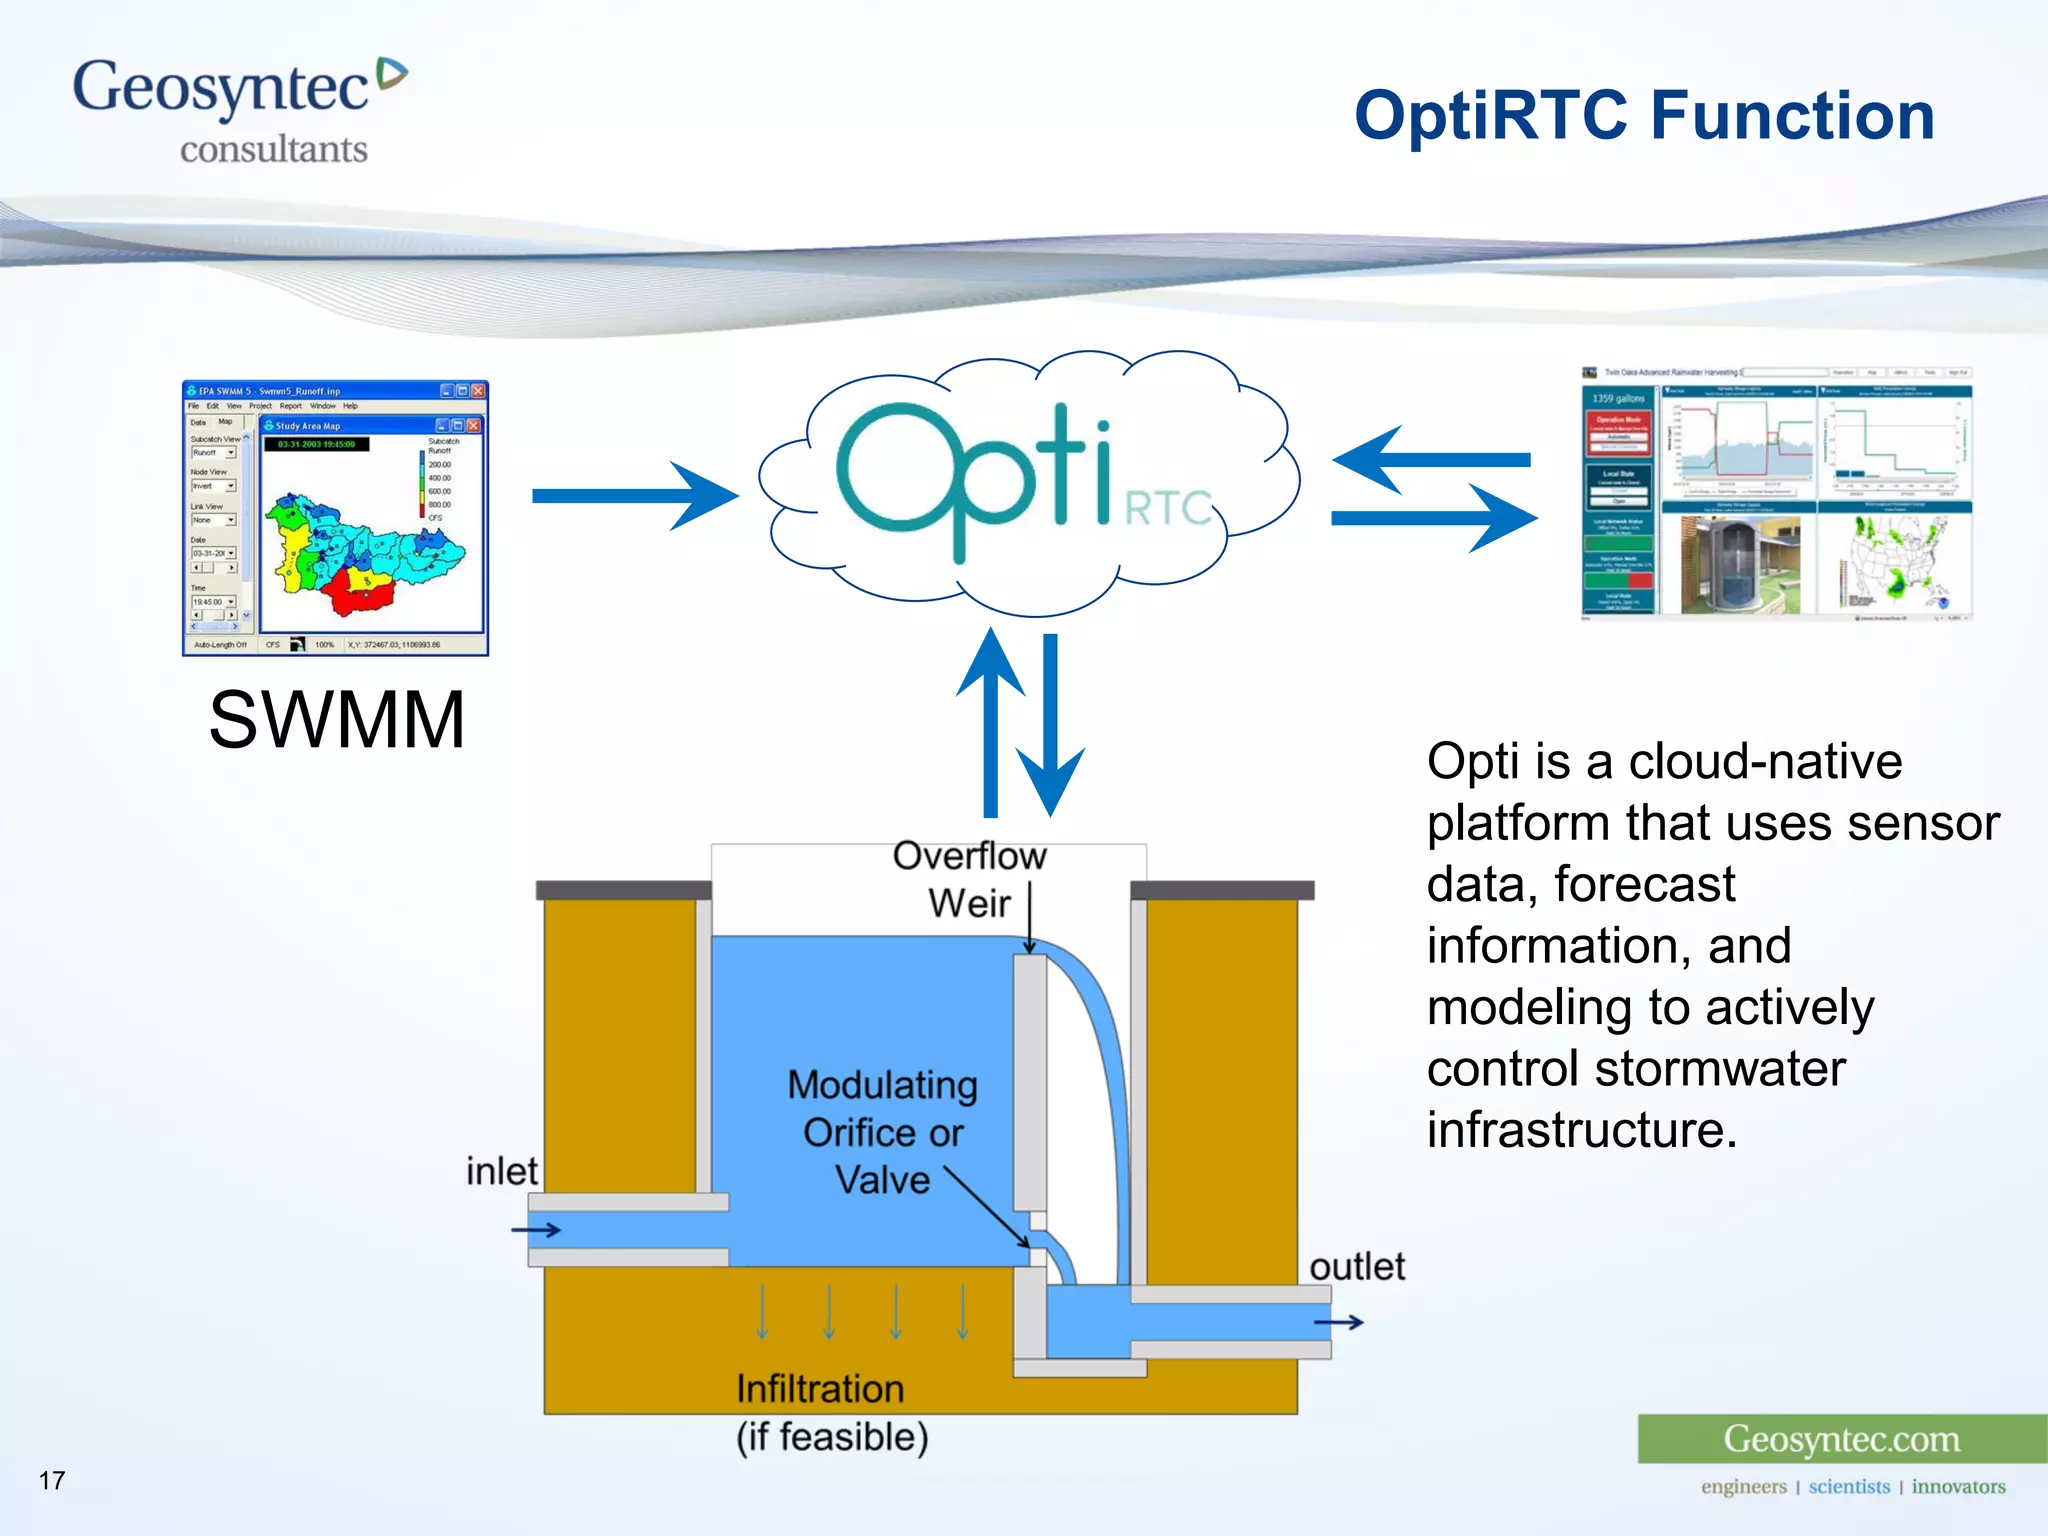
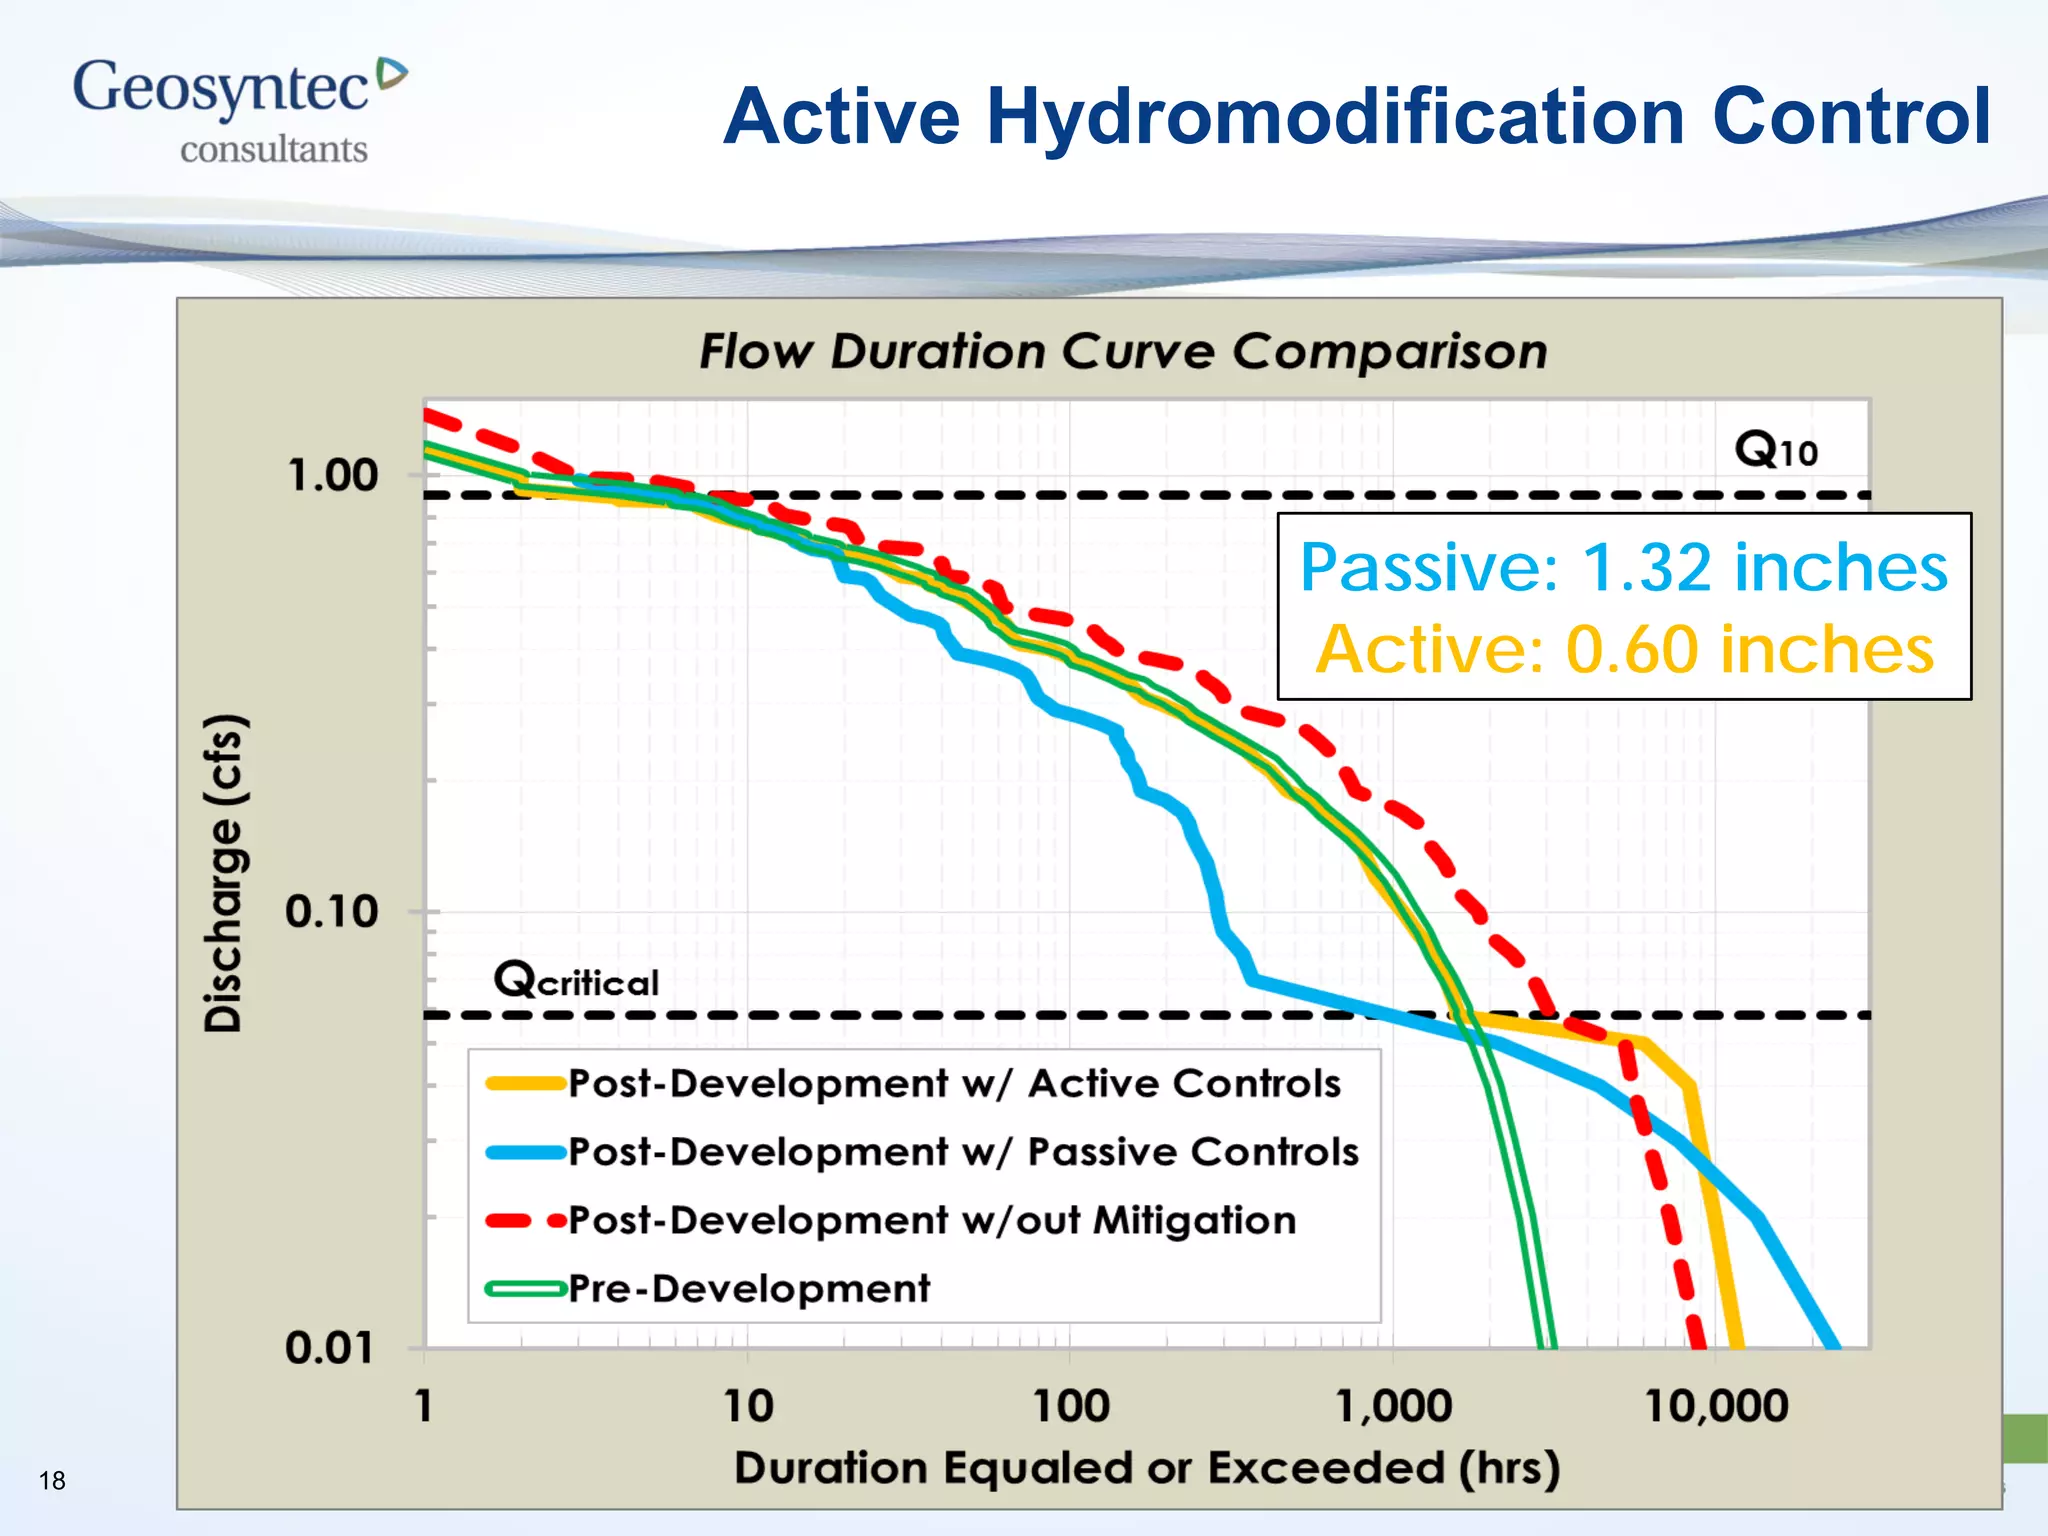
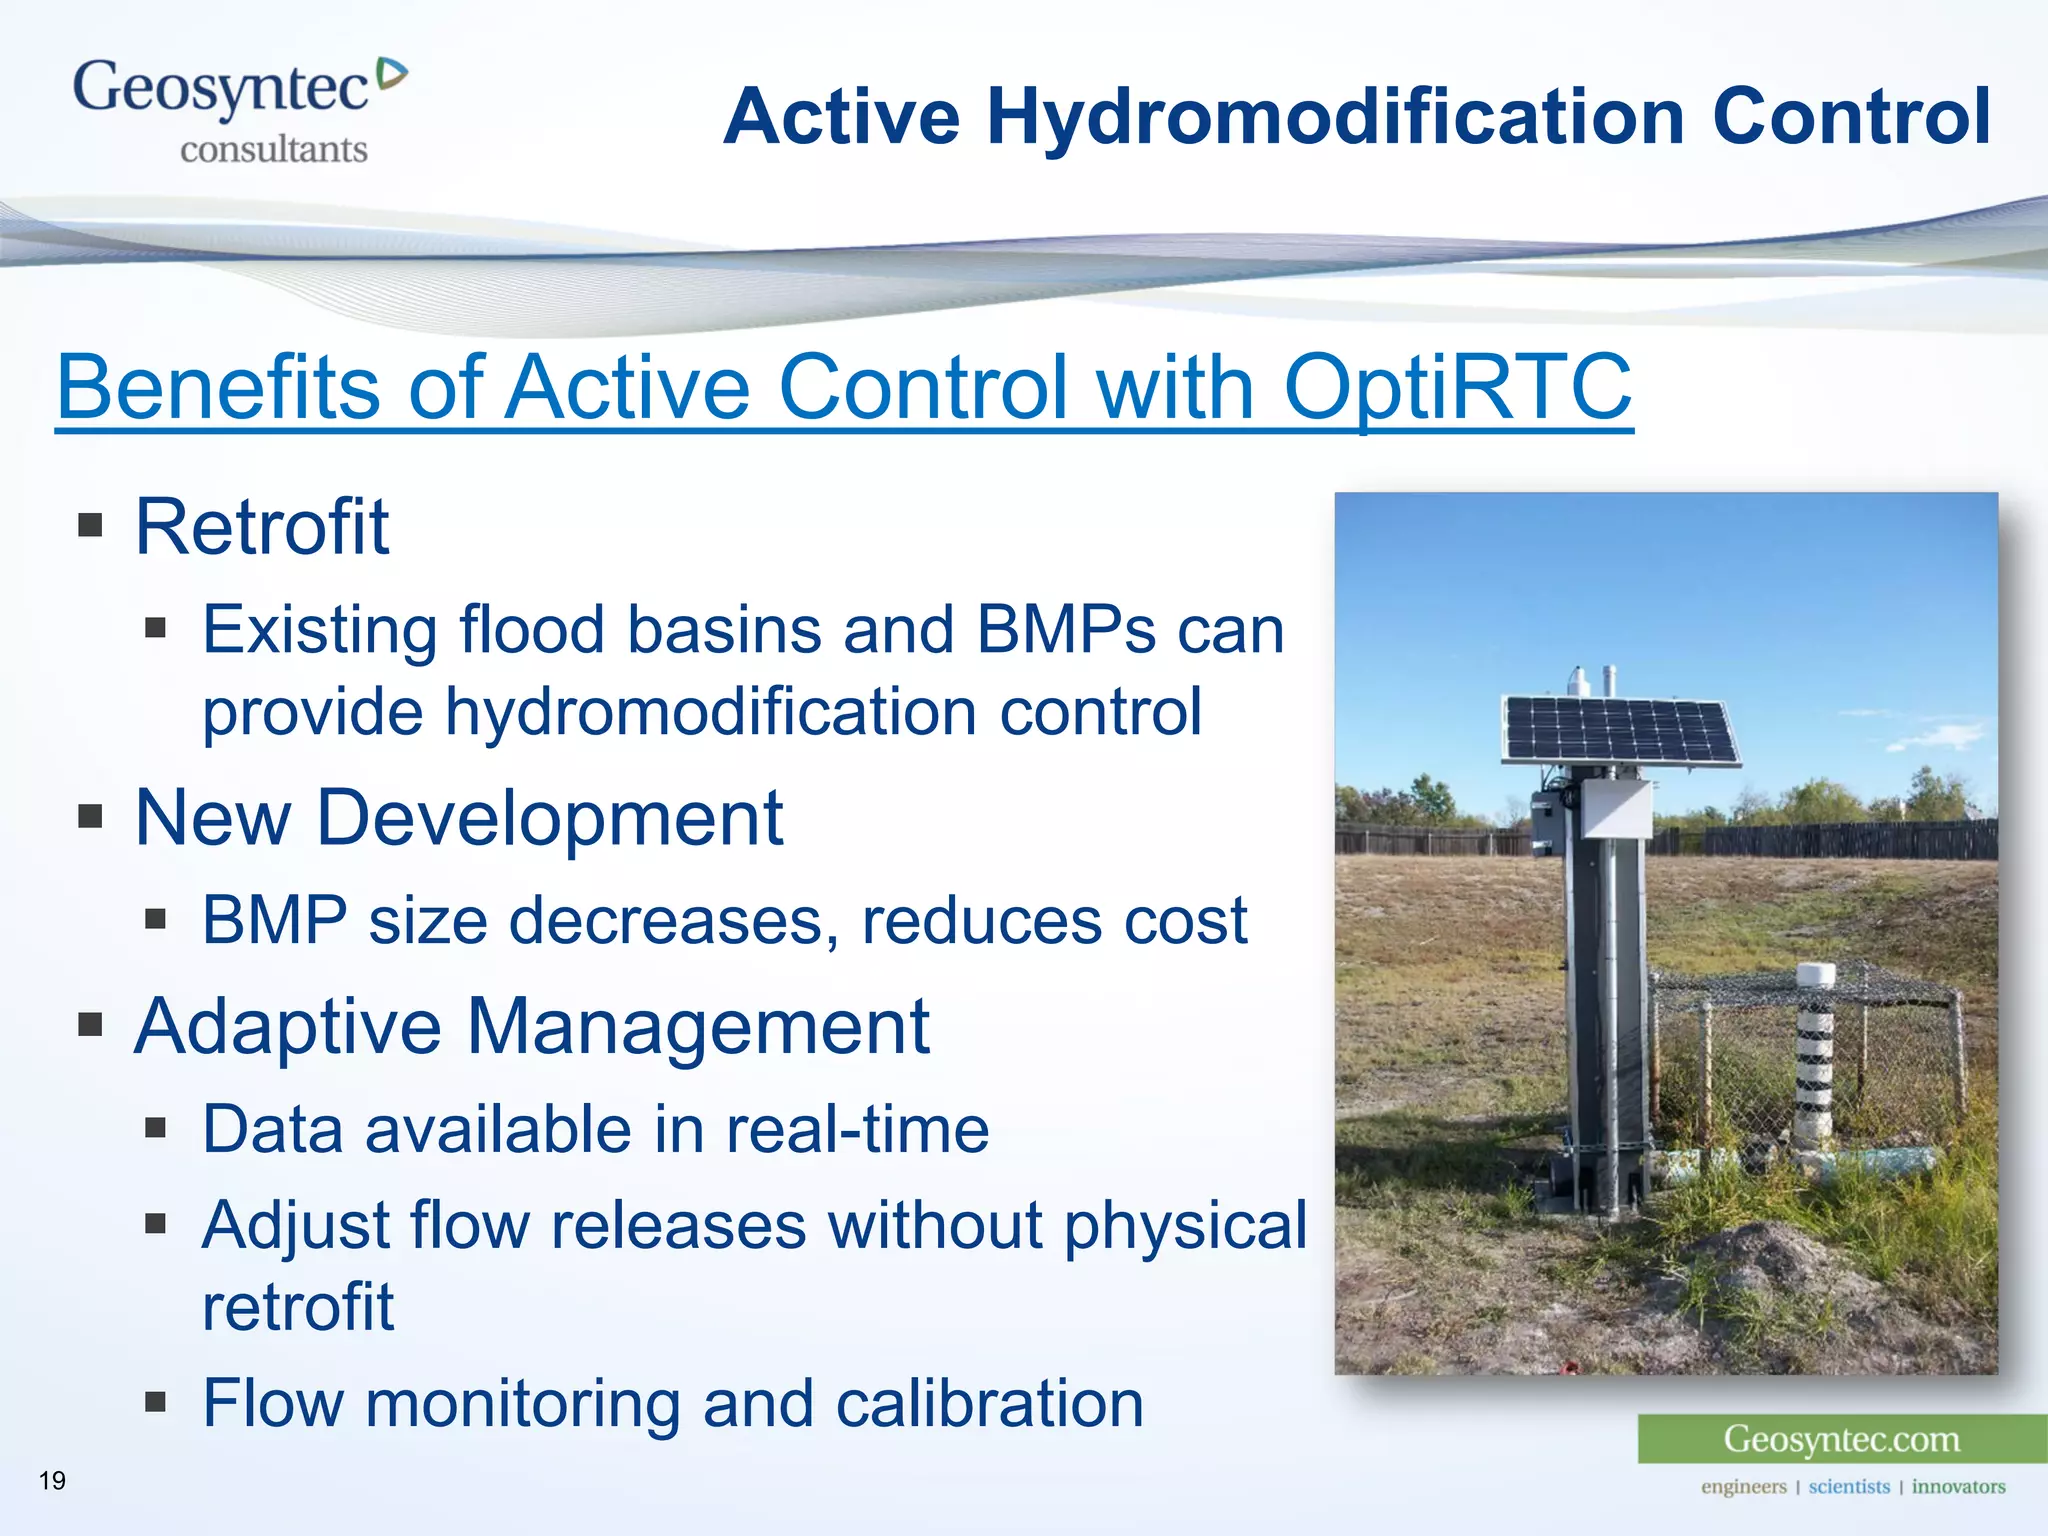

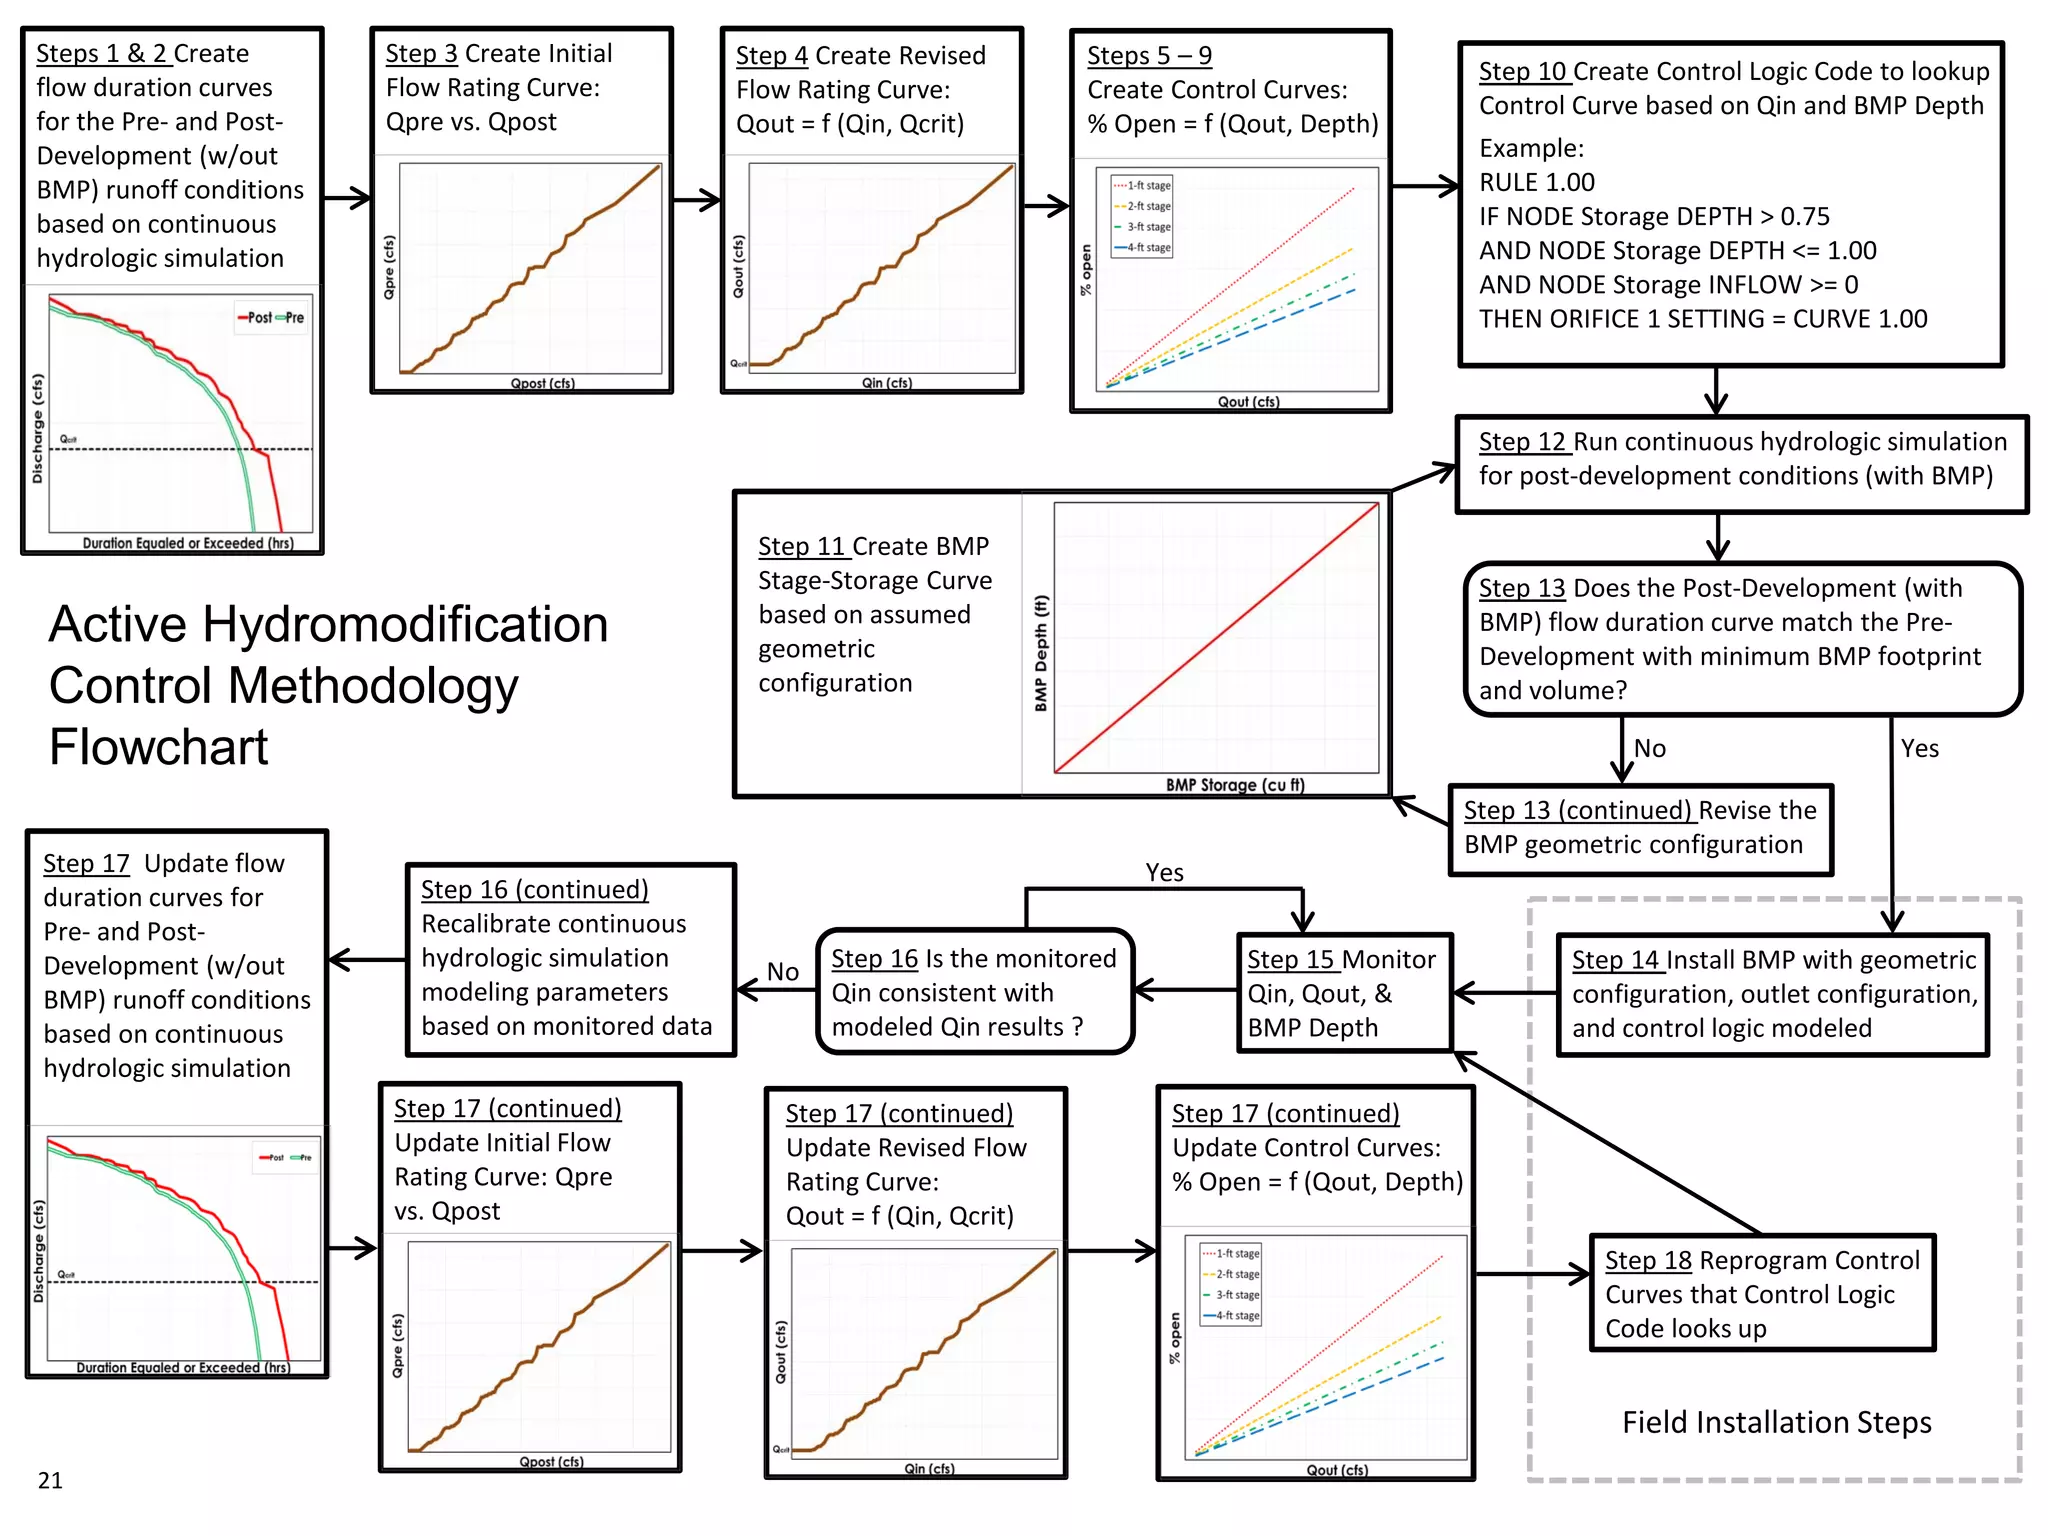

This document discusses active hydromodification control. It begins by defining hydromodification as changes to runoff characteristics and in-stream processes caused by altered land use. It then discusses flow duration control, which aims to route post-development runoff through BMPs to mimic pre-development hydrology. Finally, it introduces active hydromodification control, which uses real-time sensor data and control systems to actively adjust stormwater infrastructure and better achieve flow duration targets. Benefits include using existing infrastructure for control, smaller BMP sizes, and adaptive management through continuous monitoring and calibration.


