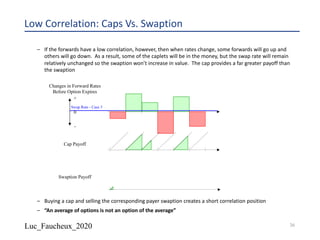
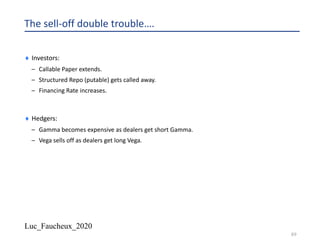
Download as PDF, PPTX

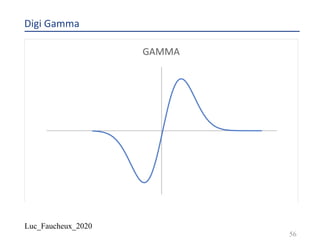
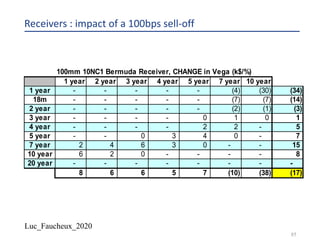
![Luc_Faucheux_2020
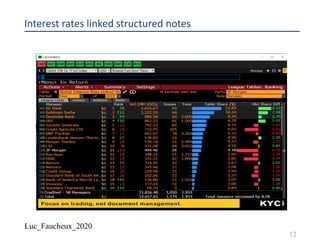
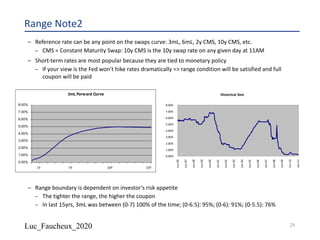
FHLMC 2.5 03/21/2025 [Corp][GO]
8](https://image.slidesharecdn.com/lf2020structured-200605171924/85/Lf-2020-structured-8-320.jpg)
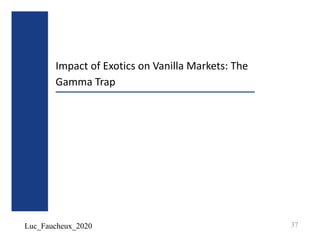
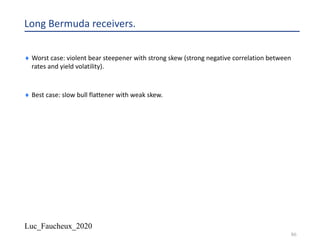
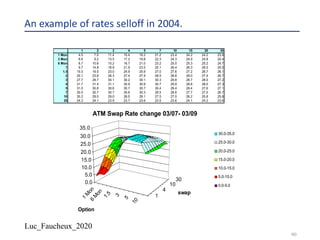
![Luc_Faucheux_2020
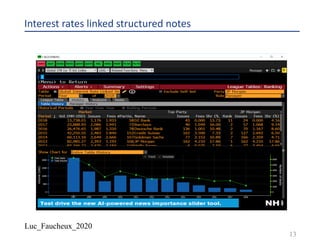
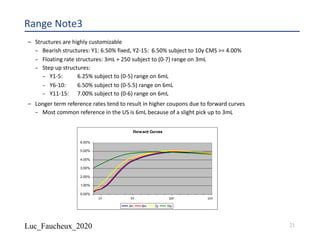
FHLMC 2.5 03/21/2025 [Corp][GO]{call}
9](https://image.slidesharecdn.com/lf2020structured-200605171924/85/Lf-2020-structured-9-320.jpg)
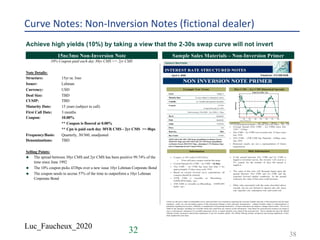
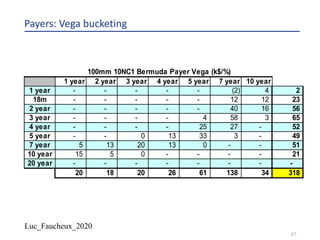
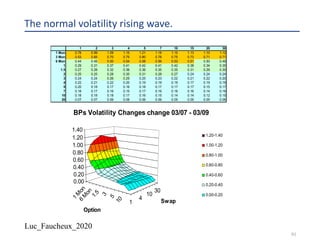
![Luc_Faucheux_2020
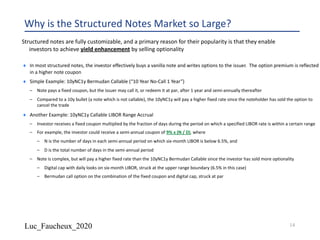
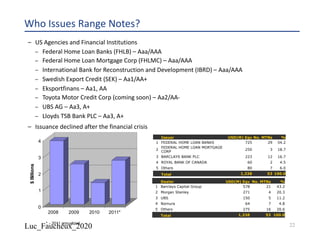
FHLMC 2.5 03/21/2025 [Corp][GO]{Coupon}
10](https://image.slidesharecdn.com/lf2020structured-200605171924/85/Lf-2020-structured-10-320.jpg)
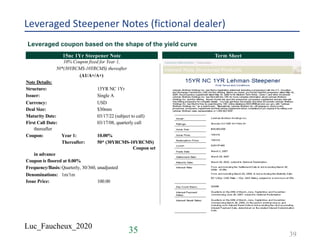


![Luc_Faucheux_2020
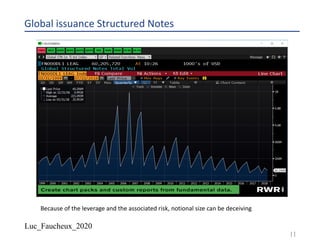
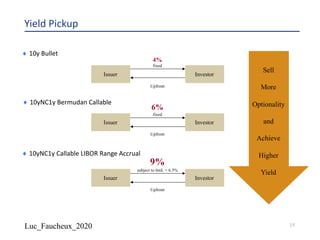
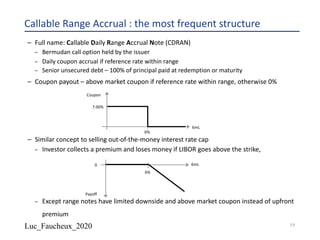
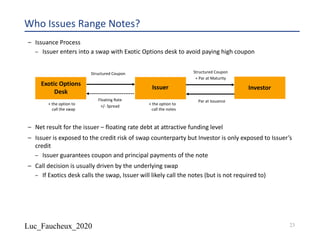
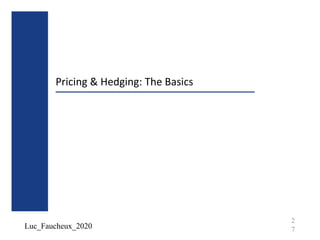
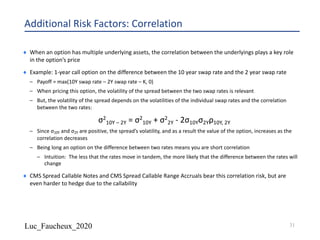
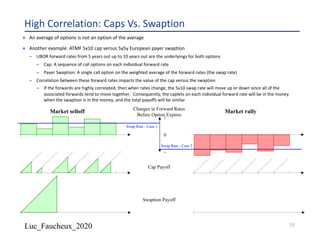
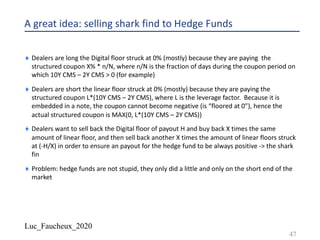
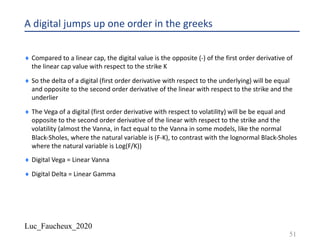
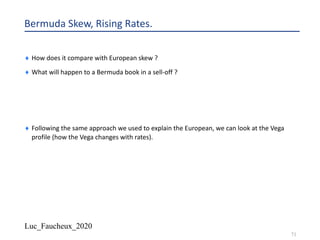
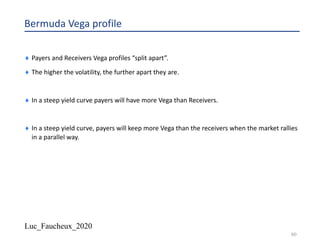
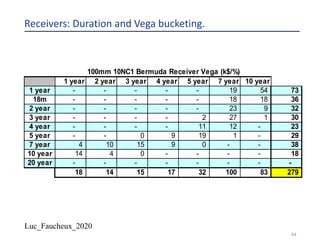
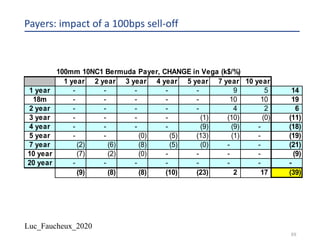
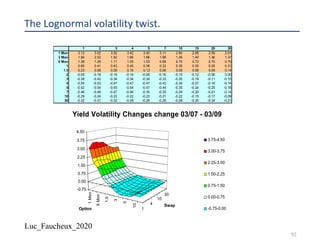
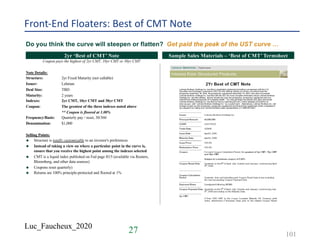
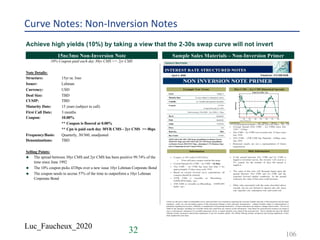
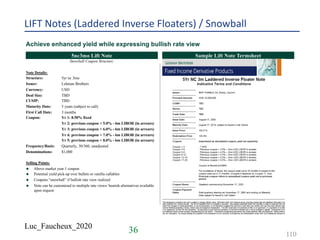
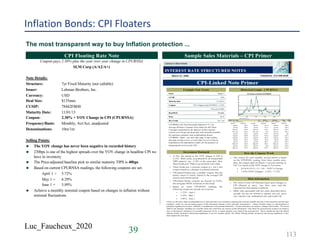
Lehman Brothers 1yr “Wedding Cake” Range Note
Single coupon at maturity if 6-month USD Libor remains within 1 of 3 ranges
“Wedding Cake” Structured Note Format
u If the First Barrier Range condition is met: [10.00%];
u Else if the First Barrier Range condition is NOT met but the Second
Barrier range is met: [8.00%];
u Else if NEITHER the First and Second Barrier Range conditions are
met but the Third Barrier range is met: [6.00%];
u Else if NONE of the Barrier Range conditions are met: 0.00%.
Lower Barrier Upper BarrierContingent
Coupon
[10.00%]
[8.00%]
[6.00%]
5.25%
5.125
%
5.00%
5.50%
5.625
%
5.75%
100%
Principal
Protection
Lehman Brothers’ U.S. Economic Outlook At A Glance
u Lehman Brothers US Economics team predicts a Fed on hold in 2007
u If this is realized, 6-month Libor should stay fairly level in 2007 as 6-
month Libor and Fed Funds are highly correlated (hist. r^2 = .972)
u Today’s Libor setting is 5.394%
31 105](https://image.slidesharecdn.com/lf2020structured-200605171924/85/Lf-2020-structured-105-320.jpg)
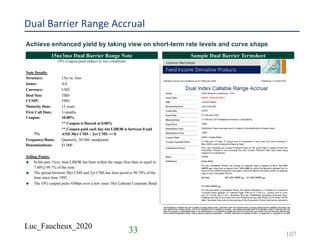
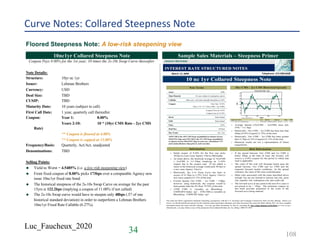
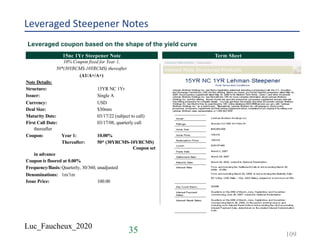
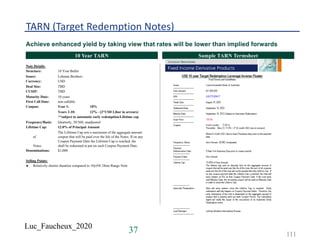

The document provides a comprehensive overview of structured products, defining them as financial instruments designed to meet specific investor needs through customized features. It discusses various types of structured products, their issuance process, investor demographics, risks, and benefits, as well as specific examples like callable notes and range accruals. The popularity of structured products stems from their ability to enhance yields while offering investors access to unique market opportunities.


