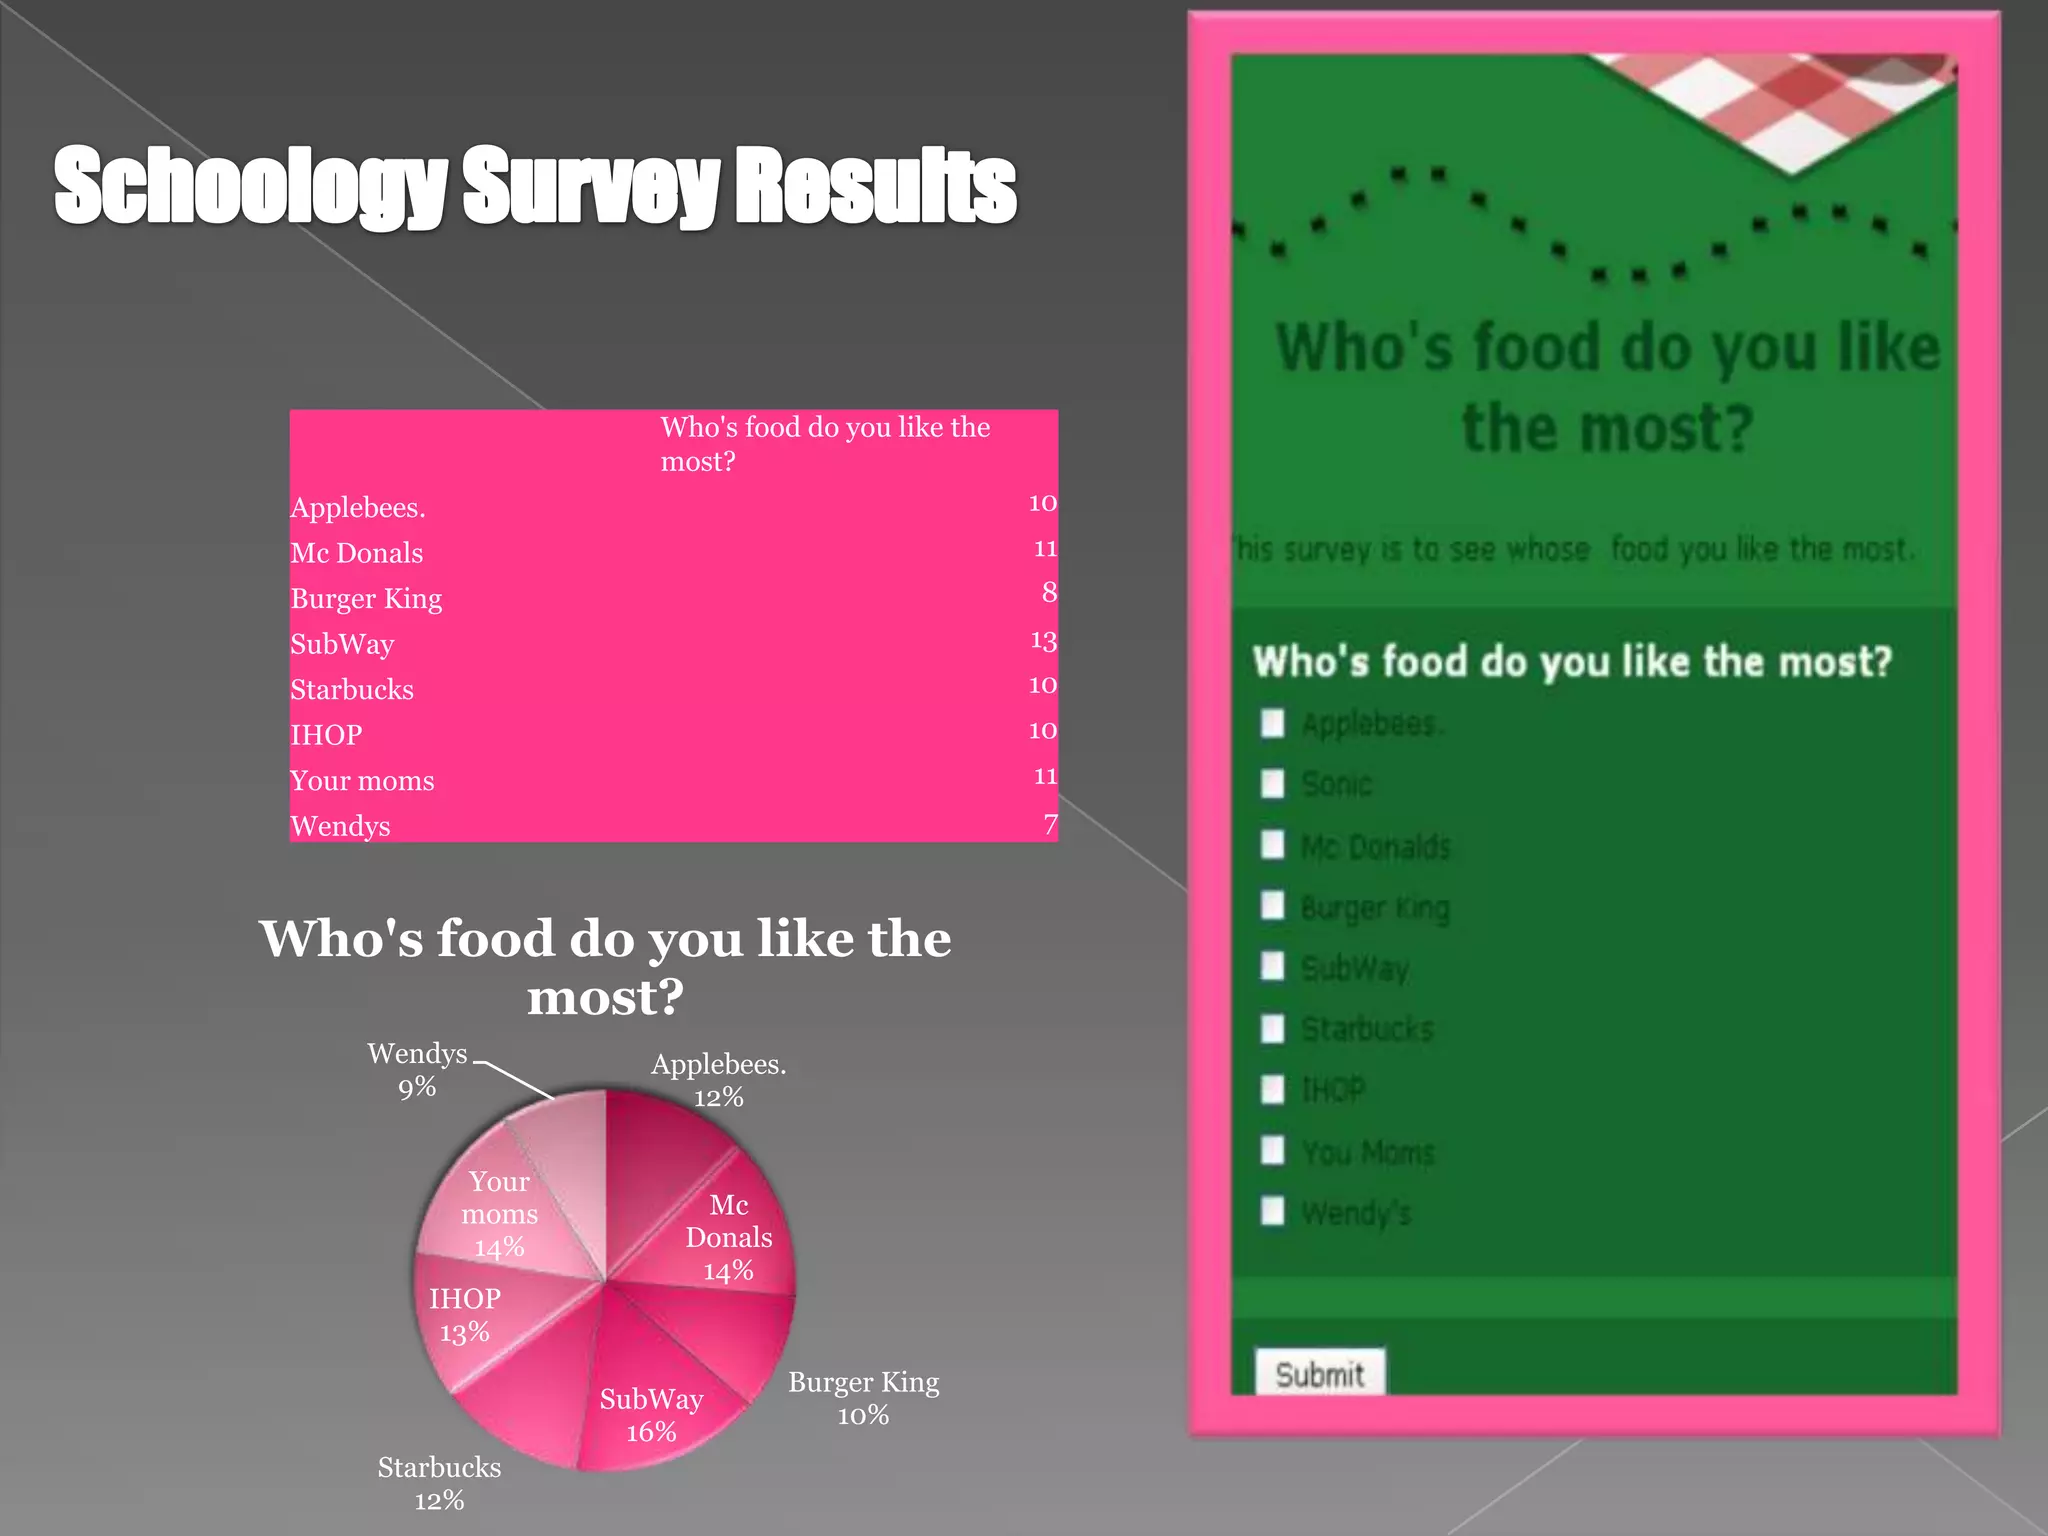
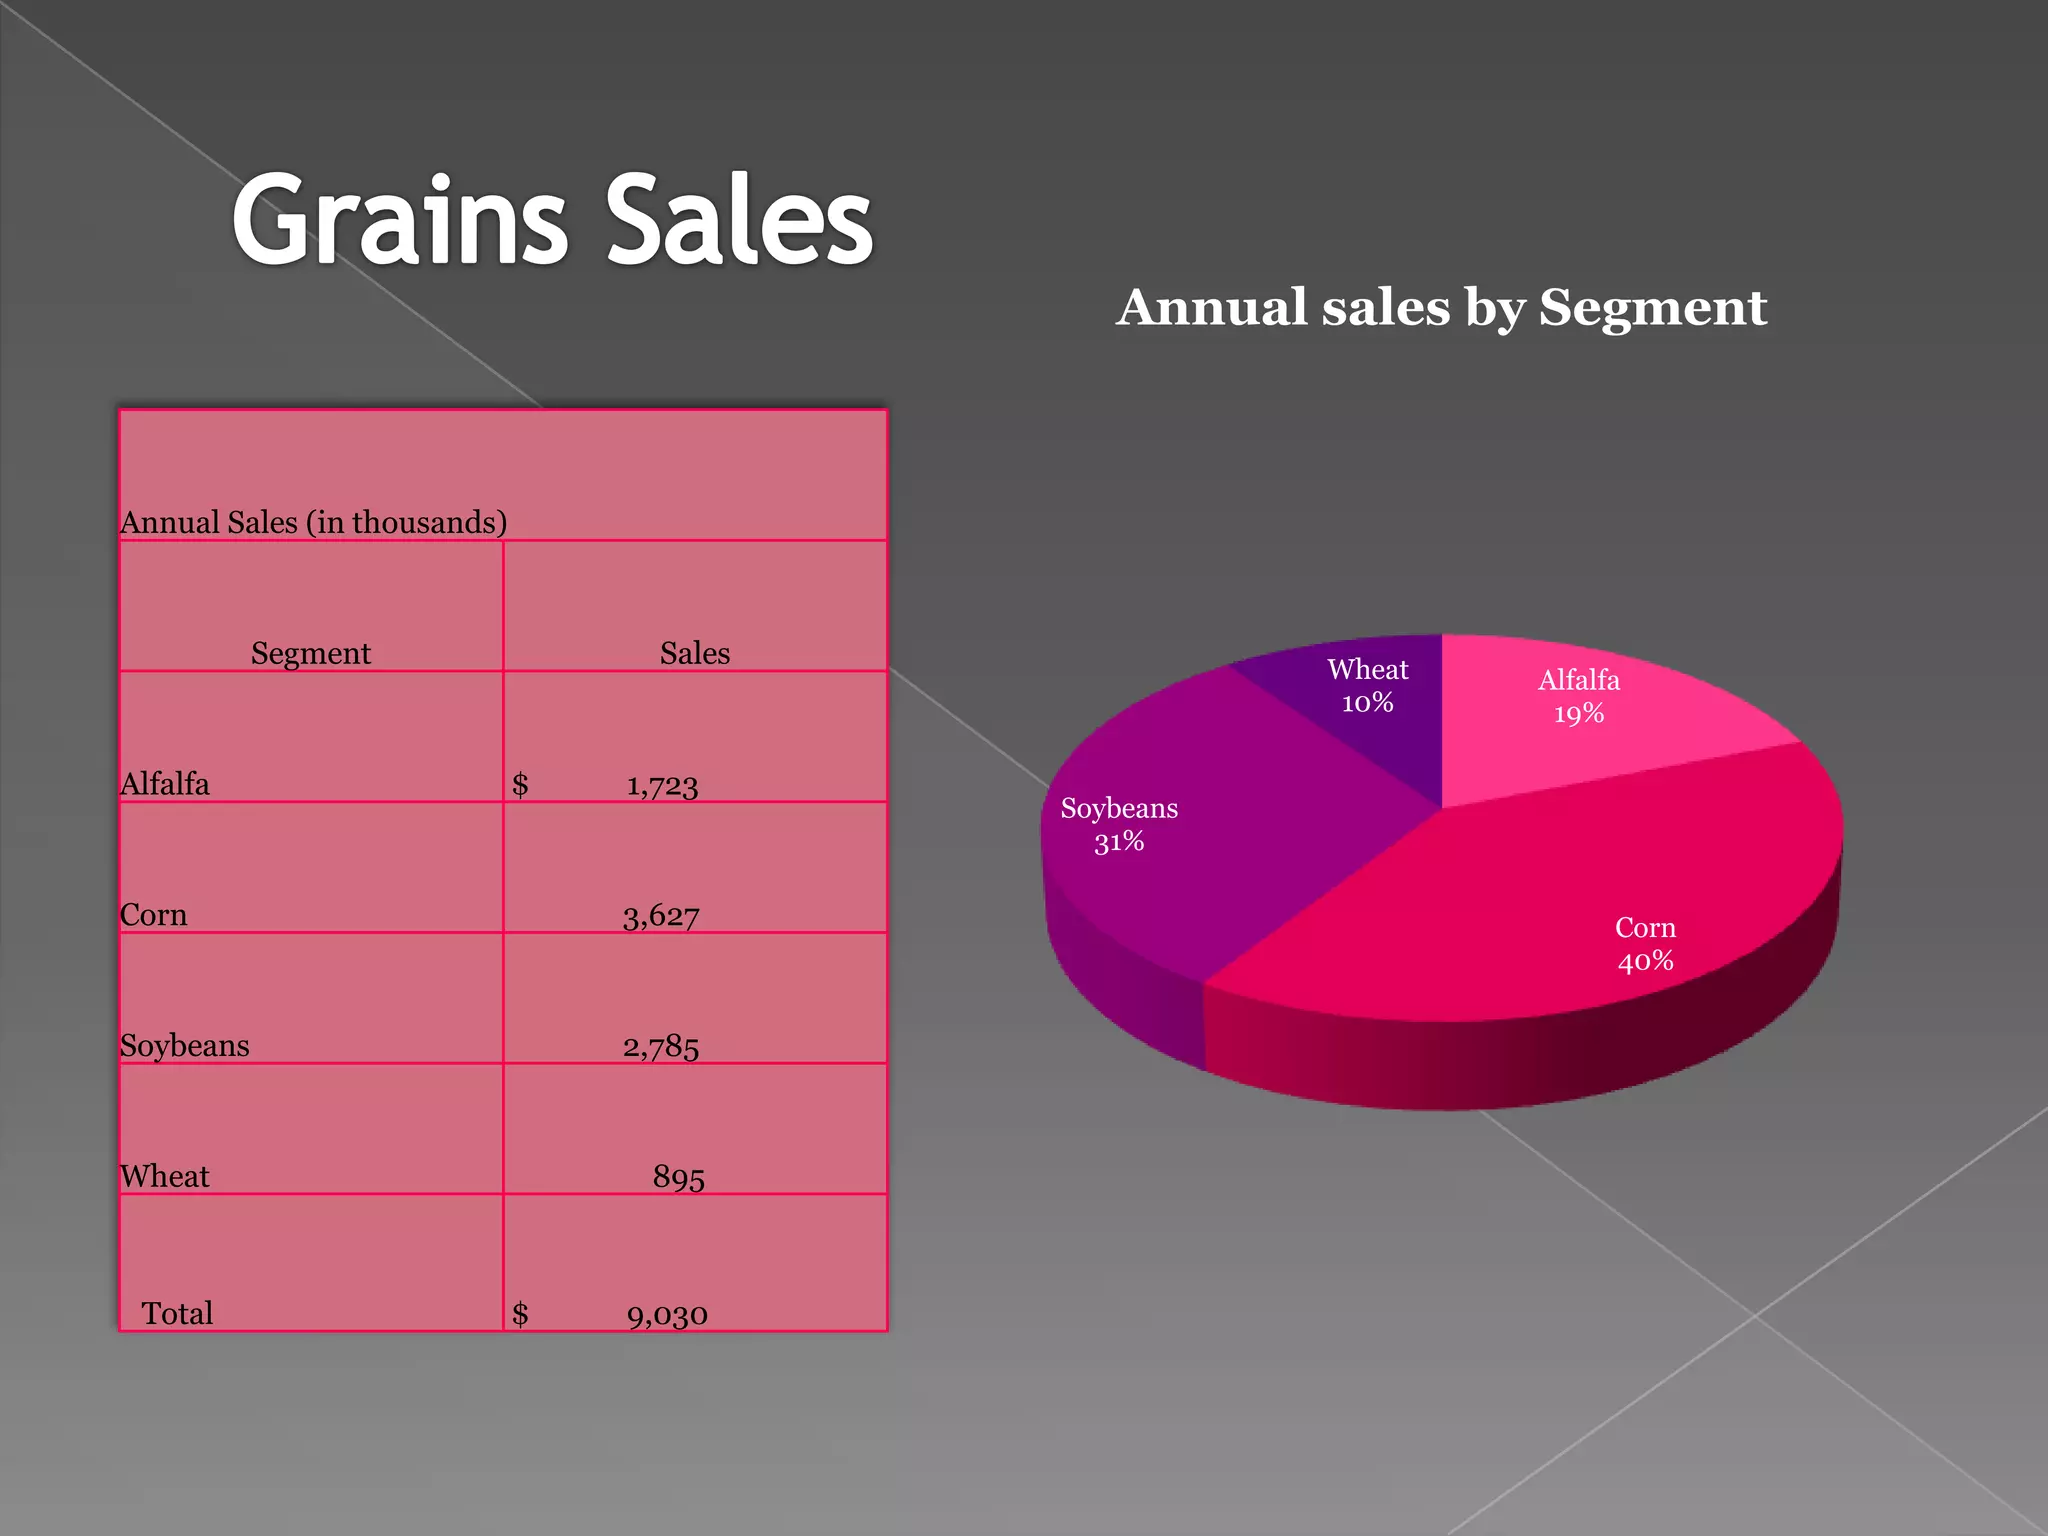
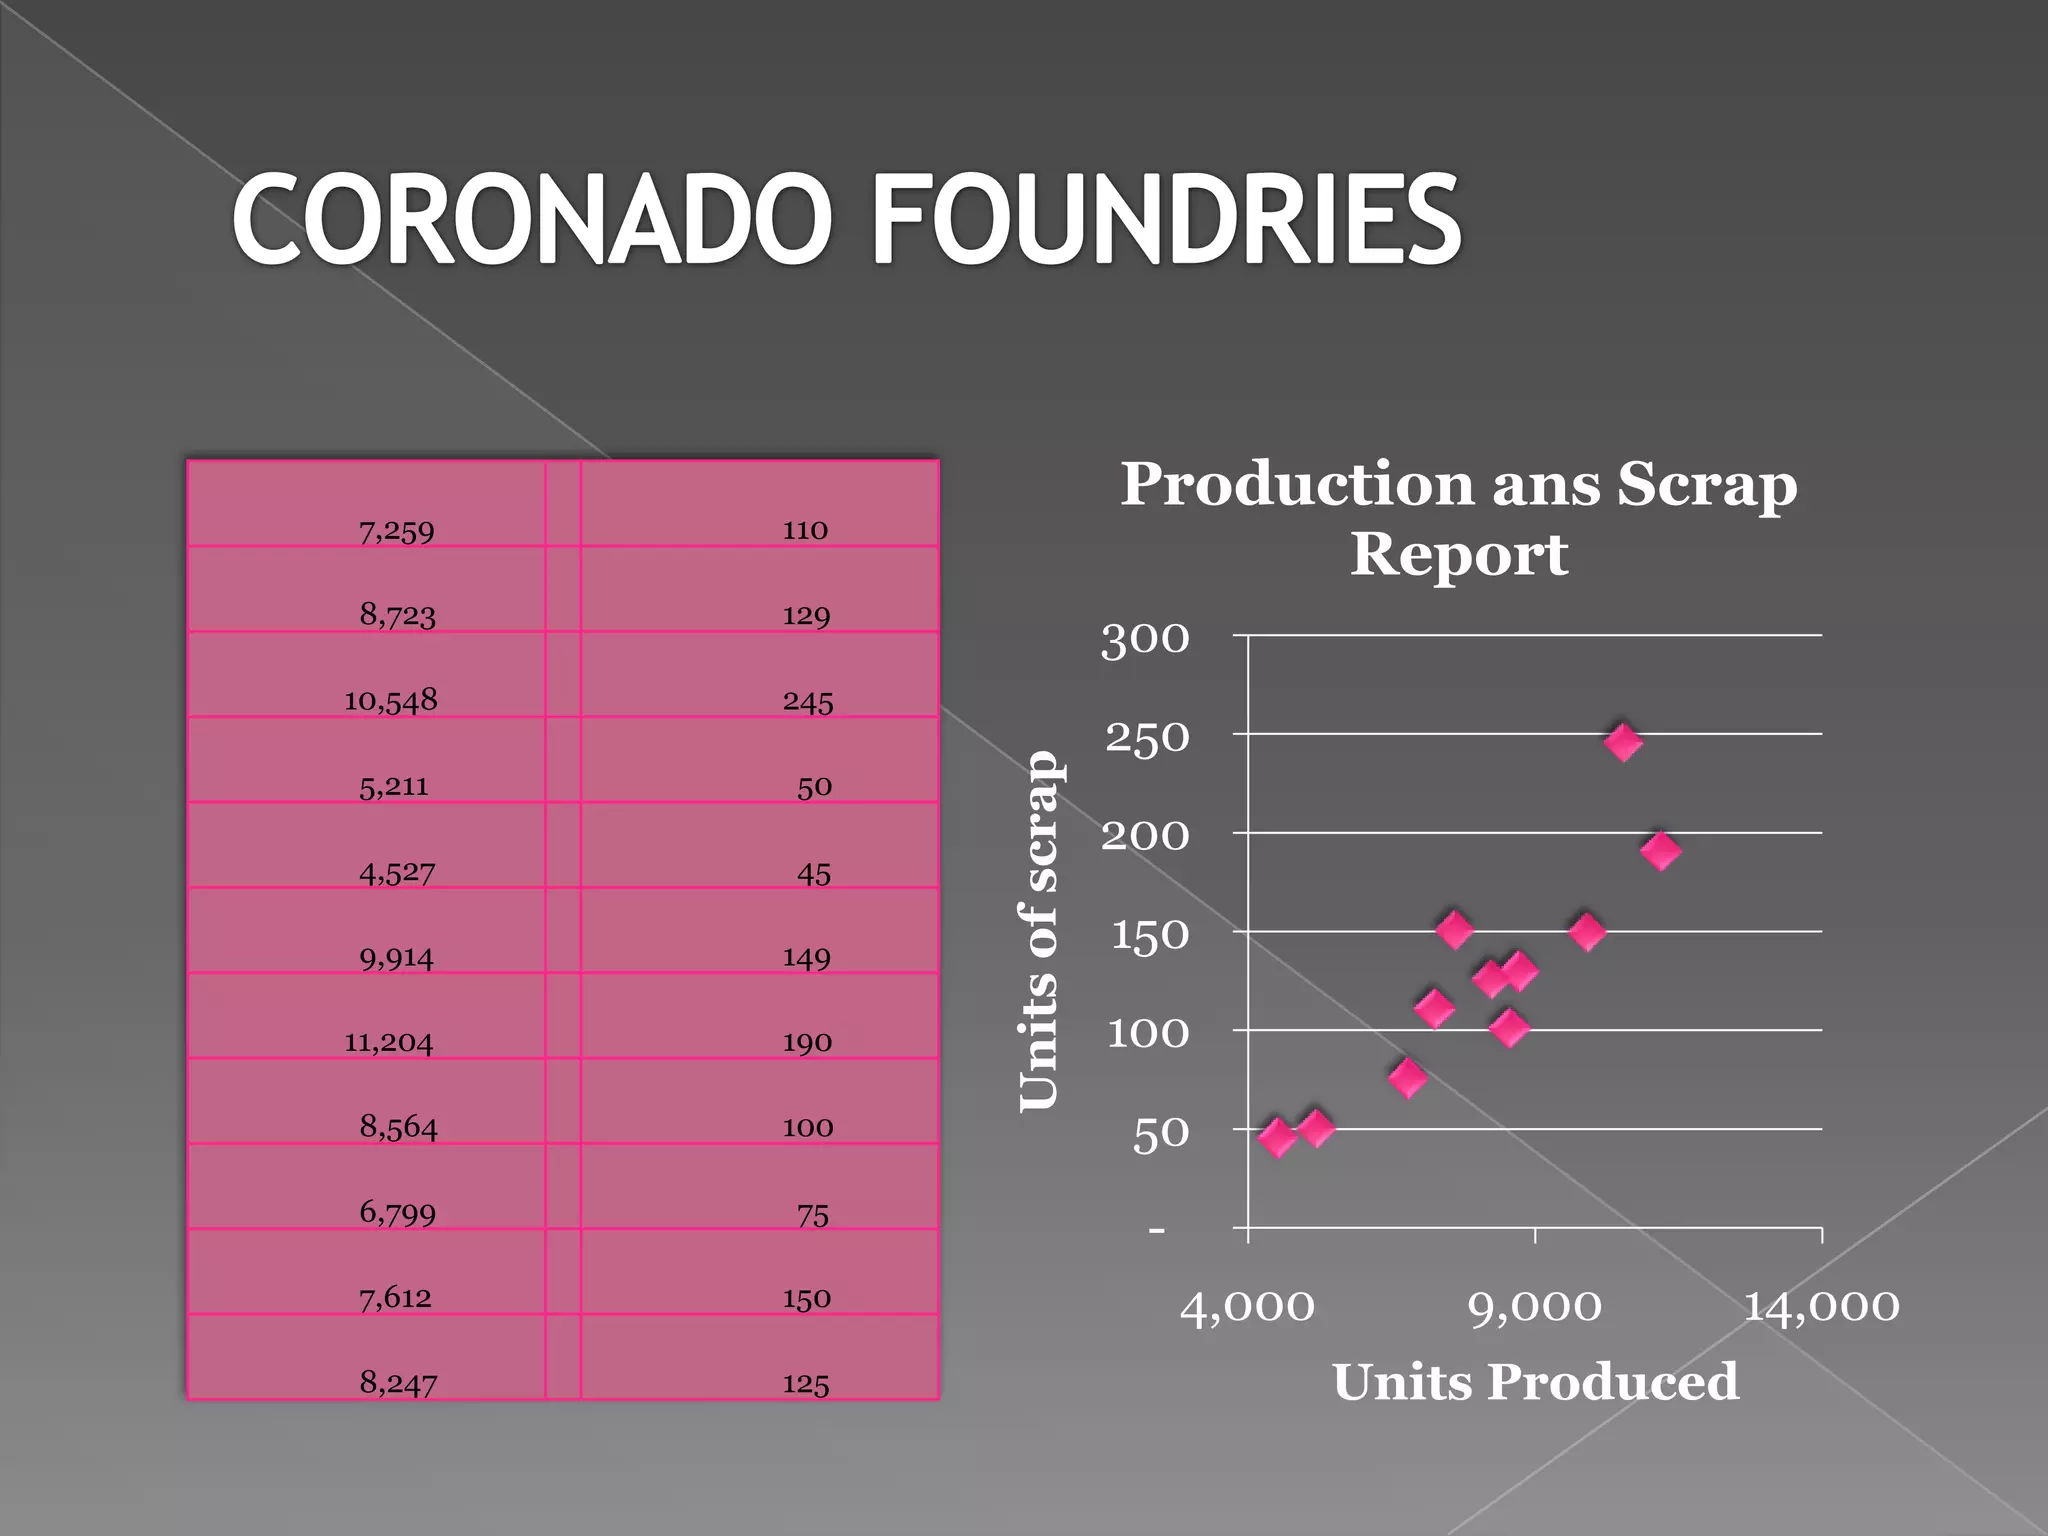
The document shows survey results for the most popular fast food restaurants, with Subway being the favorite at 13% of responses. It also includes a pie chart breaking down annual sales by product segment for a company, with corn making up 40% of sales. Finally, it displays a bar graph comparing units produced to units of scrap over a period for quality control purposes.