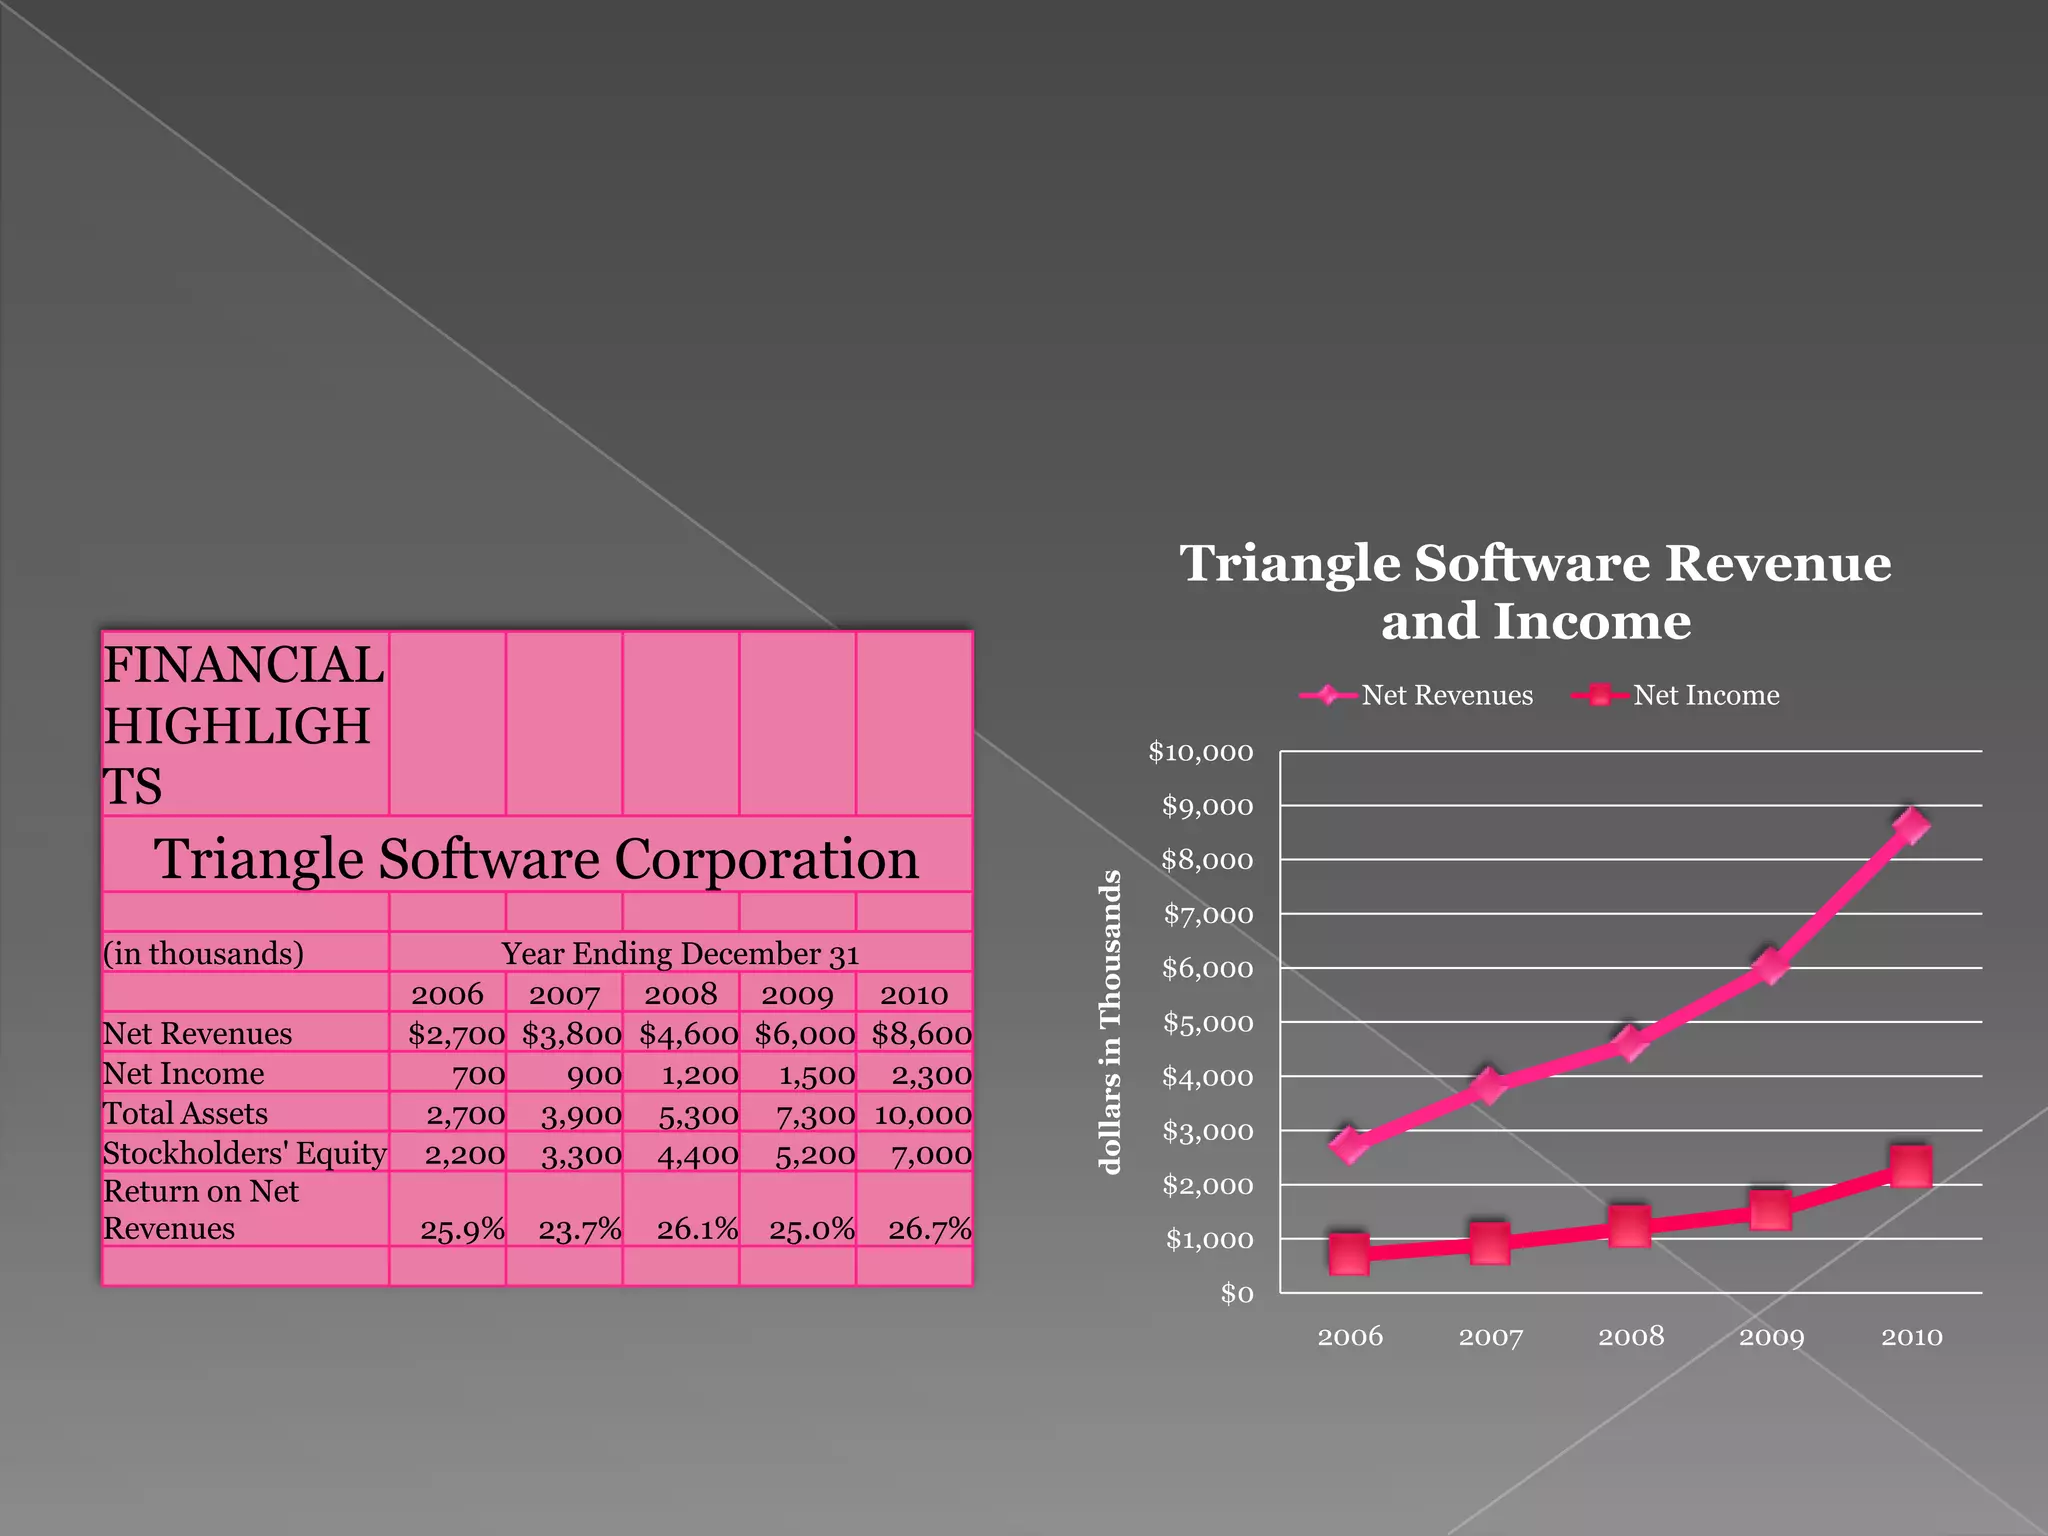
Luz Ortiz
Per.4
Who's food do you like the
                         most?
 Applebees.                                           10
 Mc Donals                                            11
 Burger King                                          8
 SubWay                                               13
 Starbucks                                            10
 IHOP                                                 10
 Your moms                                            11
 Wendys                                                7


Who's food do you like the
         most?
        Wendys          Applebees.
         9%               12%

               Your
               moms         Mc
                14%       Donals
                           14%
              IHOP
               13%
                                     Burger King
                      SubWay
                                        10%
                        16%
        Starbucks
           12%
Annual sales by Segment


Annual Sales (in thousands)


           Segment                  Sales              Wheat   Alfalfa
                                                        10%     19%

Alfalfa                       $   1,723
                                            Soybeans
                                              31%

Corn                              3,627                              Corn
                                                                     40%


Soybeans                          2,785


Wheat                              895


 Total                        $   9,030
Total Restaurants


Company operated   8,785                    Company
                              13%    28%    operated
                                            Franchises
Franchises         18,687
                            59%             Affiliated

Affiliated         4,195
1              35.5
                            2             35.25
                            3             35.25
                            4                35
                            5             35.25
                            6             34.75
                            7              34.5
                            8             34.15
                            9             34.25
                           10                34

      36
T M 35.5
i i
      35
m n
e u 34.5
                                                       Series1
  t  34
i e
n s 33.5
     33
           1   2   3   4   Week
                           5  6   7   8   9       10
Where Our Money
                                           Goes

                                              Entertain
                               Savings          ment
Expenses                            11%               8%

Housing         975         Insurance
Groceries             315      5%                                    Housing
                                                                          36%
Taxes           275
Utilities       300                       Utilities
Contributions         200                   11%            Taxes Groceries
                                                            10%     12%
Insurance             125
                            Contribut
Savings         300           ions
Entertainment         225      7%
World's 10 L
Tokyo/Yokohama       33.2                                                  argest Cities
                                                     35


                            Population in millions
New York             17.8
                                                     30
Sao Paulo            17.7                            25
                                                                                                                                                                   Series1,
                                                     20
Seoul/Incheon        17.5                                                                                                                                           14.25
                                                     15
Mexico City          17.4                            10
                                                      5
Osaka/Kobe/Kyoto   16.425
                                                      0


                                                                                                                                Osaka/Kobe/Ky…
                                                          Tokyo/Yokohama


                                                                                                                                                 Manila
                                                                                                                                                          Mumbai
                                                                                                  Seoul/Incheon


                                                                                                                                                                   Delhi
                                                                                                                                                                           Jakarta
                                                                                      Sao Paulo
                                                                           New York


                                                                                                                  Mexico City
Manila              14.75

Mumbai              14.35

Delhi                14.3

Jakarta             14.25
Production ans Scrap
 7,259   110
                                      Report
 8,723   129
                                300
10,548   245
                                250


               Units of scrap
 5,211   50
                                200
 4,527   45

 9,914   149
                                150

11,204   190                    100
 8,564   100                     50
 6,799   75
                                 -
 7,612   150                         4,000       9,000        14,000
 8,247   125                                 Units Produced
CONCESSION SALES                                Chart Title
                                                   $4,500
                 Mountain College Musk
                         Oxen                      $4,000

                                                   $3,500
                                             s
           Game Game Game Game                 D
    Food      1     2     3     4   Total
                                             a     $3,000
                                               o
           $     $     $     $      $        l
                                               l   $2,500
Hot Dogs   3,500 3,950 4,280 3,850 15,580    e                            Game 1
                                               l
                                             s     $2,000
Sandwiches 1,450 1,050 950   300     3,750     a                          Game 2
                                               r   $1,500                 Game 3
Chips      2,250 2,100 2,450 2,200 9,000
                                             i
                                               s
                                             n     $1,000                 Game 4
Popcorn    1,750 1,900 2,100 2,200 7,950
                                                    $500
Pretzels   750    775  900 525       2,950             $-
                        $            $
           $     $     10,68 $       39,23
 Total     9,700 9,775 0     9,075   0
Triangle Software Revenue
                                                                                          and Income
FINANCIAL                                                                                    Net Revenues     Net Income
HIGHLIGH                                                                         $10,000
TS                                                                               $9,000

   Triangle Software Corporation                                                 $8,000


                                                          dollars in Thousands
                                                                                  $7,000
(in thousands)             Year Ending December 31                               $6,000
                     2006 2007 2008 2009 2010
Net Revenues         $2,700 $3,800 $4,600 $6,000 $8,600                          $5,000
Net Income              700    900 1,200 1,500 2,300                             $4,000
Total Assets          2,700 3,900 5,300 7,300 10,000
                                                                                 $3,000
Stockholders' Equity 2,200 3,300 4,400 5,200 7,000
Return on Net                                                                    $2,000
Revenues              25.9% 23.7% 26.1% 25.0% 26.7%                               $1,000
                                                                                     $0
                                                                                           2006    2007     2008     2009   2010

P4 ortiz luz excel l8

  • 1.
  • 2.
    Who's food doyou like the most? Applebees. 10 Mc Donals 11 Burger King 8 SubWay 13 Starbucks 10 IHOP 10 Your moms 11 Wendys 7 Who's food do you like the most? Wendys Applebees. 9% 12% Your moms Mc 14% Donals 14% IHOP 13% Burger King SubWay 10% 16% Starbucks 12%
  • 3.
    Annual sales bySegment Annual Sales (in thousands) Segment Sales Wheat Alfalfa 10% 19% Alfalfa $ 1,723 Soybeans 31% Corn 3,627 Corn 40% Soybeans 2,785 Wheat 895 Total $ 9,030
  • 4.
    Total Restaurants Company operated 8,785 Company 13% 28% operated Franchises Franchises 18,687 59% Affiliated Affiliated 4,195
  • 5.
    1 35.5 2 35.25 3 35.25 4 35 5 35.25 6 34.75 7 34.5 8 34.15 9 34.25 10 34 36 T M 35.5 i i 35 m n e u 34.5 Series1 t 34 i e n s 33.5 33 1 2 3 4 Week 5 6 7 8 9 10
  • 6.
    Where Our Money Goes Entertain Savings ment Expenses 11% 8% Housing 975 Insurance Groceries 315 5% Housing 36% Taxes 275 Utilities 300 Utilities Contributions 200 11% Taxes Groceries 10% 12% Insurance 125 Contribut Savings 300 ions Entertainment 225 7%
  • 7.
    World's 10 L Tokyo/Yokohama 33.2 argest Cities 35 Population in millions New York 17.8 30 Sao Paulo 17.7 25 Series1, 20 Seoul/Incheon 17.5 14.25 15 Mexico City 17.4 10 5 Osaka/Kobe/Kyoto 16.425 0 Osaka/Kobe/Ky… Tokyo/Yokohama Manila Mumbai Seoul/Incheon Delhi Jakarta Sao Paulo New York Mexico City Manila 14.75 Mumbai 14.35 Delhi 14.3 Jakarta 14.25
  • 8.
    Production ans Scrap 7,259 110 Report 8,723 129 300 10,548 245 250 Units of scrap 5,211 50 200 4,527 45 9,914 149 150 11,204 190 100 8,564 100 50 6,799 75 - 7,612 150 4,000 9,000 14,000 8,247 125 Units Produced
  • 9.
    CONCESSION SALES Chart Title $4,500 Mountain College Musk Oxen $4,000 $3,500 s Game Game Game Game D Food 1 2 3 4 Total a $3,000 o $ $ $ $ $ l l $2,500 Hot Dogs 3,500 3,950 4,280 3,850 15,580 e Game 1 l s $2,000 Sandwiches 1,450 1,050 950 300 3,750 a Game 2 r $1,500 Game 3 Chips 2,250 2,100 2,450 2,200 9,000 i s n $1,000 Game 4 Popcorn 1,750 1,900 2,100 2,200 7,950 $500 Pretzels 750 775 900 525 2,950 $- $ $ $ $ 10,68 $ 39,23 Total 9,700 9,775 0 9,075 0
  • 10.
    Triangle Software Revenue and Income FINANCIAL Net Revenues Net Income HIGHLIGH $10,000 TS $9,000 Triangle Software Corporation $8,000 dollars in Thousands $7,000 (in thousands) Year Ending December 31 $6,000 2006 2007 2008 2009 2010 Net Revenues $2,700 $3,800 $4,600 $6,000 $8,600 $5,000 Net Income 700 900 1,200 1,500 2,300 $4,000 Total Assets 2,700 3,900 5,300 7,300 10,000 $3,000 Stockholders' Equity 2,200 3,300 4,400 5,200 7,000 Return on Net $2,000 Revenues 25.9% 23.7% 26.1% 25.0% 26.7% $1,000 $0 2006 2007 2008 2009 2010

Editor's Notes