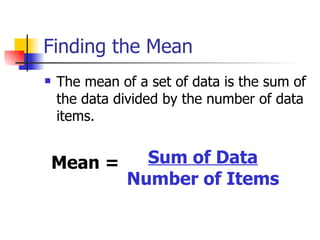
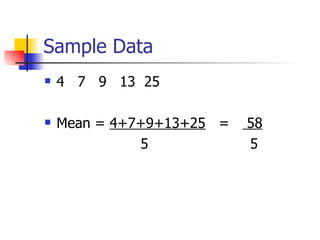
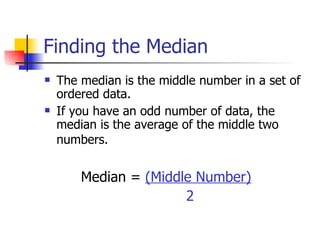
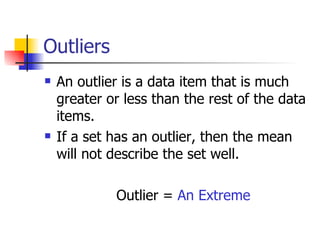
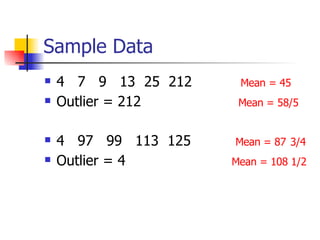
Describing Sets of Data Unit 6: Graphs and Probability
Organize Data Helps you analyze data Helps you keep track of data Easier to read the data
Lunch Favorites This list shows the favorite lunched of 15 students hamburger, pizza, taco, pizza, spaghetti, taco, spaghetti, hamburger, hamburger, pizza, taco, pizza, pizza, spaghetti, taco Hamburger, hamburger, hamburger Pizza, pizza, pizza, pizza, pizza Taco, taco, taco, taco Spaghetti, spaghetti, spaghetti
Finding the Mean The mean of a set of data is the sum of the data divided by the number of data items. Sum of Data Number of Items Mean =
Sample Data 4  7  9  13  25 Mean =  4+7+9+13+25   =  58 5  5
Finding the Median The median is the middle number in a set of ordered data. If you have an odd number of data, the median is the average of the middle two numbers.    Median =  (Middle Number) 2
Sample Data 4  7  9  13  25 Mean = 9 4  7  9  13  25  32 Mean =  (9 + 13)   =  11   2
Finding the Mode The mode is the data item that appears most often.  There can be more than one mode for a set of data. If all data appears the same amount of times, there is no mode. Mode =  Most Occurring Item
Sample Data 4  4  9  13  25 Mode = 4 4  7  7  9  13  13  25 Mode = 7, 13 4  7  9  13  25 Mode = No mode in this set
Outliers An outlier is a data item that is much greater or less than the rest of the data items.  If a set has an outlier, then the mean will not describe the set well. Outlier =  An Extreme
Sample Data 4  7  9  13  25  212  Mean = 45 Outlier = 212  Mean = 58/5   4  97  99  113  125   Mean = 87   3/4 Outlier = 4  Mean = 108 1/2
Lets Practice! HW 6-1 p. 103  # 1, 3, 5 P. 110 # 5, 7, 9, 27
Triangular and Square Numbers Math History Worksheet Why should we organize numbers?

Lesson 2

  • 1.
    Describing Sets ofData Unit 6: Graphs and Probability
  • 2.
    Organize Data Helpsyou analyze data Helps you keep track of data Easier to read the data
  • 3.
    Lunch Favorites Thislist shows the favorite lunched of 15 students hamburger, pizza, taco, pizza, spaghetti, taco, spaghetti, hamburger, hamburger, pizza, taco, pizza, pizza, spaghetti, taco Hamburger, hamburger, hamburger Pizza, pizza, pizza, pizza, pizza Taco, taco, taco, taco Spaghetti, spaghetti, spaghetti
  • 4.
    Finding the MeanThe mean of a set of data is the sum of the data divided by the number of data items. Sum of Data Number of Items Mean =
  • 5.
    Sample Data 4 7 9 13 25 Mean = 4+7+9+13+25 = 58 5 5
  • 6.
    Finding the MedianThe median is the middle number in a set of ordered data. If you have an odd number of data, the median is the average of the middle two numbers. Median = (Middle Number) 2
  • 7.
    Sample Data 4 7 9 13 25 Mean = 9 4 7 9 13 25 32 Mean = (9 + 13) = 11 2
  • 8.
    Finding the ModeThe mode is the data item that appears most often. There can be more than one mode for a set of data. If all data appears the same amount of times, there is no mode. Mode = Most Occurring Item
  • 9.
    Sample Data 4 4 9 13 25 Mode = 4 4 7 7 9 13 13 25 Mode = 7, 13 4 7 9 13 25 Mode = No mode in this set
  • 10.
    Outliers An outlieris a data item that is much greater or less than the rest of the data items. If a set has an outlier, then the mean will not describe the set well. Outlier = An Extreme
  • 11.
    Sample Data 4 7 9 13 25 212 Mean = 45 Outlier = 212 Mean = 58/5 4 97 99 113 125 Mean = 87 3/4 Outlier = 4 Mean = 108 1/2
  • 12.
    Lets Practice! HW6-1 p. 103 # 1, 3, 5 P. 110 # 5, 7, 9, 27
  • 13.
    Triangular and SquareNumbers Math History Worksheet Why should we organize numbers?