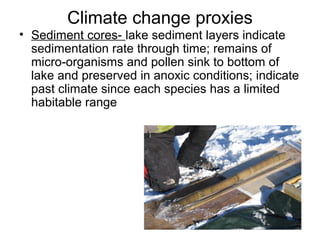
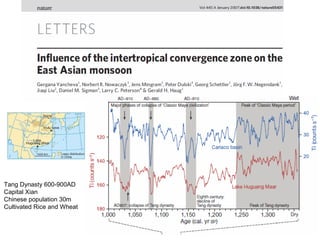
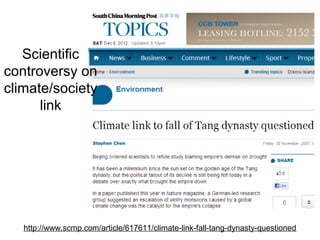
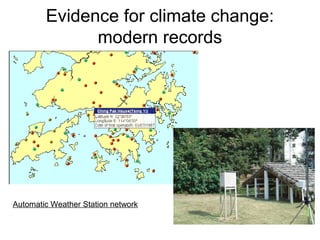
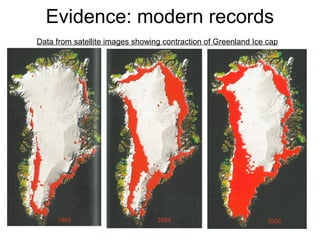
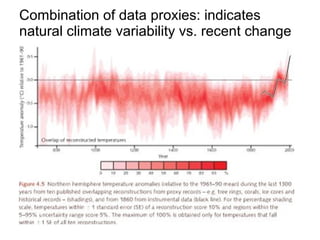
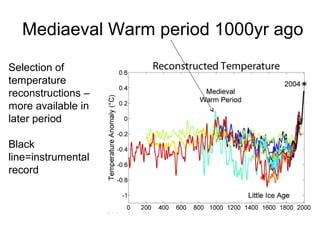
Lecture 3. Evidence for climate
change and climate variability
Maslin Chapter 3, Burroughs Chapter 8 and
http://www.theresilientearth.com/?q=content/grand-view-4-billion-years-climate-change
Lecture structure
1. Evidence for Climate Change
2. Climate Change in Earth’s History
3. Climate and Human History
Background
In Lecture 1 we examined different types
of climate variability, and we noted that
many aspects of the climate system
operate on different time scales
The problem is to disentangle natural
climate variability from warming due to
enhanced greenhouse effect
A. Evidence for climate change:
climate proxies
• Not possible to go back in time so use
evidence remaining from those times,
called ‘proxies’ to interpret palaeoclimate
Climate change proxies
• Tree rings – optimal conditions for a particular
species result in more growth therefore thicker
rings; events eg. fire, create scars
Climate change proxies
• Ice cores - eg from Lake Vostok, Antarctica or the
Greenland Ice Sheet- gases and pollen trapped
within layers infer past climate
Determining Past Climate Change using
Oxygen Isotopes
• Normal oxygen contains 8 protons, 8 neutrons
(O16)
• A small fraction (one in a thousand) of oxygen
atoms contain 8 protons, 10 neutrons (O18)
• This is an isotope of oxygen and is heavier than
O16
• O16 will evaporate more than O18 since it is
lighter
• Hence, during a warm period, the relative
amount of O18 will increase in the ocean waters
since more of the O16 is evaporating
• Hence, looking at the ratio of O16 to O18 in ice
cores the past can give clues about global
temperatures.
Climate change proxies
• Oxygen isotopes from micro-organisms found in
deep sea cores: use ratio of O16 and O18
– Foraminifera and diatoms (shelled micro-organisms with shells of
CaCO3)the O isotope ratio found in shell indicates past water temp
since shells use heavier isotopes in warmer conditions
Shelled forams
Diatoms
Climate change proxies
• Sediment cores- lake sediment layers indicate
sedimentation rate through time; remains of
micro-organisms and pollen sink to bottom of
lake and preserved in anoxic conditions; indicate
past climate since each species has a limited
habitable range
Tang Dynasty 600-900AD
Capital Xian
Chinese population 30m
Cultivated Rice and Wheat
Scientific
controversy on
climate/society
link
http://www.scmp.com/article/617611/climate-link-fall-tang-dynasty-questioned
Evidence for climate change:
modern records
Automatic Weather Station network
Modern records: good accuracy
and coverage
Variations of globally averaged surface temperature for 1850-2006 relative to 1961-90
 Increase of 0.76o
C +/-0.9o
C
 Two warmest years are 1998 and 2005
 Twelve of the 13 years 1995 to 2007 rank among the 13 warmest years on record
 Each of the 1st
8 months of 1998 was warmest of those months in whole record
Houghton p.71
Trend of annual mean temperature at Ta
Kwu Ling 1989-2009
Increase 0.07 deg/decade
Annual mean temperature at HKO
1948-2009
Increase of 0.16 deg/decade
Increase of 0.28 deg/decade
Modern satellites
• Only 30-40 years
record
Global av. sea level from tide gauge and satellite data (red) relative to 1961-90 mean
Over 20th
century sea level rose by 17+/-5cm
Rate of rise increased to 3.1cm for decade 1993-2003
- half of this due to thermal expansion of ocean, rest due to melting of glaciers
Evidence: modern records
Data from satellite images showing contraction of Greenland Ice cap
Combination of data proxies: indicates
natural climate variability vs. recent change
B. Climate in earth’s history
Life appeared on earth when climate warmed at end of
Pre-Cambrian period ca. 570Mya
Phanerozoic (age of visible life) is the present period,
Jurassic period of dynosaurs (approx. 100m ya) was a
warm period of Mesozoic, when atm. CO2
5 times higher
than today and no polar icecaps
Then, a 65m yr transition to colder conditions,
culminating in glaciation of Antarctica 35m yr ago
accompanied by falling atm CO2 levels,
Over the last 2.5Ma, (Pleistocene)ice ages have
alternated with warmer periods and >80% of time colder
than today
Phanerozoic: Period of visible life
(Burroughs Figure 8.5)
Past climate change: recent
We are at ‘0’ on lower graph-
so we are currently in an ‘Ice-
House’ world. Both poles still
glaciated- rare in history of
earth. Significant because of
potential melting. Also large
temperature gradient (+30 to
-35º) gives us a dynamic
climate system.
Life appeared Hominidsdynosaurs
Pleistocene Ice Ages
Between 2.5m and 1m years ago, ice
ages occurred every 40k yrs
Last 1 million years, ice ages every
100k yrs
Due to changes in earth’s orbit related
to sun
Last
Glacial
Maximum
20ka ago
All of Canada
Greenland
UK
Last 10k yrs (Holocene) is a warm interglacial
End of last ice age, temperatures rose by 6º in less
than 4000 yrs, sea level rose 120m, atmospheric
CO2 inc, by 1/3 and methane doubled
Asian shelf at Last Glacial
Maximum (LGM) (18,000 ya)
Artemisia grassland in semi-arid environment
Southeast
Asia during
Pleistocene
glacial
periods
The Holocene
Holocene (interglacial)- climate not constant
Ancient civilisations developed in Holocene
Climatic Optimum 3000BC
Cooling cycles have occurred, with global
mean temperatures cooling by 2ºC
Influence on civilisations eg. 2000Ya
collapse of many classical civilisations eg.
Egyptian Kingdom
Mediaeval warm period followed by “Little
Ice Age” (Mediaeval Cold Period)
Holocene temperatures (BP)
Egypt collapse (slide 34) – defeat by Rome
Summary
• Although we are at a cool period in the long-
term graph we are at a warm period of the
Pleistocene (short term – last 2m. Yrs)
• Warming of 4-7ºC since LGM ten times
slower than 20th
century warming
• For last 150 years of reliable data records,
the 12 warmest years occurred since 1996
Mediaeval Warm period 1000yr ago
Selection of
temperature
reconstructions –
more available in
later period
Black
line=instrumental
record
Little Ice age 1500-1700 AD
• Norse colonies on Greenland collapsed
• Famine, mass migrations in Europe
• Ice fairs on R. Thames
http://trickygirl.wordpress.com/2009/12/01/the-little-ice-age-and-londons-frost-fairs/
Little Ice Age: Burroughs p.285-6
• Exceptional cold of 1690s killed half
population of Finland – short summers
destroyed crops
• Scotland- oats harvest failed and death
rate 1/3 – 2/3 of population: Union of
Scotland with England 1707 inevitable
• Irish famine in 1845 population of 8 million
(1.5 million died and 1 million emigrated)
due to wet climate and summer of 1845
especially wet with high humidity – ideal
conditions for potato blight to spread
Obama’s State of the Union
address 21.01.15
• “2014 was the planet's warmest year on record. Now, one year
doesn't make a trend, but this does -- 14 of the 15 warmest years on
record have all fallen in the first 15 years of this century.
• I've heard some folks try to dodge the evidence by saying they're
not scientists; that we don't have enough information to act. Well,
I'm not a scientist, either. But you know what -- I know a lot of really
good scientists at NASA, and NOAA, and at our major universities.
The best scientists in the world are all telling us that our
activities are changing the climate, and if we do not act
forcefully, we'll continue to see rising oceans, longer, hotter
heat waves, dangerous droughts and floods, and massive
disruptions that can trigger greater migration, conflict, and
hunger around the globe. The Pentagon says that climate change
poses immediate risks to our national security. We should act like
it.”

Lecture3 evidence

  • 1.
    Lecture 3. Evidencefor climate change and climate variability Maslin Chapter 3, Burroughs Chapter 8 and http://www.theresilientearth.com/?q=content/grand-view-4-billion-years-climate-change
  • 2.
    Lecture structure 1. Evidencefor Climate Change 2. Climate Change in Earth’s History 3. Climate and Human History
  • 3.
    Background In Lecture 1we examined different types of climate variability, and we noted that many aspects of the climate system operate on different time scales The problem is to disentangle natural climate variability from warming due to enhanced greenhouse effect
  • 4.
    A. Evidence forclimate change: climate proxies • Not possible to go back in time so use evidence remaining from those times, called ‘proxies’ to interpret palaeoclimate
  • 5.
    Climate change proxies •Tree rings – optimal conditions for a particular species result in more growth therefore thicker rings; events eg. fire, create scars
  • 6.
    Climate change proxies •Ice cores - eg from Lake Vostok, Antarctica or the Greenland Ice Sheet- gases and pollen trapped within layers infer past climate
  • 7.
    Determining Past ClimateChange using Oxygen Isotopes • Normal oxygen contains 8 protons, 8 neutrons (O16) • A small fraction (one in a thousand) of oxygen atoms contain 8 protons, 10 neutrons (O18) • This is an isotope of oxygen and is heavier than O16 • O16 will evaporate more than O18 since it is lighter • Hence, during a warm period, the relative amount of O18 will increase in the ocean waters since more of the O16 is evaporating • Hence, looking at the ratio of O16 to O18 in ice cores the past can give clues about global temperatures.
  • 8.
    Climate change proxies •Oxygen isotopes from micro-organisms found in deep sea cores: use ratio of O16 and O18 – Foraminifera and diatoms (shelled micro-organisms with shells of CaCO3)the O isotope ratio found in shell indicates past water temp since shells use heavier isotopes in warmer conditions Shelled forams Diatoms
  • 9.
    Climate change proxies •Sediment cores- lake sediment layers indicate sedimentation rate through time; remains of micro-organisms and pollen sink to bottom of lake and preserved in anoxic conditions; indicate past climate since each species has a limited habitable range
  • 10.
    Tang Dynasty 600-900AD CapitalXian Chinese population 30m Cultivated Rice and Wheat
  • 11.
  • 12.
    Evidence for climatechange: modern records Automatic Weather Station network
  • 13.
    Modern records: goodaccuracy and coverage Variations of globally averaged surface temperature for 1850-2006 relative to 1961-90  Increase of 0.76o C +/-0.9o C  Two warmest years are 1998 and 2005  Twelve of the 13 years 1995 to 2007 rank among the 13 warmest years on record  Each of the 1st 8 months of 1998 was warmest of those months in whole record Houghton p.71
  • 14.
    Trend of annualmean temperature at Ta Kwu Ling 1989-2009 Increase 0.07 deg/decade
  • 15.
    Annual mean temperatureat HKO 1948-2009 Increase of 0.16 deg/decade Increase of 0.28 deg/decade
  • 16.
    Modern satellites • Only30-40 years record Global av. sea level from tide gauge and satellite data (red) relative to 1961-90 mean Over 20th century sea level rose by 17+/-5cm Rate of rise increased to 3.1cm for decade 1993-2003 - half of this due to thermal expansion of ocean, rest due to melting of glaciers
  • 17.
    Evidence: modern records Datafrom satellite images showing contraction of Greenland Ice cap
  • 18.
    Combination of dataproxies: indicates natural climate variability vs. recent change
  • 19.
    B. Climate inearth’s history Life appeared on earth when climate warmed at end of Pre-Cambrian period ca. 570Mya Phanerozoic (age of visible life) is the present period, Jurassic period of dynosaurs (approx. 100m ya) was a warm period of Mesozoic, when atm. CO2 5 times higher than today and no polar icecaps Then, a 65m yr transition to colder conditions, culminating in glaciation of Antarctica 35m yr ago accompanied by falling atm CO2 levels, Over the last 2.5Ma, (Pleistocene)ice ages have alternated with warmer periods and >80% of time colder than today
  • 20.
    Phanerozoic: Period ofvisible life (Burroughs Figure 8.5)
  • 21.
    Past climate change:recent We are at ‘0’ on lower graph- so we are currently in an ‘Ice- House’ world. Both poles still glaciated- rare in history of earth. Significant because of potential melting. Also large temperature gradient (+30 to -35º) gives us a dynamic climate system. Life appeared Hominidsdynosaurs
  • 22.
    Pleistocene Ice Ages Between2.5m and 1m years ago, ice ages occurred every 40k yrs Last 1 million years, ice ages every 100k yrs Due to changes in earth’s orbit related to sun
  • 23.
    Last Glacial Maximum 20ka ago All ofCanada Greenland UK Last 10k yrs (Holocene) is a warm interglacial End of last ice age, temperatures rose by 6º in less than 4000 yrs, sea level rose 120m, atmospheric CO2 inc, by 1/3 and methane doubled
  • 24.
    Asian shelf atLast Glacial Maximum (LGM) (18,000 ya) Artemisia grassland in semi-arid environment
  • 25.
  • 26.
    The Holocene Holocene (interglacial)-climate not constant Ancient civilisations developed in Holocene Climatic Optimum 3000BC Cooling cycles have occurred, with global mean temperatures cooling by 2ºC Influence on civilisations eg. 2000Ya collapse of many classical civilisations eg. Egyptian Kingdom Mediaeval warm period followed by “Little Ice Age” (Mediaeval Cold Period)
  • 27.
    Holocene temperatures (BP) Egyptcollapse (slide 34) – defeat by Rome
  • 28.
    Summary • Although weare at a cool period in the long- term graph we are at a warm period of the Pleistocene (short term – last 2m. Yrs) • Warming of 4-7ºC since LGM ten times slower than 20th century warming • For last 150 years of reliable data records, the 12 warmest years occurred since 1996
  • 29.
    Mediaeval Warm period1000yr ago Selection of temperature reconstructions – more available in later period Black line=instrumental record
  • 30.
    Little Ice age1500-1700 AD • Norse colonies on Greenland collapsed • Famine, mass migrations in Europe • Ice fairs on R. Thames http://trickygirl.wordpress.com/2009/12/01/the-little-ice-age-and-londons-frost-fairs/
  • 31.
    Little Ice Age:Burroughs p.285-6 • Exceptional cold of 1690s killed half population of Finland – short summers destroyed crops • Scotland- oats harvest failed and death rate 1/3 – 2/3 of population: Union of Scotland with England 1707 inevitable • Irish famine in 1845 population of 8 million (1.5 million died and 1 million emigrated) due to wet climate and summer of 1845 especially wet with high humidity – ideal conditions for potato blight to spread
  • 32.
    Obama’s State ofthe Union address 21.01.15 • “2014 was the planet's warmest year on record. Now, one year doesn't make a trend, but this does -- 14 of the 15 warmest years on record have all fallen in the first 15 years of this century. • I've heard some folks try to dodge the evidence by saying they're not scientists; that we don't have enough information to act. Well, I'm not a scientist, either. But you know what -- I know a lot of really good scientists at NASA, and NOAA, and at our major universities. The best scientists in the world are all telling us that our activities are changing the climate, and if we do not act forcefully, we'll continue to see rising oceans, longer, hotter heat waves, dangerous droughts and floods, and massive disruptions that can trigger greater migration, conflict, and hunger around the globe. The Pentagon says that climate change poses immediate risks to our national security. We should act like it.”