Download to read offline

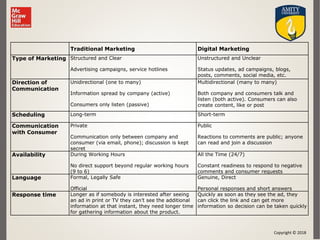
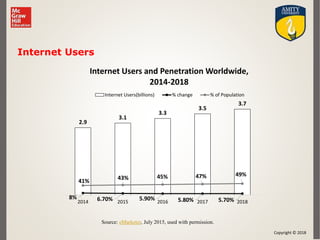
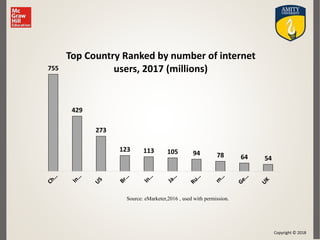
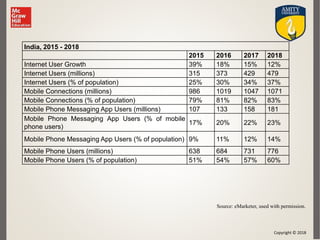
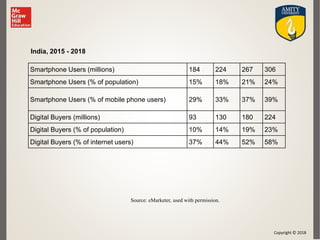
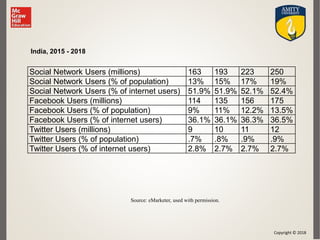
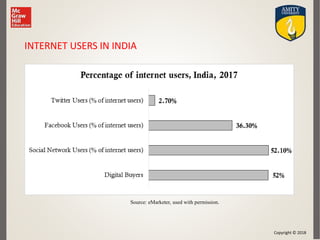
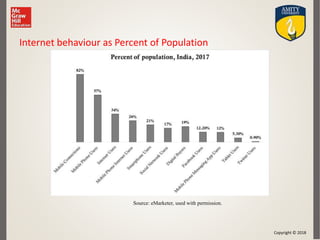
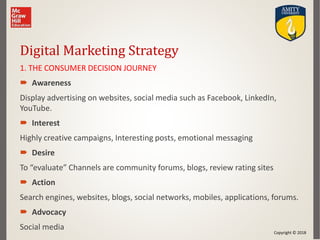
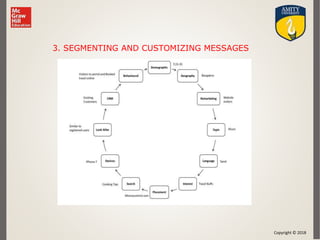
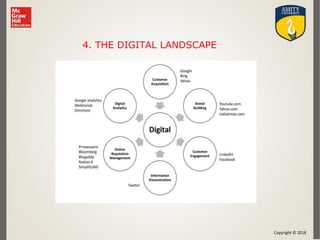
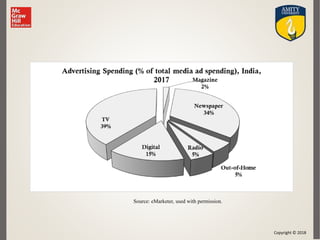
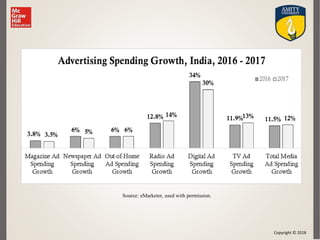
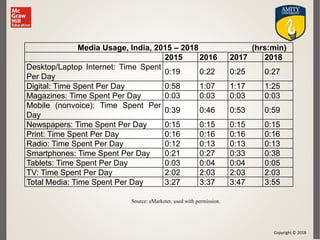
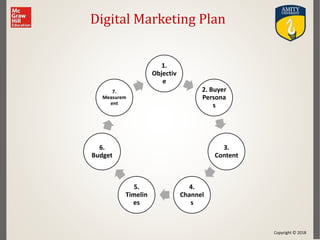

This document provides an introduction to digital marketing, including definitions and key concepts. It discusses the differences between traditional and digital marketing, such as direction of communication, scheduling, availability, and language. Statistics on internet and social media usage in India from 2015-2018 are presented. The document also outlines a digital marketing strategy framework, including targeting consumers at different stages of the purchase funnel. It concludes with an overview of necessary digital marketing skills.