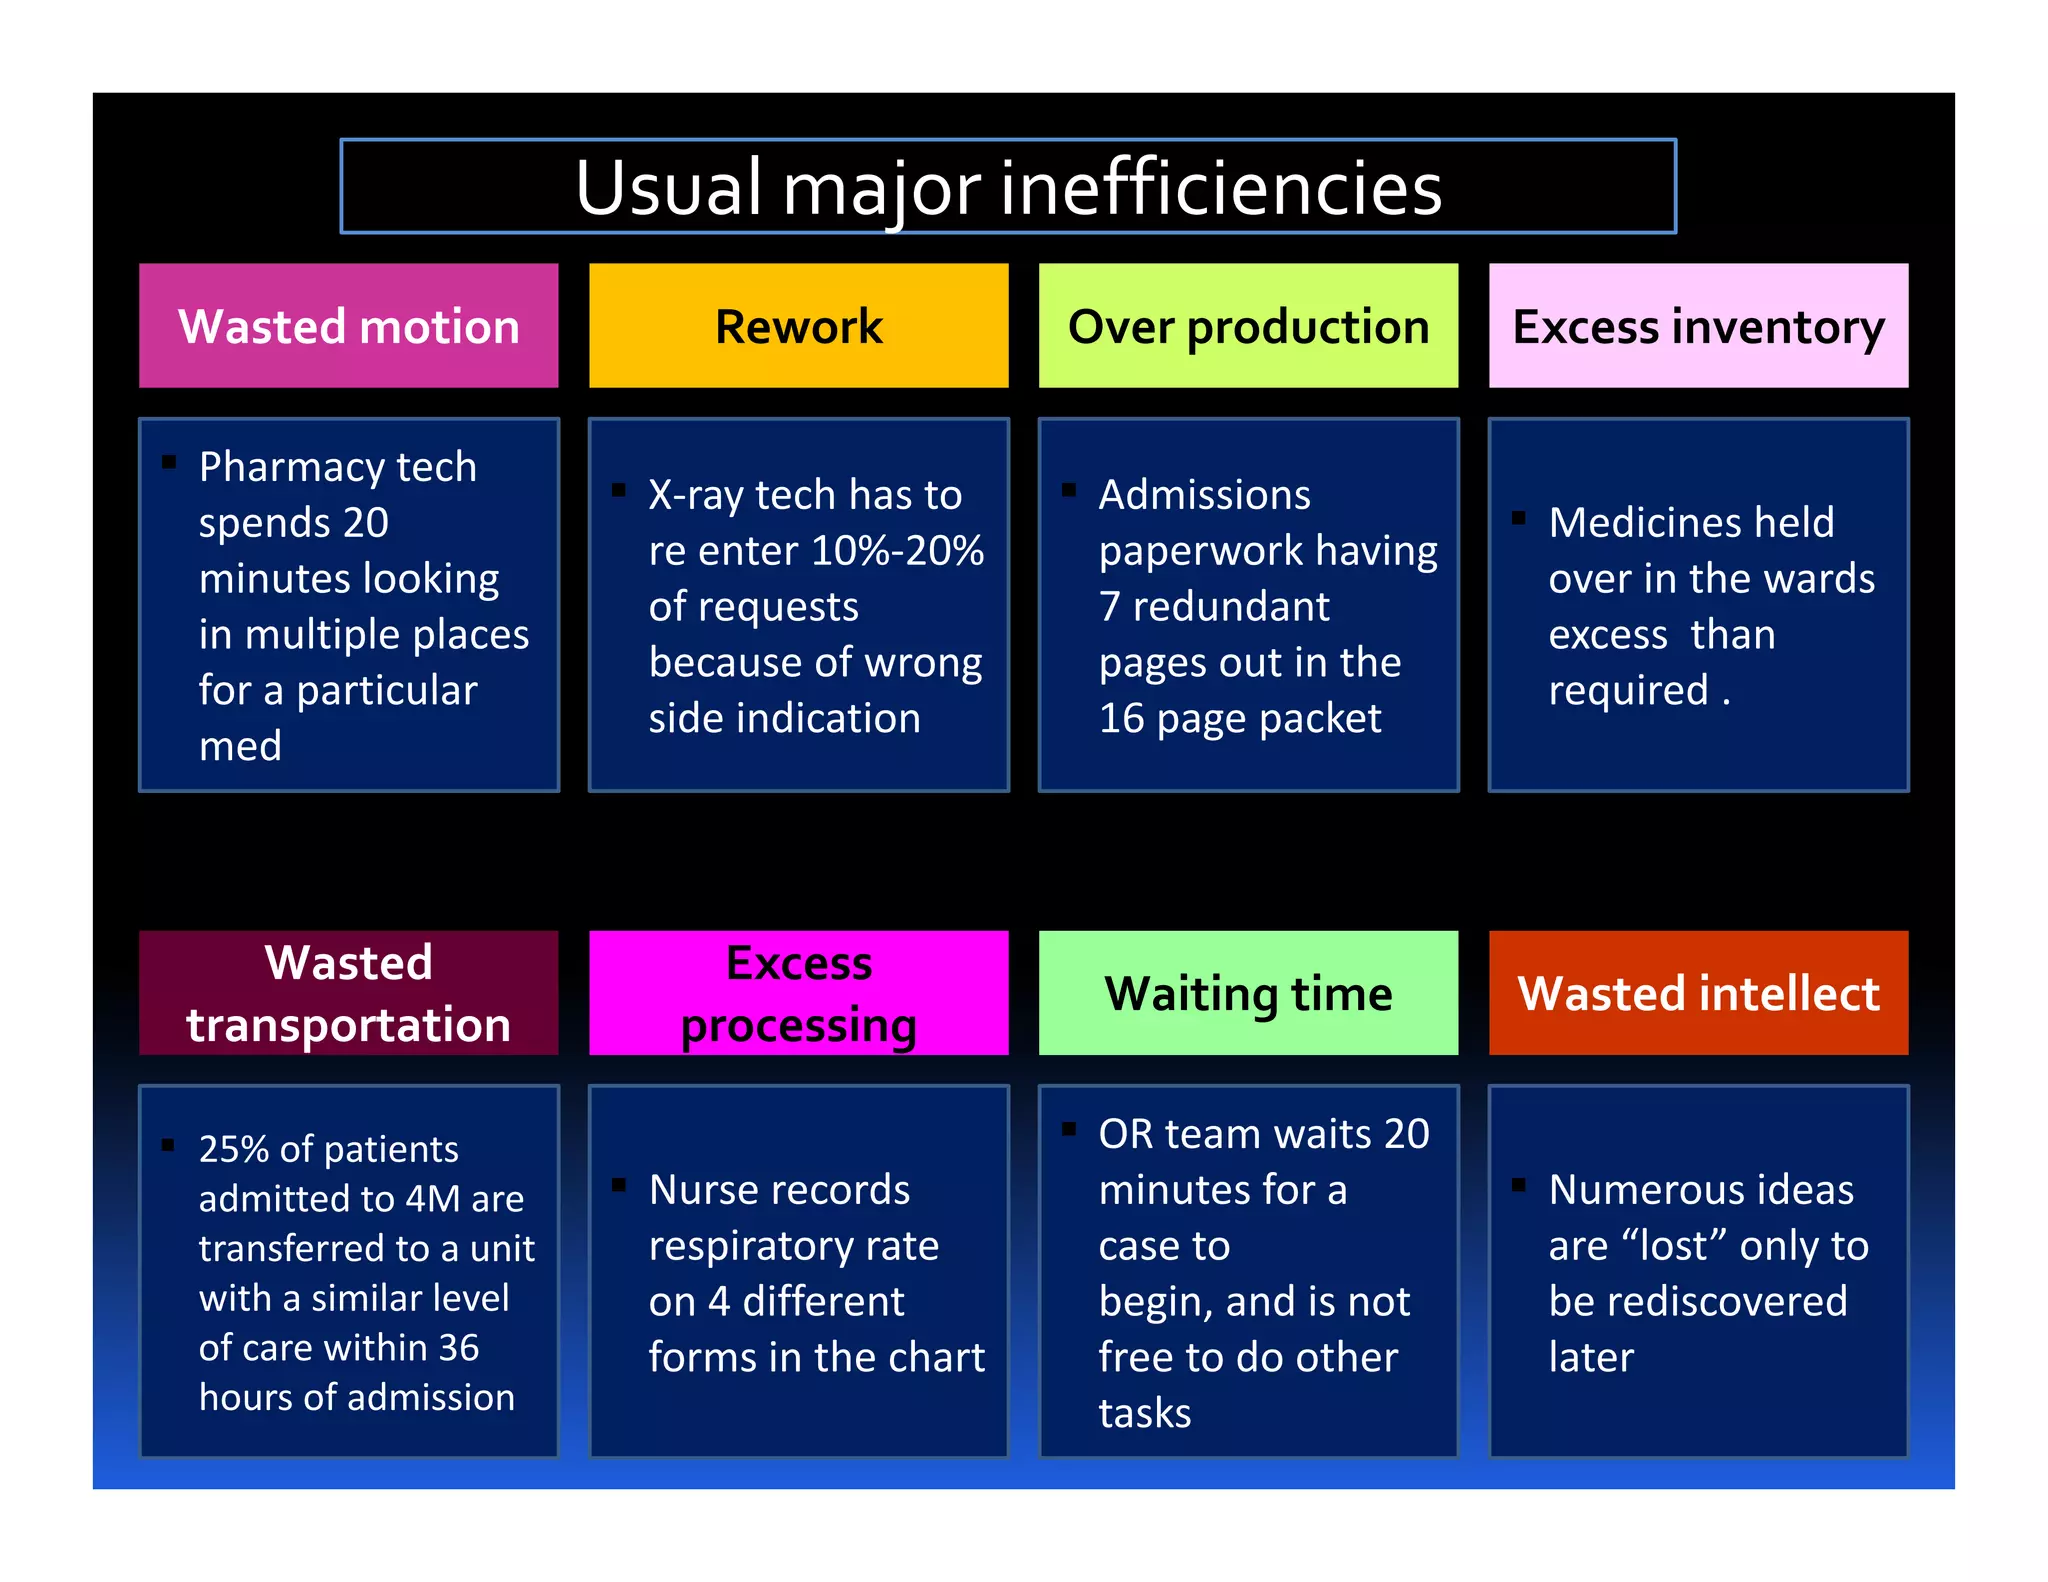
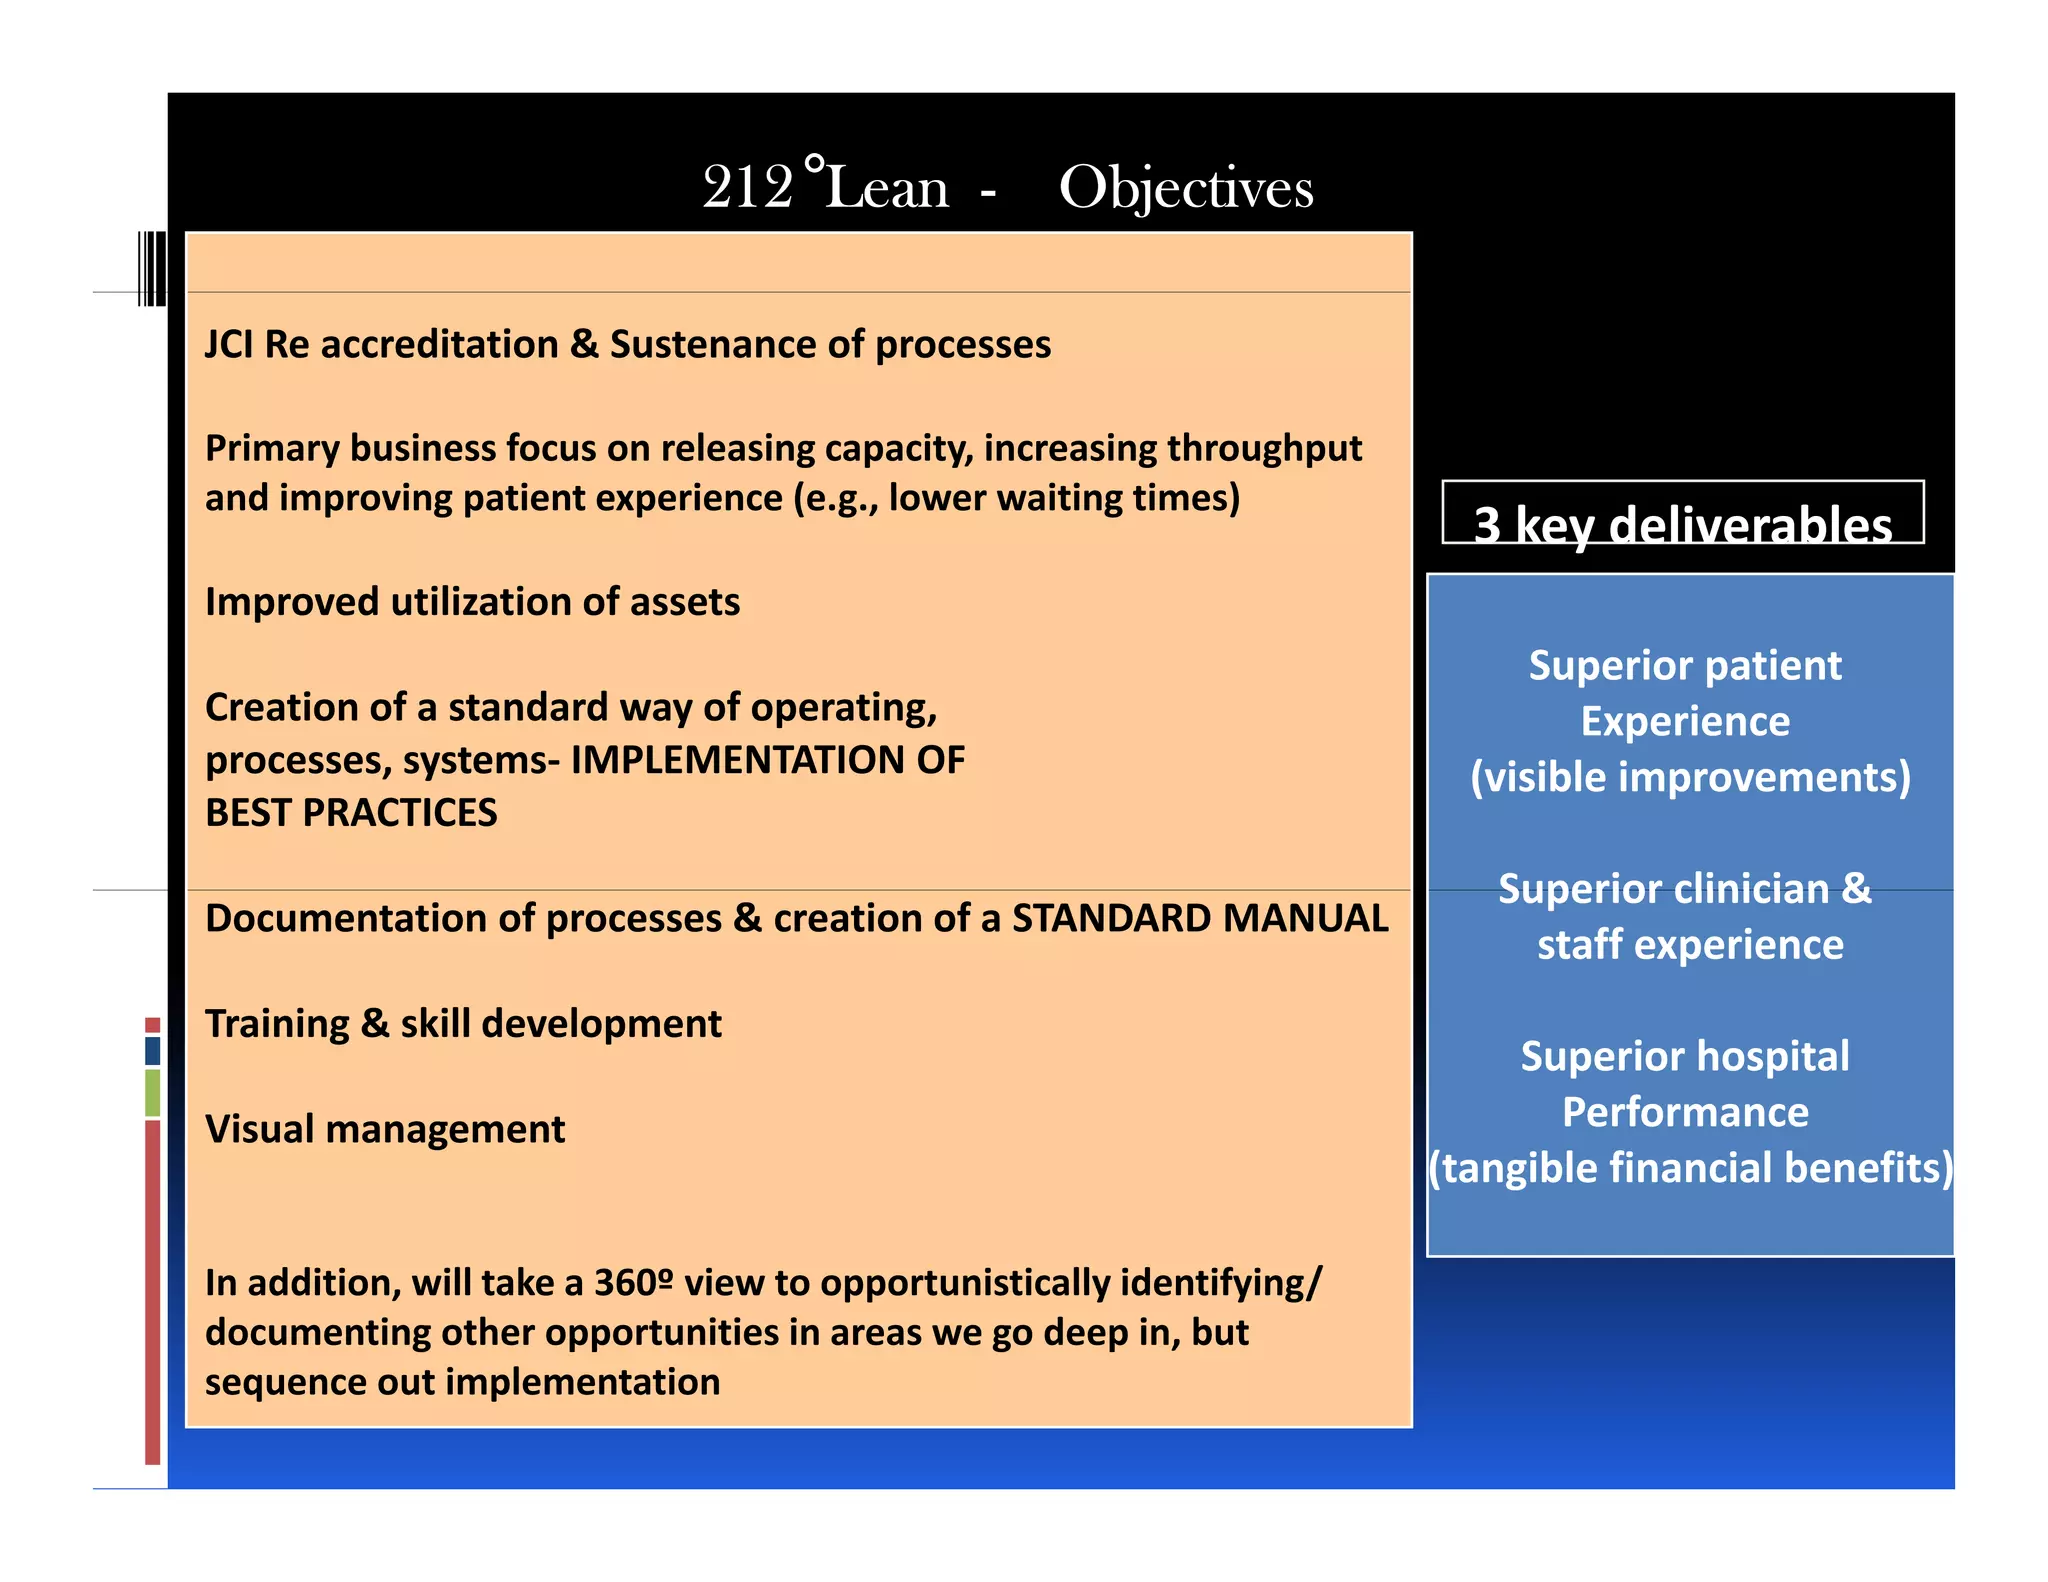
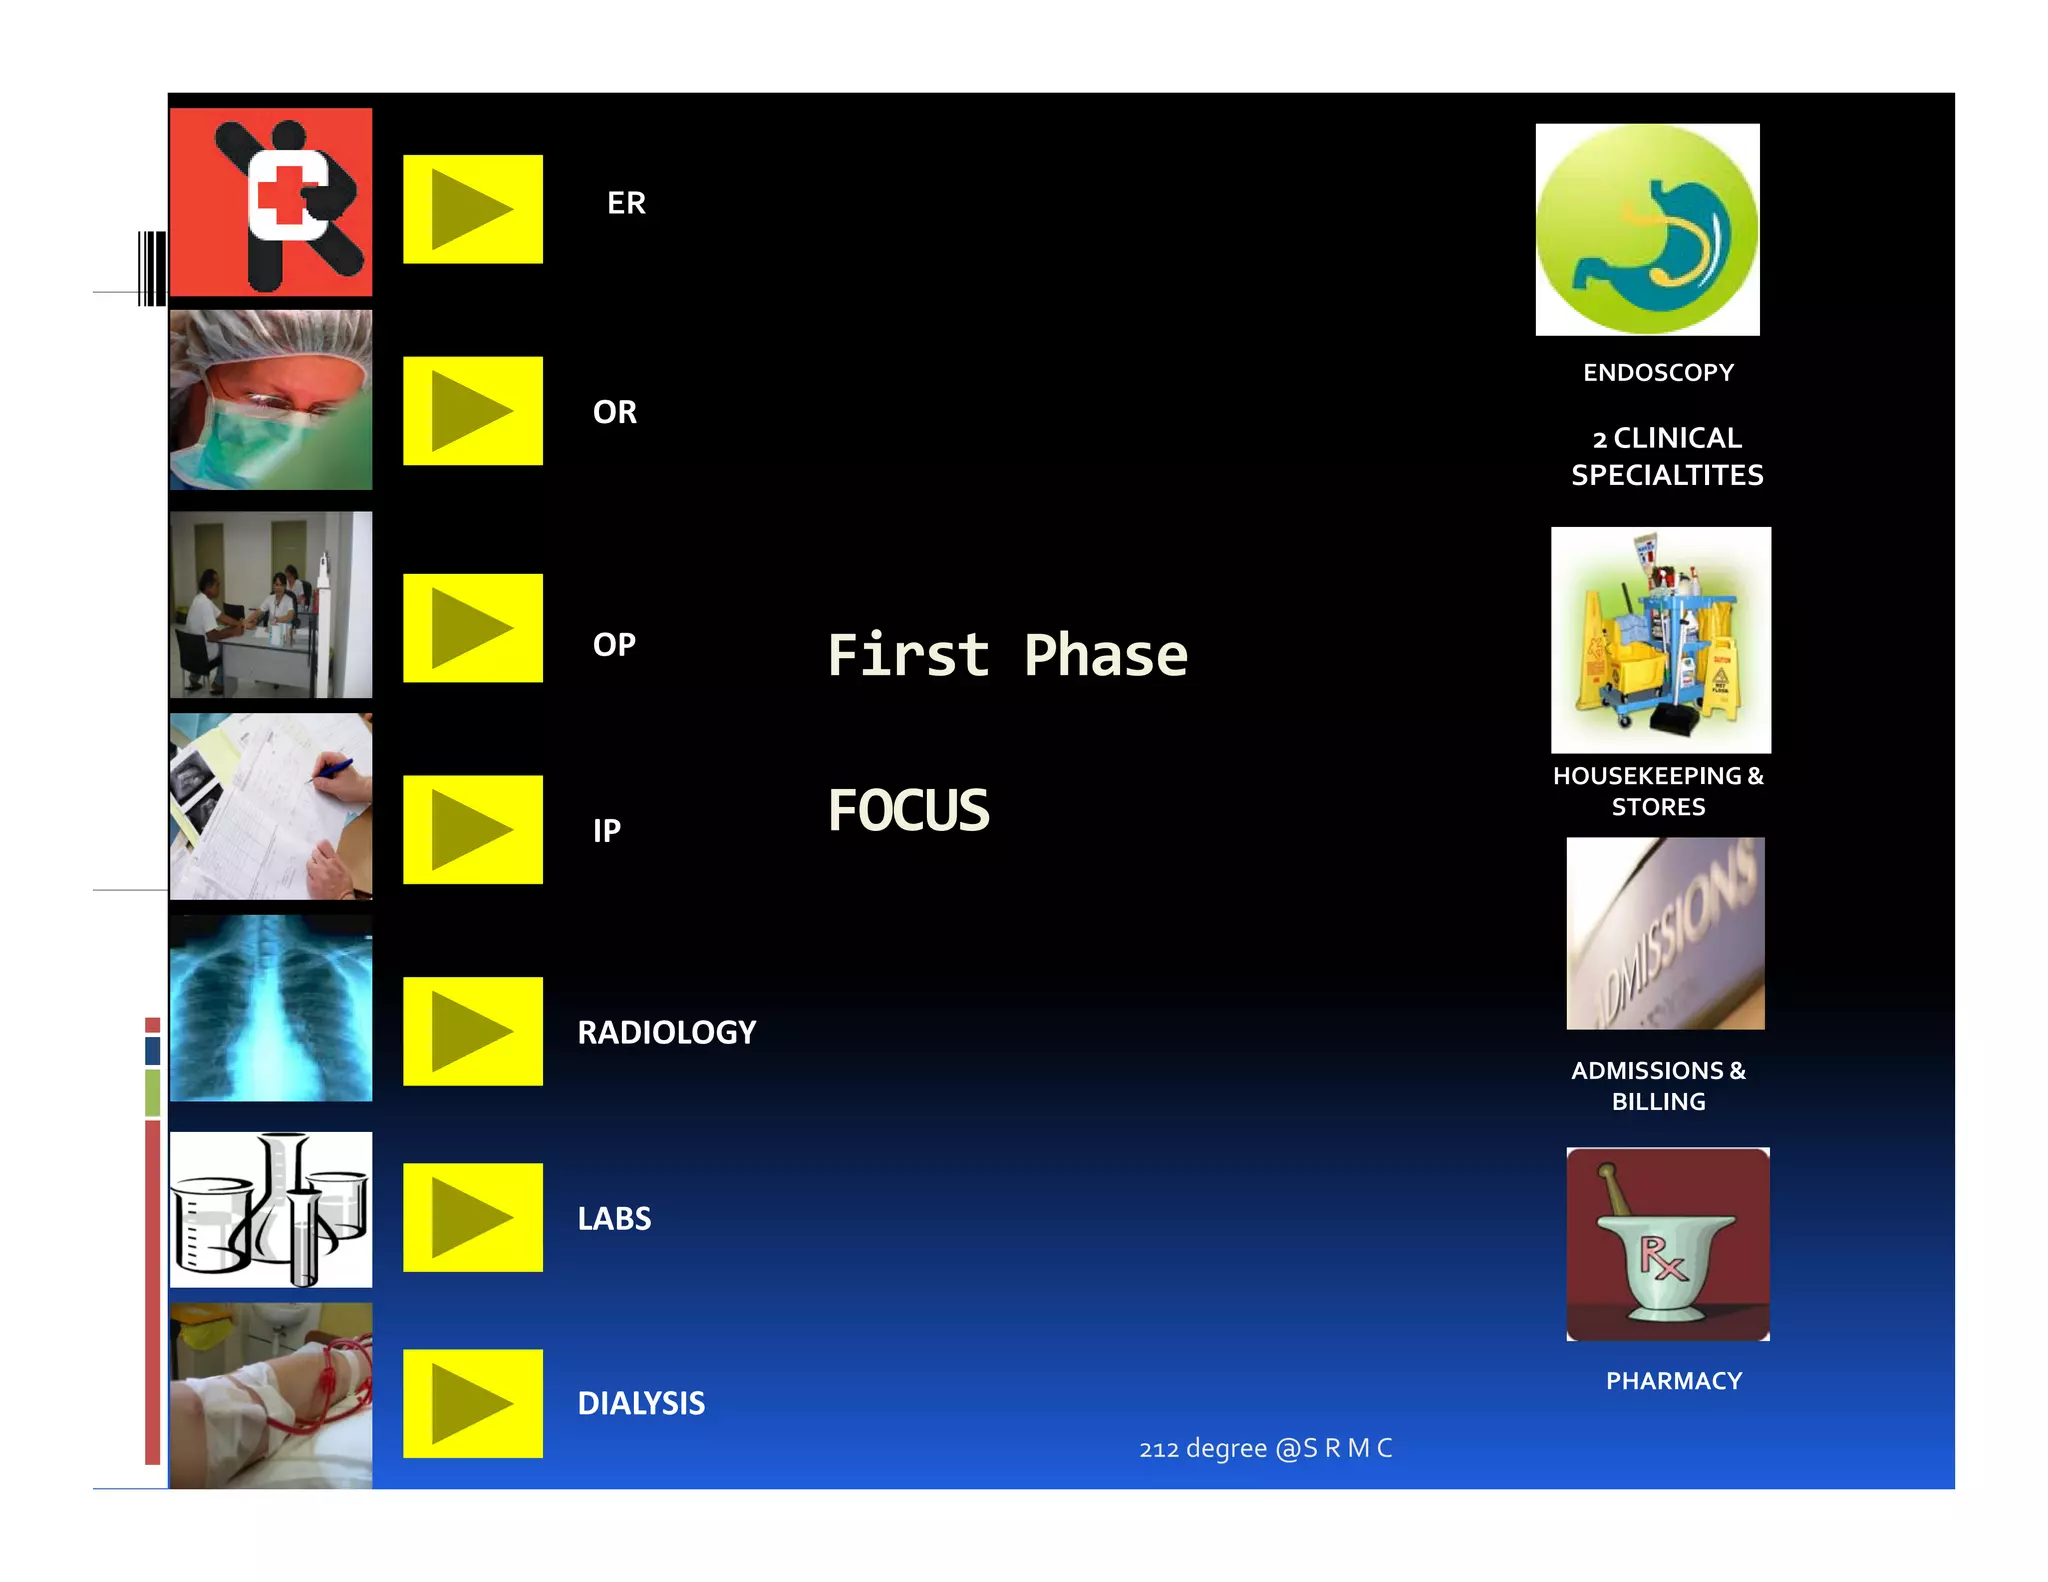
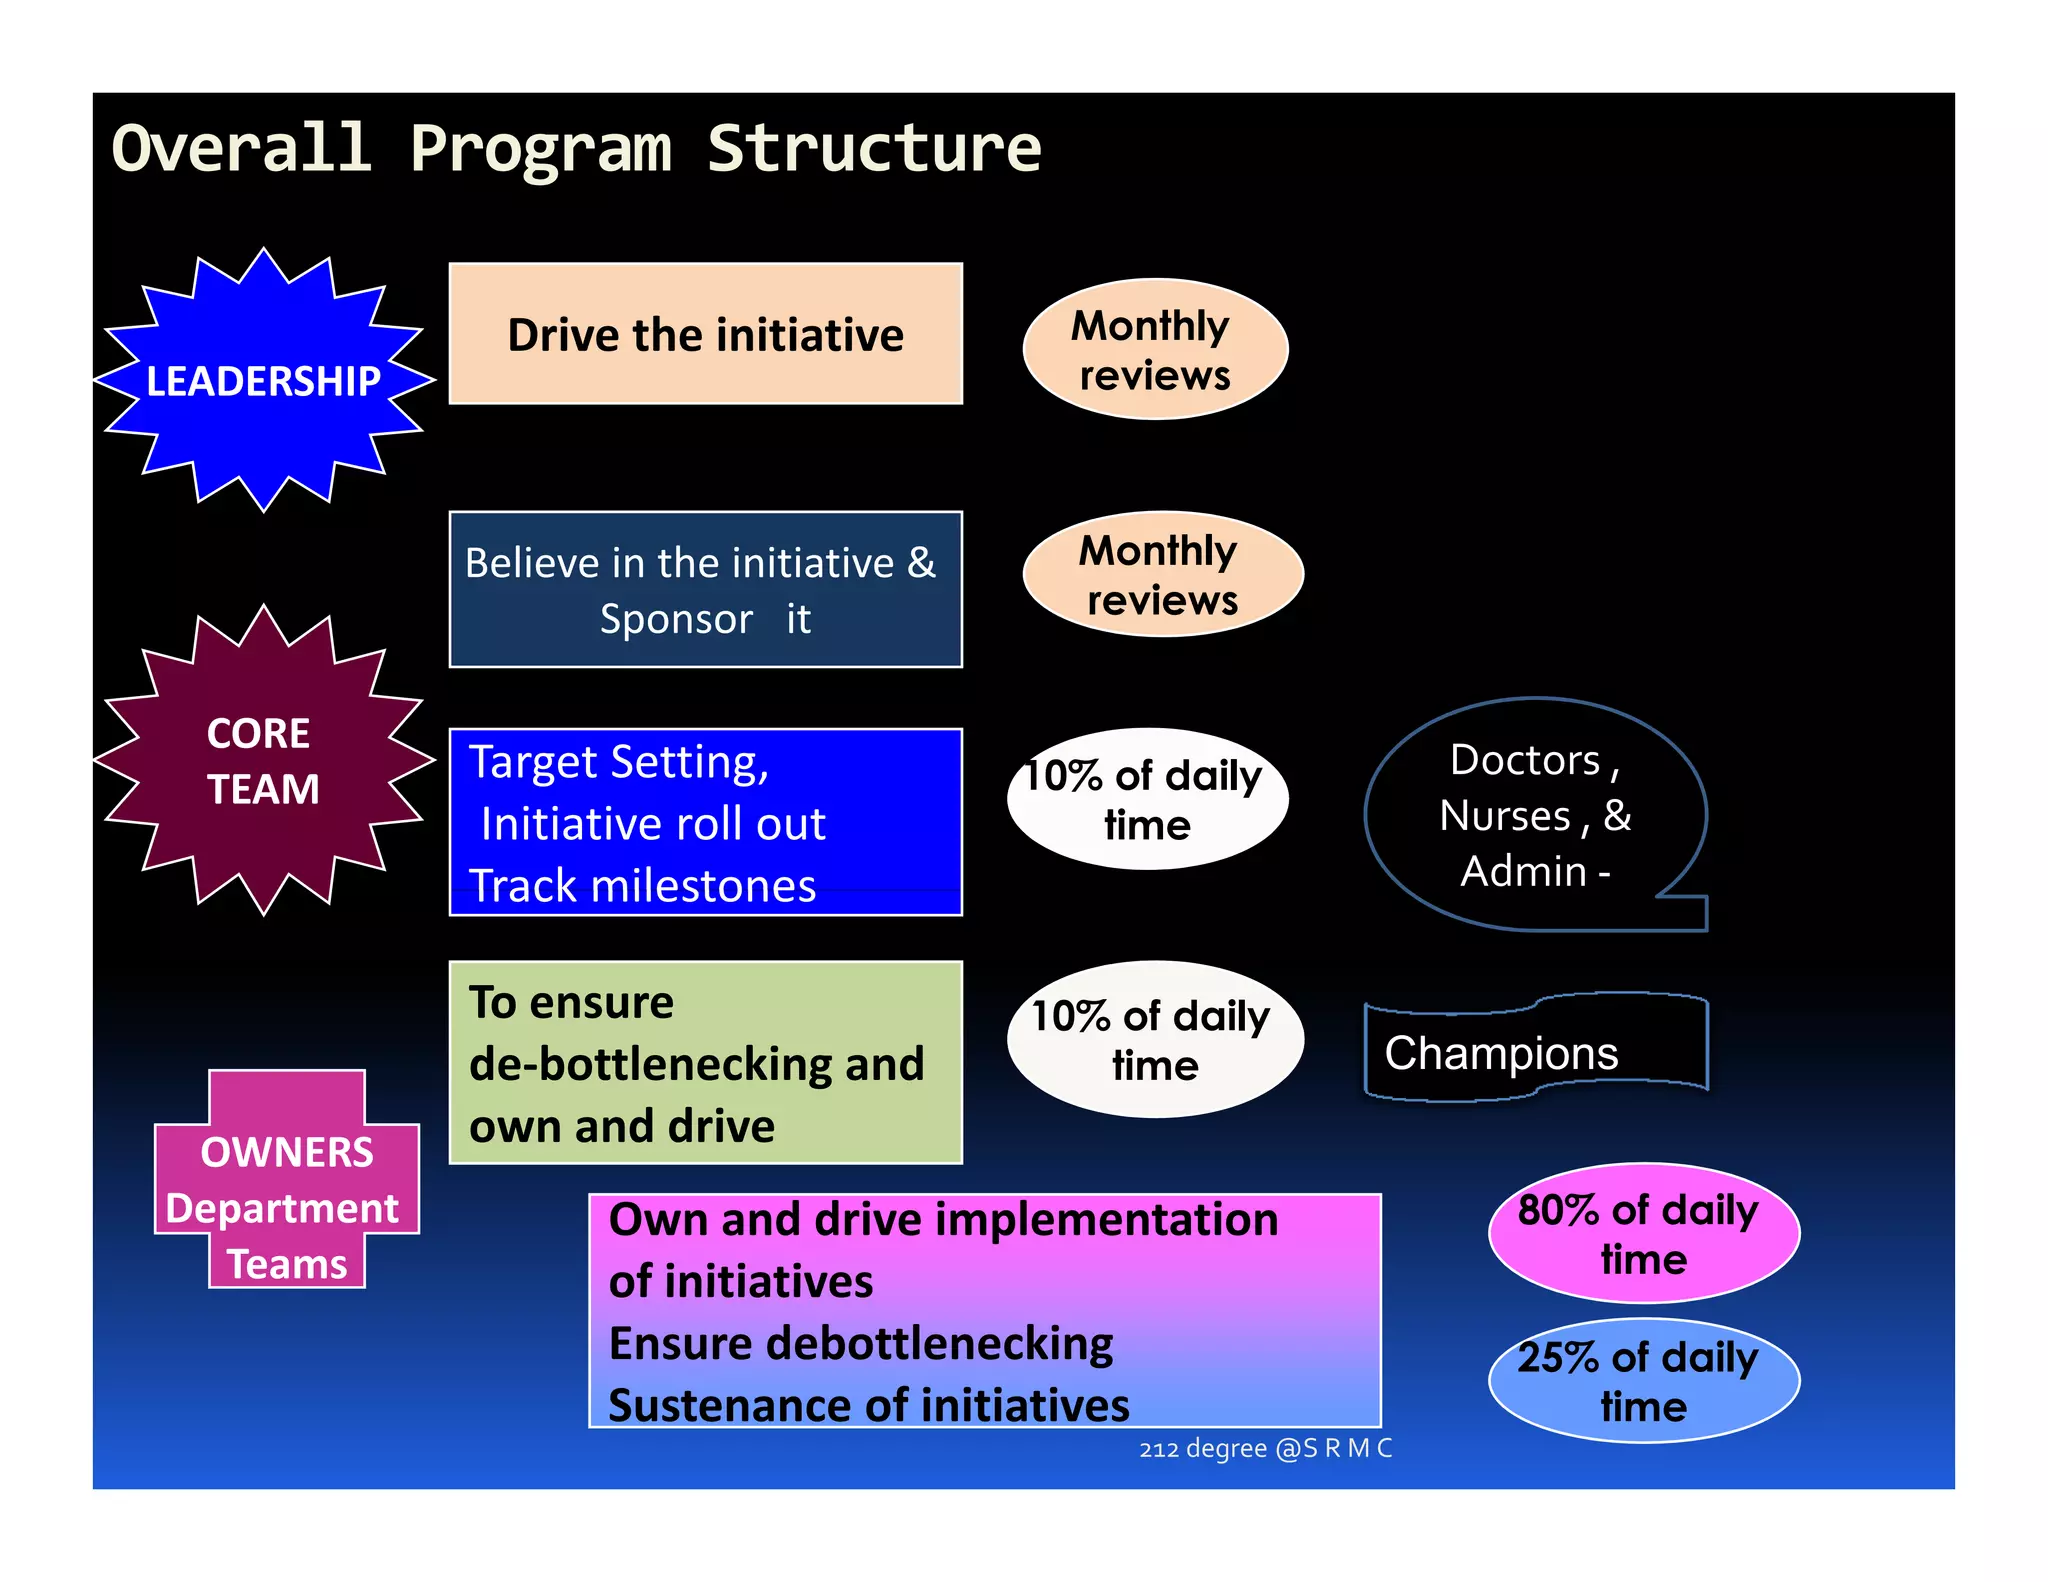
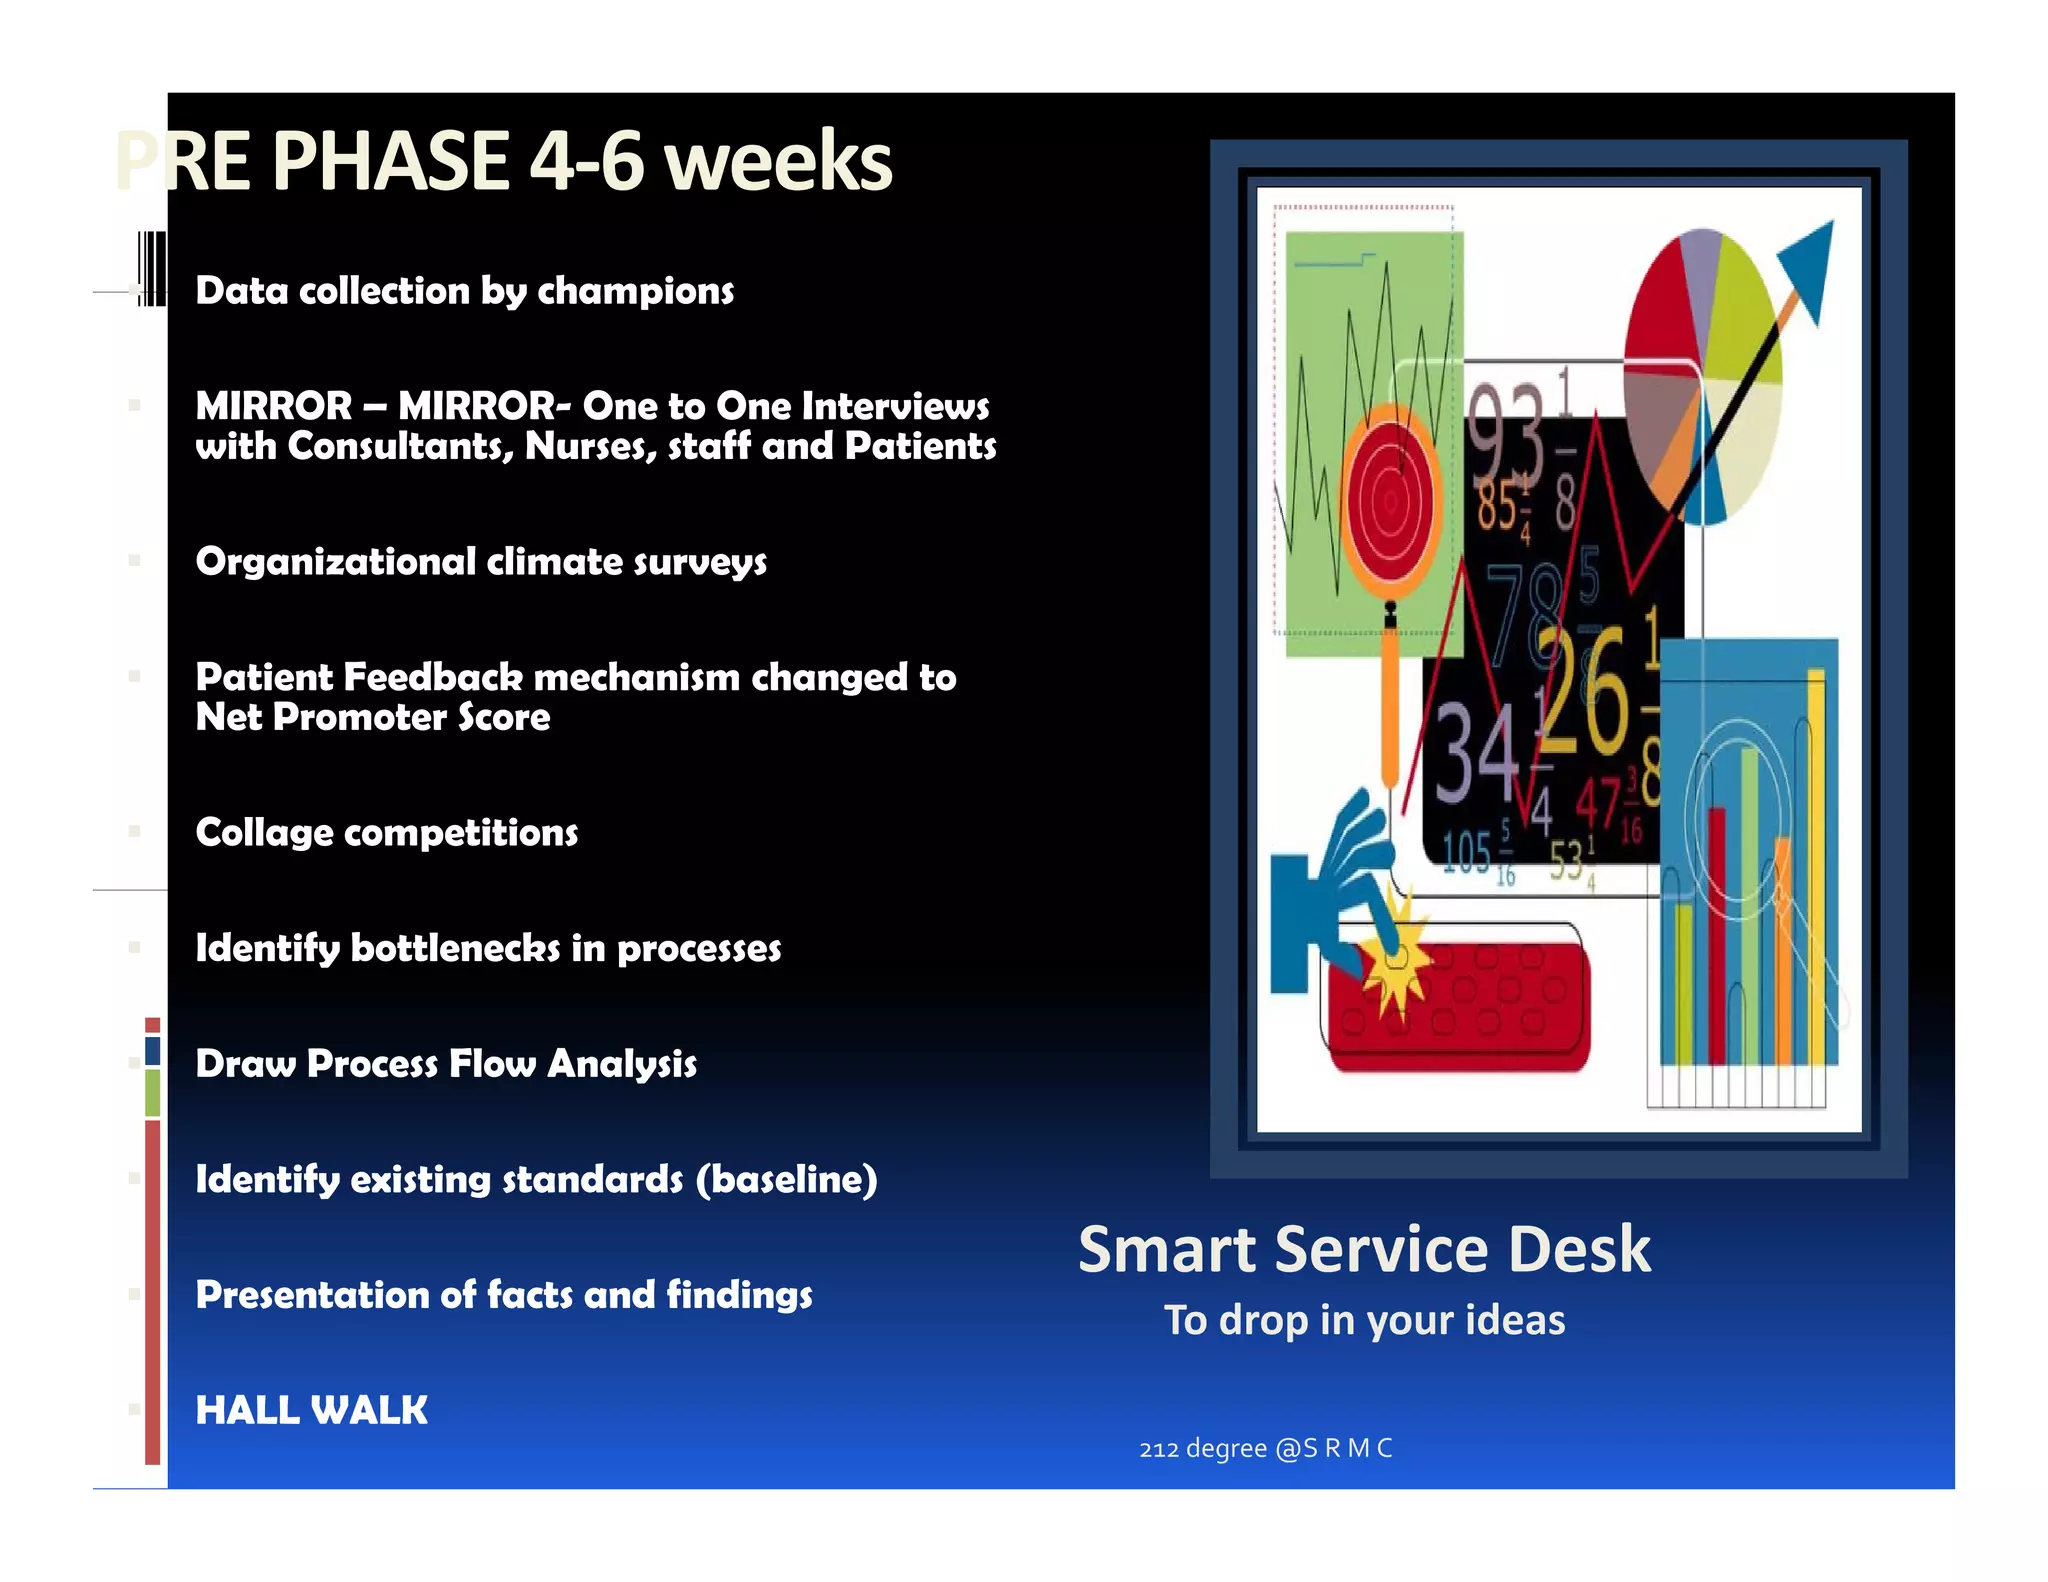
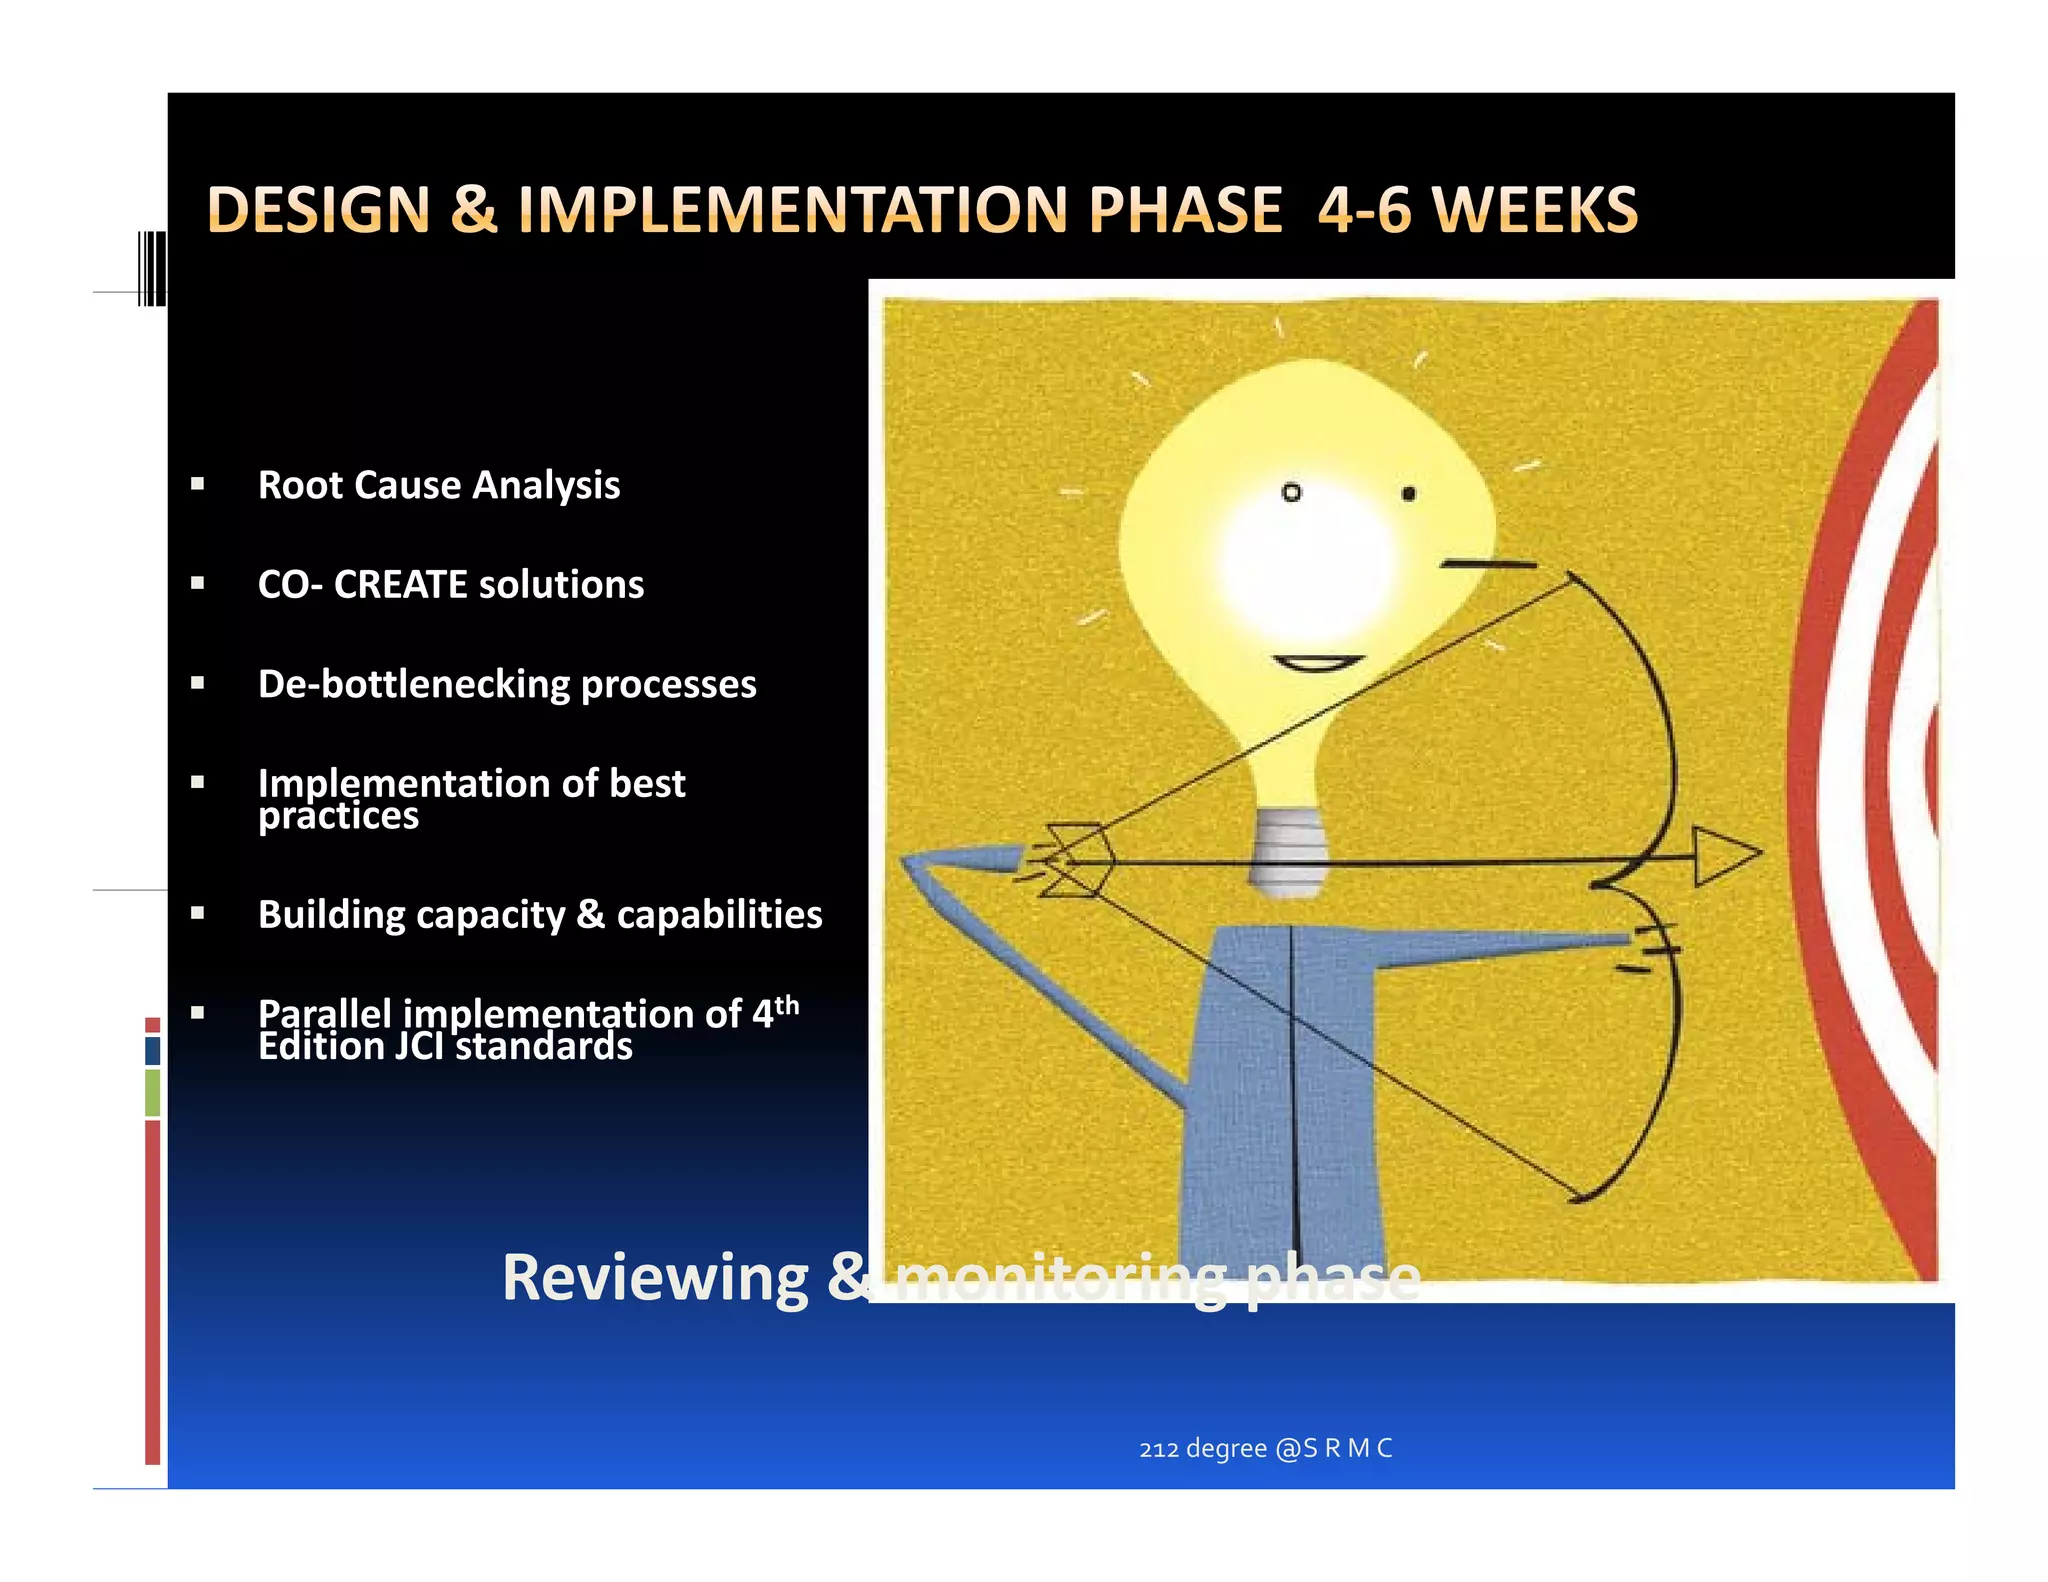
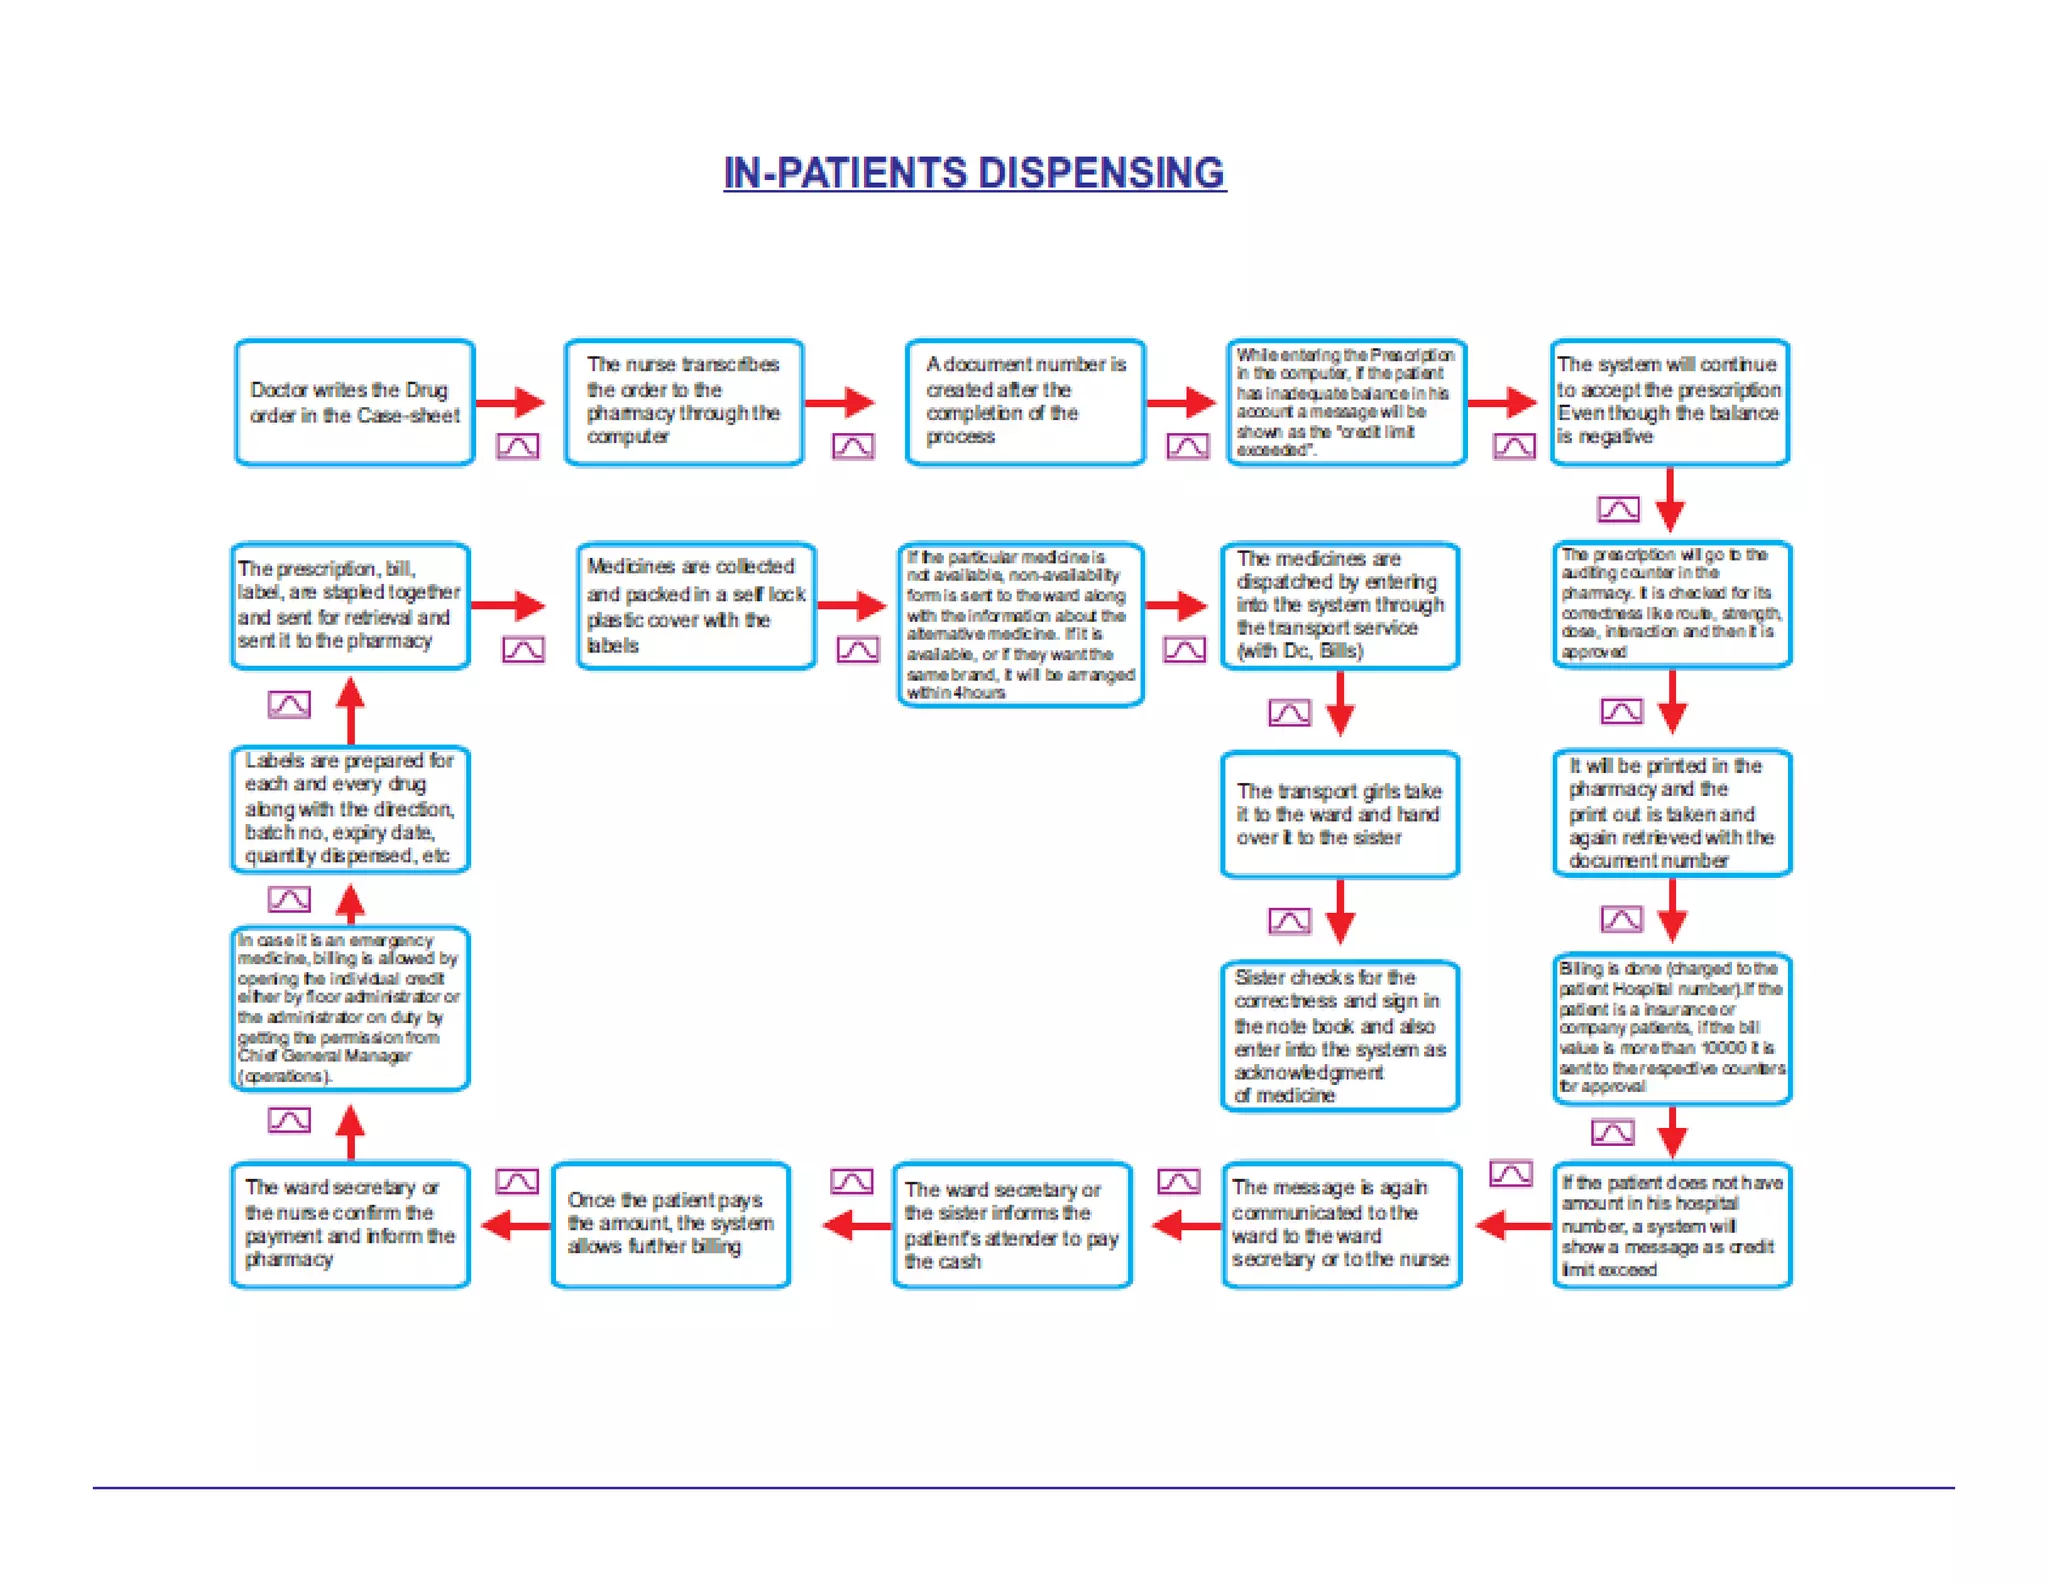
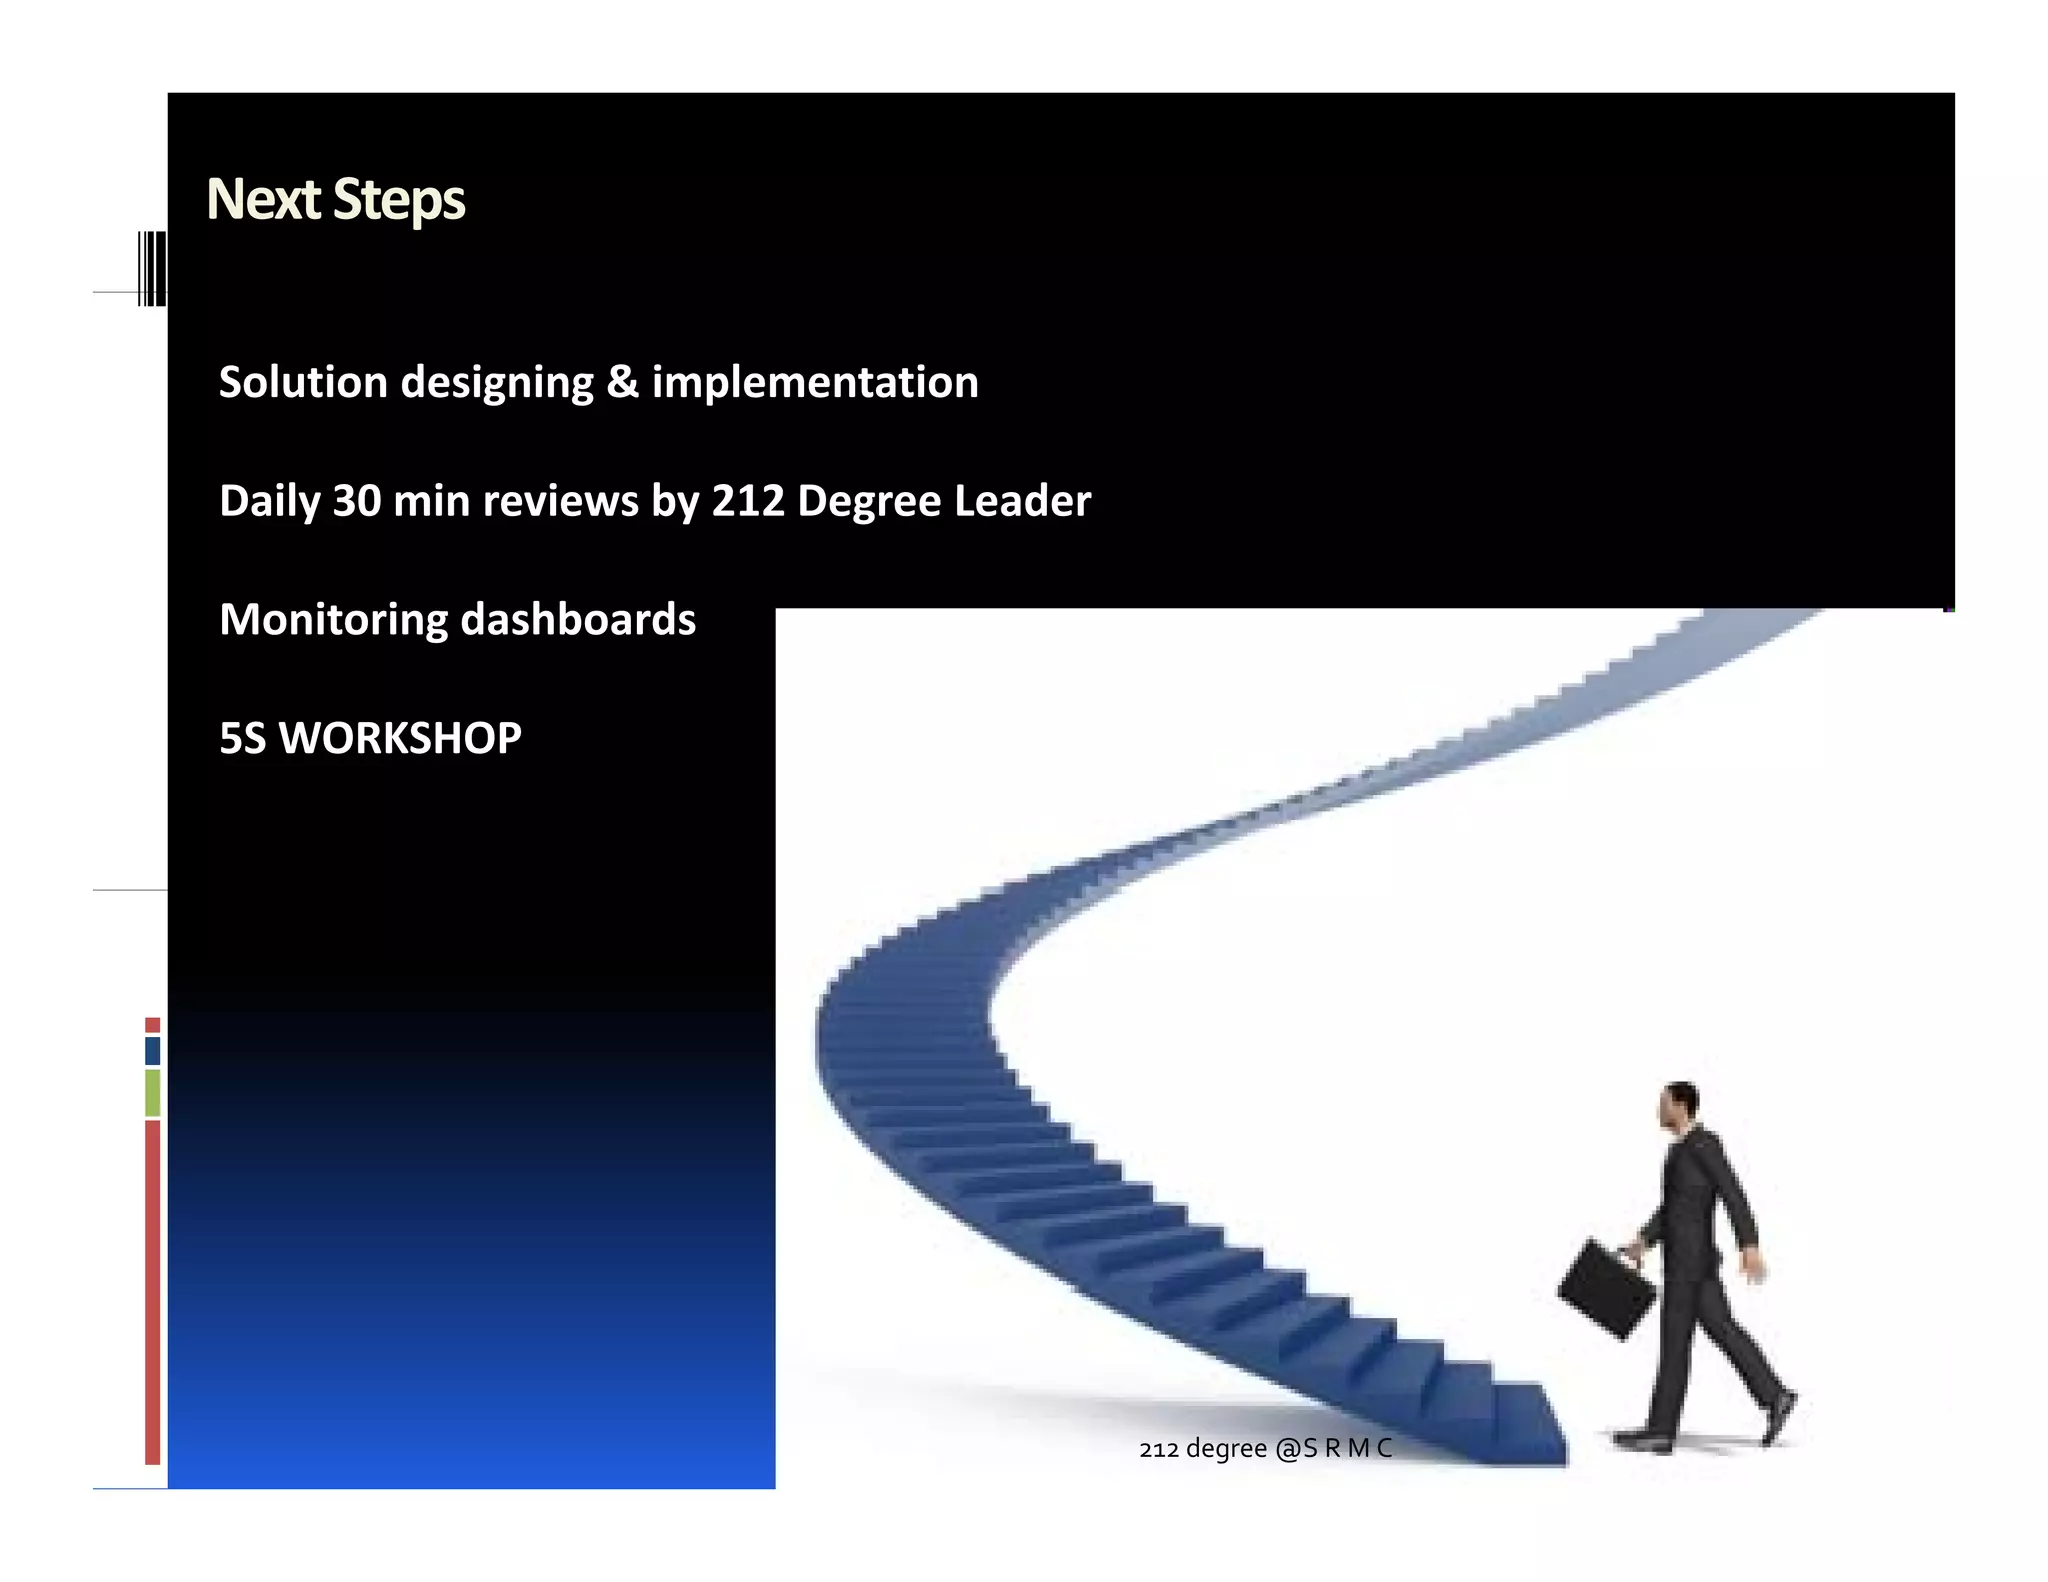
Race Course Road } Book Call Girls in Bangalore | Whatsapp No 6378878445 VIP ...
Lean in health care – crossing the hurdles final part 2
1. People asking questions… lost in confusion,
Well, I tell them there’s no problem… only
solutions.
l
‐ John Lennon
2. EMBRACE IT !!!
This may seem strange at first, but in fact many problems
y g , yp
aren’t problems at all. In fact most problems are
opportunities and many are actually ……
PINK BATS‐ unseen solutions just waiting to be found.
PINK BAT THINKING makes the impossible possible.
3. Usual major inefficiencies
Wasted motion Rework Over production Excess inventory
▪ Pharmacy tech ▪ X ray tech has to
X‐ray ▪ Admissions
spends 20
re enter 10%‐20% paperwork having
▪ Medicines held
minutes looking over in the wards
of requests 7 redundant
in multiple places excess than
because of wrong pages out in the
for a particular required .
side indication 16 page packet
med
Wasted Excess
Waiting time Wasted intellect
transportation processing
▪ 25% of patients ▪ OR team waits 20
admitted to 4M are ▪ Nurse records minutes for a ▪ Numerous ideas
transferred to a unit respiratory rate case to are “lost” only to
with a similar l l
ith i il level on 4 different
diff t begin, d is t
b i and i not be di
b rediscovered d
of care within 36 forms in the chart free to do other later
hours of admission tasks
5. Goal setting workshop
We as an organization are committed to being:
PATIENT CENTRIC‐ Being empathetic & transparent
to patients by delivering timely, adequate care &
sustainable processes
processes.
ETHICAL‐ Ensure transparency in all
systems,
systems processes & services.
services
COST EFFECTIVE‐ Delivering affordable care to
p
patients by minimizing wastages and effective
y g g
utilization of resources.
EMPLOYEE CENTRIC‐To go an extra mile to ensure
staff satisfaction, t i i career d l
t ff ti f ti training, development and
t d
overall safety.
INNOVATION‐To be an innovative organization by
the implementation of best practices and
ownership of promised services through Team
work. 212 degree @S R M C
6. 212 Lean - Objectives
JCI Re accreditation & Sustenance of processes
Primary business focus on releasing capacity, increasing throughput
and improving patient experience (e g lower waiting times)
(e.g.,
3 key deliverables
Improved utilization of assets
Superior patient
Creation of a standard way of operating,
f d d f Experience
processes, systems‐ IMPLEMENTATION OF (visible improvements)
BEST PRACTICES
Superior clinician &
Documentation of processes & creation of a STANDARD MANUAL
staff experience
Training & skill development
Superior hospital
Visual management Performance
(tangible financial benefits)
In addition, will take a 360 view to opportunistically identifying/
addition 360º
documenting other opportunities in areas we go deep in, but
sequence out implementation
7. Degrees
Report on the
Prephase‐ d t
P h data
collection findings
December 2010
b
8. ER
ENDOSCOPY
OR
2 CLINICAL
SPECIALTITES
OP
First Phase
HOUSEKEEPING &
IP FOCUS STORES
RADIOLOGY
ADMISSIONS &
BILLING
LABS
PHARMACY
DIALYSIS
212 degree @S R M C
9. Overall Program Structure
Drive the initiative Monthly
LEADERSHIP reviews
Believe in the initiative & Monthly
Sponsor it reviews
CORE
Target Setting, 10% of daily Doctors ,
TEAM
Initiative roll out time Nurses , &
Track milestones Admin ‐
To ensure 10% of daily
de‐bottlenecking and time Champions
OWNERS
own and drive
Department Own and drive implementation 80% of daily
Teams time
of initiatives
Ensure debottlenecking 25% of daily
Sustenance of initiatives time
212 degree @S R M C
10. PRE PHASE 4‐6 weeks
Data collection by champions
MIRROR – MIRROR- One to One Interviews
with Consultants, Nurses, staff and Patients
Organizational climate surveys
Patient Feedback mechanism changed to
g
Net Promoter Score
Collage competitions
Identify bottlenecks in processes
Draw Process Flow Analysis
Identify existing standards (baseline)
Smart Service Desk
Presentation of facts and findings
To drop in your ideas
HALL WALK
212 degree @S R M C
11. Root Cause Analysis
CO‐ CREATE solutions
De bottlenecking
De‐bottlenecking processes
Implementation of best
practices
Building capacity & capabilities
Parallel implementation of 4th
Edition JCI standards
Reviewing & monitoring phase
212 degree @S R M C
13. Operation Theatre
250
ENT
OG
PEAD.S
200 Average Utilization is 78%PLAS.S
GEN.S
NEURO
SGE
150 ORTHO
OPTHAL
URO
VASCULAR
100
OMFS
DENTAL
CTVS
50 PSYCHIATRIST
SMILE TRAIN
SPINE
ARTHROSCOPY
0
OTHERS
May‐10 Jun‐10 Jul‐10 Aug‐10
Data collected from previous reports
212 degree @S R M C
14. 1.
IN
2. S
PA U RA
TI
EN N CE
T
CO NO
ND T A
ITI PP
ON RO
N O VE D
L O / CA
T
Data collected from previous reports
NG
8. ER E GO
NO 3. W RY
N AW AR NO
0%
20%
40%
60%
80%
100%
AV AI RA TP
AI TIN NT
LA
BI G S S AID
UR
28
36
24
42
LI T CO
NS GE
YO
5. UL R
4.
W
2
8
7
4
FC TA Y
OM 7. OR PAT TI
M K IE ON
PA 6. – NT
23
21
17
21
TIB EDI PA U P DE
LE CA TI IN A
BL LL
Y N ENT COM T H
0
2
1
0
OO
D OT NO P
F FI T A LET
10 9. OR I TF DM E
9
8
3
.E
28
NT OR IT
QU NO
N RA P T
IP
12 M AV ‐ O RO C E D
E
60
61
62
63
13 .A EN AI PT
.S TI LA R A DU
U R LLO SS BI RE
UE LI T NSF
60
76
39
62
GE T TE YO US
ON D S
IN
Cancellation Analysis
F A ION
HE T IM ST
4
2
6
3
LD E U 11. RU T TE
UP NS PAT M N
W UI I E N DER
0
2
0
ITH TA E NT TI
BL N O SSU
PR EF ES
EV
Operation Theatre: Cancellation analysis
OR T W
6
7
7
IO
13
TH ILL
US E IN
/E
M SU G
24
28
12
14
ER RG
14 G EO
. M EN C N
5
2
2
11
ISC Y C
EL A
LA SE
4
10
11
15
NE
212 degree @S R M C
OU
S
12
16
17
15
July
June
August
September
Blood
Theatre busy
Patient not fit
Patient not admitted
Insurance not approved
Non availability of compatible
15. Endoscopy Maximum cases done are
private in Medical
Gastroenterology
Case Mix
PVT Ward Free OPD NB Ward Total No. of Cases
196
92
62
19 9 4 19
0 3 3 7 2 0 0 9
Medical Surgical General Surgery
Gastroenterology Gastroenterology
Data collected from previous reports
212 degree @S R M C
16. Endoscopy 81% of the endoscopies are
done by two doctors
No. of Cases Performed by doctors
6% 2% 1%
0% 8%
2% Dr. A
Dr. B
Dr. C
Dr. D
Dr. E
28%
Dr. F
53% Dr. G
Dr. H
Data collected from previous reports
212 degree @S R M C
17. ENDOSCOPY An average of 345 endoscopies
are done every month
ENDOSCOPY PROCEDURES
500
400
Grand To (No.)
300
otal
200
100
0
AUGUST, JULY,2010 JUNE, 2010 MAY, 2010
Series1 331 405 363 284
Total TAT is about 75 min (even for a 15 min procedure)
Data collected from previous reports
212 degree @S R M C
19. EMERGENCY
20% OF ER CASES ARE
AVERAGE TIME TAKEN BY A PATIENT IN ER FEVER FOR
EVALUATION & 13% FOR RTA.
ALOS in ER is about 8 hours
617.4
Total TAT for Patient in ER is about
10 hours
700
451.2
600
500
400
Seri es 1
300
200
100
0
TOTAL LENGTH OF STAY TOTAL TAT FOR A
IN ER (MIN) PATIENT IN ER(MIN)
Cause of increased LOS is waiting for the investigative reports or bed unavailability
212 degree @S R M C
Data collected by observation
20. IN PATIENTS
Patients routinely interact with 7‐9 different nurses during their stay in wards
Patient exposure to nurses
p
Bed
number shift 15-09-10 16-09-10 17-09-2010 18-09-10 19-09-10 20-09-10 21-09-10
A m
B m
C m
D m
E m
F e
G e
H e
I e
J e
K n
L n
M n
N n
O n
Different colours represent different nurses Data collected by observation @S R M C
212 degree
23. MIRROR ‐MIRROR‐ EMPLOYEES
How many years you have been working with the hospital?
27 % 28 %
30
25
20 %
20 16 %
15
9%
10
5
0
0 ‐ 2 years 2 ‐ 4 years 4 ‐ 6 years 6 ‐ 8 years > 8 years
Data collected by feedback 212 degree @S R M C
24. MIRROR ‐MIRROR‐ EMPLOYEES
The organization cares for me
41.9 %
45
40
31.8 %
35
30
25
20
15 9.48 % 7.95 % 8.87 %
10
5
0
Strongly Agree I am Disagree Strongly
Agree indifferent Disagree
Data collected by feedback 212 degree @S R M C
25. MIRROR ‐MIRROR‐ EMPLOYEES
Need of the day at this hospital today is About 45% of the
staff feels that the
processes need to be
45 % improved
45
40
30.67 %
35
30
25
20
15 10 %
8.33 %
33
10 6%
5
0
Better Better Better Better people Better IT
processes infrastructure technology
Data collected by feedback 212 degree @S R M C
26. MIRROR ‐MIRROR‐ EMPLOYEES
Have you visited the hospital before? It is 7 times easier
to retain an
existing p
g patient
than getting
104 a new one
120
100 78
80
60
40 26
20
0
Total Yes No
Data collected by feedback 212 degree @S R M C
27. MIRROR ‐MIRROR‐ EMPLOYEES
Need of the day at this hospital today is
Alarming‐ as there are about 23%
of the patients who are DETRACTORS
120 104 They would never refer the hospital
to anyone
100
80 56
60
40 19
12 12
20 5
0
Total 1 Never 2 3 4 5
Definitely
Data collected by feedback 212 degree @S R M C
28. Next Steps
Solution designing & implementation
Daily
D il 30 min reviews by 212 Degree Leader
i i b D L d
Monitoring dashboards
5S WORKSHOP
212 degree @S R M C
29. REPORT CARD – Month
Every patient Delighted
Asset Metric Unit Apr '09 May' 09 June' 09 Target
OPD Patients waiting beyond 15 mins of appnt % 3% 5% 3% <5%
PHC %age PHCs completed within defined TAT % 63% 76% 78% 90%
ER Pts with LOS > 4 hrs in triage % 1% 0% 0% <5%
ER Ambulance response outside 10 mins % 0% 2% 0% <10%
Score ‐
Wards Discharges before 11 am % 34% 44% 43% 75%
IPD ALOS Days 4 3.75 4
Procedure / Surgeries starting within 30 mins
OT & Cath Lab % 85% 91% 91% 90%
of scheduled time
Short lead test completed with in 1hour 30
Lab Med % 77% 91% 90% 90%
mins
USG reports within 15 mins
Radiology % 38% 45% 46% 90%
X-ray reports within 30 mins
Asset Metric Apr '09 May' 09 June' 09 Target
OPD Calls Dropped % <5%
ER Ambulance calls turned back % 0% 4% 3% <5%
Score –
IPD Admissions denied % 0% 0% 0% 0%
OT & Cath Lab Surgeries rescheduled % 7% 5% 4% <5%
Asset
A t Metric
M ti Apr
A '09 M '09 J
May June'' 09 T
Target
t
ICUs % Step downs planned % 46% 47% 63% 80
Patients with final bill more than 5% of
Billing % 10% 7.3% 5.8% <5%
estimate
Wards % discharges planned % 63% 78% 82% 80%
Wards Length of discharge process Mins 203 202.5 180 120
Score – House keeping TAT for room cleaning post discharge Mins 20 23 25 30
Score 67% 75% 81%
Score =1 =2 =3
30. LAB – IDENTIFIED PROBLEMS & AND POTENTIAL SOLUTIONS
IDENTIFIED PROBLEM POSSIBLE SOLUTION ACTION TAKEN
Blood “Frequent delay in transport
collection & of samples from ward to lab Provision of Pneumatic system Feasibility studies and
transport
t t because of long waiting time or prioritized lifts installation
for the lifts
One Phlebotomist is Education to be given to
assigned for wide area for Ward Nurse / Secretary to strictly
collection. This leads to
the ward nurses /
follow the schedule
delay in collection after secretaries
t i
request creation especially
during peak hours”
Blood samples are
To increase the number of
Frequently lysed
q y y HR staffing plan review
gp
Phlebotomists
especially from ICU
Structured education
ICU staff nurse to be trained periodically
sessions with periodic
During net ork
D ring network in blood collection techniques
evaluation--
l ti
breakdown samples are
dispatched to lab without
hospital number and with
only the name of patient. All samples can be received with hand
This causes confusion in Education and information
written hospital number from ward / ICU
processing and results of dissemination To improve
samples Frequent Run They
Th can be continuous numbers for
b ti b f network efficiency
time error necessitates easy verification
shut down and restart of
machines
212 degree @S R M C
32. Background
Project Title:5S
Company
C SRMC
RMC
Name:
Gemba: Ist Floor to 7th floor
Date: 07.05.2011
07 05 2011
8 GEMBAS for 7 floors
Preliminary Objectives
To implement 5S concepts in
Admission, Billing,
Admission Billing Lab ,Radiology,Cardiology and
Radiology Cardiology
Endoscopy
To stream line process for better efficiency
To optimize output in each area
Concerns / Issues Needing Attention from one
team
Team Name: TEAM B
Find a place for scrapped items Members: Lean members present‐ Dr. UmaSekar, Dr.
K.S.Sridharan, Dr.
Maintain orderliness in change rooms/ cleaning
Naveen, Ms.Latha, Mr.Gunasekaran, Mr.Thikkaram, Ms.
, , , ,
rooms
Anuradha, Ms.
Educating all Gemba staffs on 5S principles, Baghyalakshmi, Ms.Manimekalai, Ms.P.Sudha, Ms.Sheela, Sr.Devi
Retention period for documents not specified , Sr.Mohana, Sr.Mythili,
for Radiology Core Team members‐ Mr.Alagumuni, Ms.Gunasundari, Ms.
Kokilavani, Ms.Jeyanthi, Ms.Sowbaghyalaksmi
, y , g y
33. Action taken during workshop
5 S Steps Actions taken
Seiri – Sort Sorting of files, papers, consumables and stocks
Seiton – Set in Identified suitable places for keeping the items and
Order labelling done for easy retrieval, floor mapping in
radiology
Seiso – Extensive cleaning, dusting and mopping done
Cleaning
37. What has changed…………………
WHAT CHANGES WILL THE PATIENT’S NOTICE IN YOUR GEMBA?
Area found to be more neat and clean than before
WHAT CHANGES WILL THE DOCTOR’S NOTICE?
DOCTOR S
‐ Things are well organized
WHAT CHANGES WILL THE GEMBA STAFF NOTICE?
‐Staff will find easy to work when things are organized well
ff f
39. Labs
iI
Introduced new tests and combined test panels ‐ average revenue 3.62 lakhs per
monthth
Reduced lysis of samples in ICU’s from 0.3% to 0.07%
Reagent wastage minimized per month ‐ saving of 32,000 INR
Number of samples increased 25% of the times
The outliers for number of tests that are reported (>90 min) reduced form 30% to 3%
40. Pharmacy
iI
Reduced waiting time for OP prescriptions .
Dispensing TAT from 1hr 20 minutes to 50 minutes
Medical and Surgical Dispensing at one counter
g p g
41. OR
iI
Number of surgeries per day increased from 35 to 38
Capacity released
% surgeries scheduled a day before (
g y (Gen Surg) increased from 65% to 100%
g) 5
Cancellations (Gen Surg) reduced from 23% to 12%
Delay in first case starts (8:00 am) reduced to only 10% delays from 32% for Gen Surg
am)‐
and OBG
42. ER
iI
Patients with length of stay more than 4 hours reduced from an average of 77 patients
per day to 10 patients per d
d t ti t day
Cash collection in ER‐ Average of 1.2 lakhs is increased due to release of capacity.
TAT Radiology investigations‐ reduced considerably
43. Dialysis
iI
75% of the patients coming with appointments
Average TAT per dialysis chair increased from 2 to 2.3
44. Endoscopy
iI
Appointment system in place
Slots for different consultants
Endoscopy utilization went up from 18‐ 48%
py p 4
Release of capacity‐ more cases can be done easily
45. IP
iI
Activity card updations including implant costs, category fee etc – updated within 24
hours of surgery t prevent l
h f to t losses and b tt communication
d better i ti
Cohorting in process
Room TAT decreased form 180 min to 45 mins
46. OPDs
iI
Number of Gen Surg OP per day increased from 25 to 28
First OP case delays (9:00 am) reduced form 30 min to 15 min
Centralized Appointment system started
pp y
Number of repeat patients (OBG and Gen Surg) increased from 41 to 71
47. Radiology
iI
Voice Recognition Software used for all reports‐ Saves time and errors
Separate IP and OP Slots‐ Streamlined processes and better visibility (All IP’s done on
the same day and more OP’s are done)
Capacity released
Increased Equipment utilization
MRI scans increased from 21 to 26
48. Success Mantra……
Communication
Implementation of all solutions
Improved tracking mechanism‐ Targets review &
scorecard
Mirror Mirror‐ Top 15 initiatives to be finalized for
patient and employee satisfaction
Involvement of Doctors
capacity released
Continuous internal reviews (daily, weekly, monthly)