Transcript: #StandardsGoals for 2024: What’s new for BISAC - Tech Forum 2024
Leaf Graphing Practice
1. Name_________________________________Date_______Pd._________Score:_________
Graphing Practice
Directions: Use the following information to create a scatter plot for graph #1. Read it
carefully to pick out clues about how to set up the graph. Use the graphing paper
below.
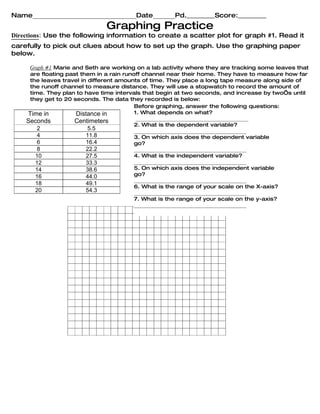
Graph #1 Marie and Seth are working on a lab activity where they are tracking some leaves that
are floating past them in a rain runoff channel near their home. They have to measure how far
the leaves travel in different amounts of time. They place a long tape measure along side of
the runoff channel to measure distance. They will use a stopwatch to record the amount of
time. They plan to have time intervals that begin at two seconds, and increase by two’s until
they get to 20 seconds. The data they recorded is below:
Before graphing, answer the following questions:
Time in Distance in 1. What depends on what?
___________________________________________
Seconds Centimeters
2. What is the dependent variable?
2 5.5 ___________________________________________
4 11.8 3. On which axis does the dependent variable
6 16.4 go?
8 22.2 ___________________________________________
10 27.5 4. What is the independent variable?
12 33.3 ___________________________________________
14 38.6 5. On which axis does the independent variable
16 44.0 go?
___________________________________________
18 49.1
6. What is the range of your scale on the X-axis?
20 54.3 ___________________________________________
7. What is the range of your scale on the y-axis?
___________________________________________