SlideShare a Scribd company logo
1 of 1
Download to read offline
City of Cape Coral
City of Fort Myers
City of Sanibel
City of Bonita Springs
Town of Fort Myers Beach
SR93/I-75
TAMIAMITRAIL
PALM
BEACH
BLVD
PINE ISLAND RD
IMMOKALEE ROAD
CORKSCREW ROAD
ALICO ROAD
STRINGFELLOWROAD
C
R
-850
CHIQUITABLVD.
LEE BLVD/JOEL BLVD
N. RIVER ROAD
ESTERO
BLVD.
SR/80
SR 82
BAYSHORE RD.
MCGREGORBLVD
DIPLOMAT PKWY
SUMMERLIN ROAD
BONITA BEACH ROAD
CR 78
CLEVELANDAVE
SIXMILEPKWY
DELPRADOBLVD
COLONIAL BLVD
ARCADIARD
SKYLINEBLVD.
METROPARKWAY
BURNTSTORERD/CR765
GLADIOLUS DR
DELPRADOBLVD.
KISMET PKWY.
AGBELLBLVD.
WINKLERRD
SANIBEL CAPTIVA RD
RICHMONDAVE.
H
O
M
ESTEAD
R
O
AD
VETERANS PKWY
ORTIZAVENUE
FOWLERST
DANIELS PARKWAY
TROPICANA PKWY
SLATERROAD
SANTABARBARABLVD.
LEONARD BLVD.
IMMOCKALEE RD/CR 846
PLANTATIONROAD
PARKAVE/USB.41(NB)
CAPE CORAL PKWY.
CHURCHROAD
SANIBELCAUSEWAY
COUNTRYCLUBBLVD.
THREEOAKSPKWY
SURFSIDEBLVD
WINKLER AVE
TICE STREET
NALLEROAD
CAPTIVA DRIVE
EMBERS PKWY.
GASPARILLAROAD
SUNSHINEBLVD.
WEST GULF DRIVE
TERRY ST. E & W
EVERGLADESBLVD
N. RIVER RD./CR-78
BUCKINGHAMROAD
PERWINKLEWAY
ORANGE RIVER BLVD
CAPE CORAL PKWY
PONDELLA RD/CR 78A
LAUREL DR
HICKORYAVE
IONA ROAD
NALLE GRADE ROAD
BEACH PKWY
ANDALUSIABLVD.
TRAFALGAR PARKWAY
LEEROAD
HUNTERBLVD.
NICHOLAS PKWY.
SR31
LITTLETON ROAD
NUNAAVE
FT.DENAUDROAD
DANIELS PKWY
MARIANA AVE
NE24THAVE.
COCONUT ROAD
KELLY ROAD
GRANDEAVE
WILLIAMS ROAD
CHAM
BERLIN
PKW
Y.
GREENBRIAR BLVD.
EDG
EW
O
O
D
AVENUE
A.W.BULBROAD
KIRBYTHOMPSONRD.
PALMTREEBLVD.
BETHSTACEYBLVD.
BEACH PKWY.
SKYLINE DRIVE
HANSON ST.
TAMIAMITRAIL
D
AN
IELS
PAR
KW
AY
BUCKINGHAMROAD
Gulf of Mexico
Lee County
FL
Collier County
Charlotte County
HendryCounty
Lee County
Lee County Parks & Recreation Park Score Analysis
Lakes Regional Park
Lee County Park System
SummerlinRd
GladiolusDr
US41
US41
Sum
m
erlin
Rd
County Parks
Half Mile Access0 0.25 0.50.125 Miles
Above: Lee County Parks and Recreation SystemService Area Analysis
Above: Lakes Regional Park and service areas at two entrances. Service area is defined by
a half-mile, or about a ten-minute walk, along a public road network. This process identifies
the percentage of the population living within the half-mile service area.
Entrance 2
Entrance 1
Poster and analysis by George Sprehn and Dan Calvert, Lee County Parks and Recreation November 2012
Percent of unincorporated Lee County population served by park system.
¹ County Parks
City Limits ¹0 3.5 71.75
Miles
This project uses the methodologies of ParkScore, a rating system by
the Trust for Public Land, to rate Lee County's parks and recreation.
ParkScore ranks 40 US cities by park acreage, service and investment,
and access. Points are awarded in each category, normalized, and
ranked. Here, Lee County is likewise rated and ranked with the cities.
(See TPL at http://parkscore.tpl.org/methodology.php for full details)
Park Score
0.0 2.0 4.0 6.0 8.0 10.0 12.0 14.0
TOTAL POP SERVED
Below 18
18 TO 64
Above 64
Percent Served within 10-minute walk
AgeCategory
Percent Served by Age
Raw Score Park Score
17.5= 21 of 120
Lee County Parks and Recreation Park Score
TPL's ParkScores of 40 major US cities range from 21.5 to 74.0
+ +
Service and
Investment
Service and Investment measures resource commitment to parks. Points
are awarded in equally weighted categories: playgrounds per resident
and spending per resident. In TPL's national sample of 40 cities,
playgrounds per 10,000 residents range 1 - 5, median 1.89, and spending
per resident ranges $31 to $303 with a median of $85.
9 of 40
In the Service and Investment category up to 40 points can be awarded,
split equally between Spending per Resident (20) and Playgrounds per
10,000 Residents (20). Lee County earns 4 of 20 and 5 of 20, respectively,
gaining 9 of 40 points overall. This places Lee County at the national
median of $85 in spending per resident, and just below the national
median of 1.87 playgrounds per 10,000 residents at 1.53.
Spending per
Resident: $84.82
4 of 20 Points
Playgrounds per
10,000 Residents:
1.53
5 of 20 Points
In the Access category up to 40 points can be awarded. Lee County
earns 1 of 40 points at 12% of unincorporated residents served.
This places Lee County below TPL's national sample of 40 cities
( median 57%). Lee County's score is representative of a large
county area as opposed to ParkScore's city areas.
1 of 40
Serviced
Population
12%
The Access category measures the percent of the population living within
a half-mile, or about a 10-minute walk, of a park's entrance. The service
area is determined by network analysis. Points awarded are based on
TPL's national sample of 40 cities, the range is 26 to 97 percent with
a median of 57 percent.
Access Acreage
The Acreage category takes into account the influence of regional parks.
Points are based on TPL's national sample, where median park size
ranges from 0.6 to 19.9 acres, median 4.9 acres, and park acres as a
percentage of city area ranges from 2.3 to 22.8 percent, with a
median of 9.1 percent.
Median Park Size:
6.3 acres
7 of 20 Points
Park Land as
Percent of County
Area: 4.9%
4 of 20 Points
11 of 40
In the Acreage catagory up to 40 points can be awarded split
equally between Median Park Size (20) and Park Lands as
Percent of County Area (20). Lee County earns 7 of 20 and
4 of 20, respectively. This places Lee County (6.3 acres) above
TPL's median of 4.9 acres median park size. Lee County's 4.9
percent is below the mean of 9.1 percent in the Park Lands as
Percent of County Area category.

More Related Content

Similar to LCPR Park Score Analysis Poster, Sprehn, 2013

College Station 2016 Citizen Survey Results
College Station 2016 Citizen Survey ResultsCollege Station 2016 Citizen Survey Results
College Station 2016 Citizen Survey ResultsCity of College Station
 
Ericsson ConsumerLab: Voice and Internet Vital to City Life
Ericsson ConsumerLab: Voice and Internet Vital to City LifeEricsson ConsumerLab: Voice and Internet Vital to City Life
Ericsson ConsumerLab: Voice and Internet Vital to City LifeEricsson
 
Millennial is a State of Mind - Zipcar 2015 Millennial Survey Results
Millennial is a State of Mind - Zipcar 2015 Millennial Survey ResultsMillennial is a State of Mind - Zipcar 2015 Millennial Survey Results
Millennial is a State of Mind - Zipcar 2015 Millennial Survey ResultsZipcar_PR
 
2014 City of Des Peres Community Survey: Final Report
2014 City of Des Peres Community Survey: Final Report2014 City of Des Peres Community Survey: Final Report
2014 City of Des Peres Community Survey: Final ReportCrowdbrite
 
Highlights of City of Durham 2016 resident survey - presentation
Highlights of City of Durham 2016 resident survey - presentationHighlights of City of Durham 2016 resident survey - presentation
Highlights of City of Durham 2016 resident survey - presentationRyan Smith
 
LogoThe City of City NameA Report to Our Citizens 20XX-20XX.docx
LogoThe City of City NameA Report to Our Citizens 20XX-20XX.docxLogoThe City of City NameA Report to Our Citizens 20XX-20XX.docx
LogoThe City of City NameA Report to Our Citizens 20XX-20XX.docxsmile790243
 
Regional Open House Presentation-April 2014
Regional Open House Presentation-April 2014Regional Open House Presentation-April 2014
Regional Open House Presentation-April 2014Heartland2050
 
4. Importance of City Planning - Dr. Toe Aung Ycdc
4. Importance of City Planning - Dr. Toe Aung Ycdc4. Importance of City Planning - Dr. Toe Aung Ycdc
4. Importance of City Planning - Dr. Toe Aung YcdcEthical Sector
 
Accessible Bergen County Survey
Accessible Bergen County SurveyAccessible Bergen County Survey
Accessible Bergen County Surveyguestbc0af1
 
The Trust for Public Land_ParkServeSummary
The Trust for Public Land_ParkServeSummaryThe Trust for Public Land_ParkServeSummary
The Trust for Public Land_ParkServeSummaryRon Sherman
 
Black Hats to White Hats: Changing the Brand Image of Parks and Recreation Th...
Black Hats to White Hats: Changing the Brand Image of Parks and Recreation Th...Black Hats to White Hats: Changing the Brand Image of Parks and Recreation Th...
Black Hats to White Hats: Changing the Brand Image of Parks and Recreation Th...BrandAidConference
 
Intro to Vision Zero Presentation
Intro to Vision Zero PresentationIntro to Vision Zero Presentation
Intro to Vision Zero Presentationomedina91
 

Similar to LCPR Park Score Analysis Poster, Sprehn, 2013 (20)

College Station 2016 Citizen Survey Results
College Station 2016 Citizen Survey ResultsCollege Station 2016 Citizen Survey Results
College Station 2016 Citizen Survey Results
 
Ericsson ConsumerLab: Voice and Internet Vital to City Life
Ericsson ConsumerLab: Voice and Internet Vital to City LifeEricsson ConsumerLab: Voice and Internet Vital to City Life
Ericsson ConsumerLab: Voice and Internet Vital to City Life
 
Complete Streets Presentation
Complete Streets PresentationComplete Streets Presentation
Complete Streets Presentation
 
Millennial is a State of Mind - Zipcar 2015 Millennial Survey Results
Millennial is a State of Mind - Zipcar 2015 Millennial Survey ResultsMillennial is a State of Mind - Zipcar 2015 Millennial Survey Results
Millennial is a State of Mind - Zipcar 2015 Millennial Survey Results
 
2014 City of Des Peres Community Survey: Final Report
2014 City of Des Peres Community Survey: Final Report2014 City of Des Peres Community Survey: Final Report
2014 City of Des Peres Community Survey: Final Report
 
Highlights of City of Durham 2016 resident survey - presentation
Highlights of City of Durham 2016 resident survey - presentationHighlights of City of Durham 2016 resident survey - presentation
Highlights of City of Durham 2016 resident survey - presentation
 
LogoThe City of City NameA Report to Our Citizens 20XX-20XX.docx
LogoThe City of City NameA Report to Our Citizens 20XX-20XX.docxLogoThe City of City NameA Report to Our Citizens 20XX-20XX.docx
LogoThe City of City NameA Report to Our Citizens 20XX-20XX.docx
 
Regional Open House Presentation-April 2014
Regional Open House Presentation-April 2014Regional Open House Presentation-April 2014
Regional Open House Presentation-April 2014
 
Smart Growth Climate Change and Prosperity
Smart Growth Climate Change and Prosperity Smart Growth Climate Change and Prosperity
Smart Growth Climate Change and Prosperity
 
Why Riverside?
Why Riverside?Why Riverside?
Why Riverside?
 
2013 Space 134 Vision Plan
2013 Space 134 Vision Plan2013 Space 134 Vision Plan
2013 Space 134 Vision Plan
 
4. Importance of City Planning - Dr. Toe Aung Ycdc
4. Importance of City Planning - Dr. Toe Aung Ycdc4. Importance of City Planning - Dr. Toe Aung Ycdc
4. Importance of City Planning - Dr. Toe Aung Ycdc
 
Accessible Bergen County Survey
Accessible Bergen County SurveyAccessible Bergen County Survey
Accessible Bergen County Survey
 
Donovan rypkema presentation
Donovan rypkema presentationDonovan rypkema presentation
Donovan rypkema presentation
 
Donovan rypkema presentation
Donovan rypkema presentationDonovan rypkema presentation
Donovan rypkema presentation
 
The Trust for Public Land_ParkServeSummary
The Trust for Public Land_ParkServeSummaryThe Trust for Public Land_ParkServeSummary
The Trust for Public Land_ParkServeSummary
 
November 18 TWG PPT Show
November 18 TWG PPT ShowNovember 18 TWG PPT Show
November 18 TWG PPT Show
 
Black Hats to White Hats: Changing the Brand Image of Parks and Recreation Th...
Black Hats to White Hats: Changing the Brand Image of Parks and Recreation Th...Black Hats to White Hats: Changing the Brand Image of Parks and Recreation Th...
Black Hats to White Hats: Changing the Brand Image of Parks and Recreation Th...
 
Intro to Vision Zero Presentation
Intro to Vision Zero PresentationIntro to Vision Zero Presentation
Intro to Vision Zero Presentation
 
Placemaking through complete streets
Placemaking through complete streetsPlacemaking through complete streets
Placemaking through complete streets
 

LCPR Park Score Analysis Poster, Sprehn, 2013

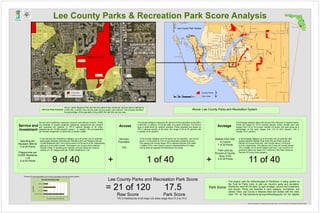
  • 1. City of Cape Coral City of Fort Myers City of Sanibel City of Bonita Springs Town of Fort Myers Beach SR93/I-75 TAMIAMITRAIL PALM BEACH BLVD PINE ISLAND RD IMMOKALEE ROAD CORKSCREW ROAD ALICO ROAD STRINGFELLOWROAD C R -850 CHIQUITABLVD. LEE BLVD/JOEL BLVD N. RIVER ROAD ESTERO BLVD. SR/80 SR 82 BAYSHORE RD. MCGREGORBLVD DIPLOMAT PKWY SUMMERLIN ROAD BONITA BEACH ROAD CR 78 CLEVELANDAVE SIXMILEPKWY DELPRADOBLVD COLONIAL BLVD ARCADIARD SKYLINEBLVD. METROPARKWAY BURNTSTORERD/CR765 GLADIOLUS DR DELPRADOBLVD. KISMET PKWY. AGBELLBLVD. WINKLERRD SANIBEL CAPTIVA RD RICHMONDAVE. H O M ESTEAD R O AD VETERANS PKWY ORTIZAVENUE FOWLERST DANIELS PARKWAY TROPICANA PKWY SLATERROAD SANTABARBARABLVD. LEONARD BLVD. IMMOCKALEE RD/CR 846 PLANTATIONROAD PARKAVE/USB.41(NB) CAPE CORAL PKWY. CHURCHROAD SANIBELCAUSEWAY COUNTRYCLUBBLVD. THREEOAKSPKWY SURFSIDEBLVD WINKLER AVE TICE STREET NALLEROAD CAPTIVA DRIVE EMBERS PKWY. GASPARILLAROAD SUNSHINEBLVD. WEST GULF DRIVE TERRY ST. E & W EVERGLADESBLVD N. RIVER RD./CR-78 BUCKINGHAMROAD PERWINKLEWAY ORANGE RIVER BLVD CAPE CORAL PKWY PONDELLA RD/CR 78A LAUREL DR HICKORYAVE IONA ROAD NALLE GRADE ROAD BEACH PKWY ANDALUSIABLVD. TRAFALGAR PARKWAY LEEROAD HUNTERBLVD. NICHOLAS PKWY. SR31 LITTLETON ROAD NUNAAVE FT.DENAUDROAD DANIELS PKWY MARIANA AVE NE24THAVE. COCONUT ROAD KELLY ROAD GRANDEAVE WILLIAMS ROAD CHAM BERLIN PKW Y. GREENBRIAR BLVD. EDG EW O O D AVENUE A.W.BULBROAD KIRBYTHOMPSONRD. PALMTREEBLVD. BETHSTACEYBLVD. BEACH PKWY. SKYLINE DRIVE HANSON ST. TAMIAMITRAIL D AN IELS PAR KW AY BUCKINGHAMROAD Gulf of Mexico Lee County FL Collier County Charlotte County HendryCounty Lee County Lee County Parks & Recreation Park Score Analysis Lakes Regional Park Lee County Park System SummerlinRd GladiolusDr US41 US41 Sum m erlin Rd County Parks Half Mile Access0 0.25 0.50.125 Miles Above: Lee County Parks and Recreation SystemService Area Analysis Above: Lakes Regional Park and service areas at two entrances. Service area is defined by a half-mile, or about a ten-minute walk, along a public road network. This process identifies the percentage of the population living within the half-mile service area. Entrance 2 Entrance 1 Poster and analysis by George Sprehn and Dan Calvert, Lee County Parks and Recreation November 2012 Percent of unincorporated Lee County population served by park system. ¹ County Parks City Limits ¹0 3.5 71.75 Miles This project uses the methodologies of ParkScore, a rating system by the Trust for Public Land, to rate Lee County's parks and recreation. ParkScore ranks 40 US cities by park acreage, service and investment, and access. Points are awarded in each category, normalized, and ranked. Here, Lee County is likewise rated and ranked with the cities. (See TPL at http://parkscore.tpl.org/methodology.php for full details) Park Score 0.0 2.0 4.0 6.0 8.0 10.0 12.0 14.0 TOTAL POP SERVED Below 18 18 TO 64 Above 64 Percent Served within 10-minute walk AgeCategory Percent Served by Age Raw Score Park Score 17.5= 21 of 120 Lee County Parks and Recreation Park Score TPL's ParkScores of 40 major US cities range from 21.5 to 74.0 + + Service and Investment Service and Investment measures resource commitment to parks. Points are awarded in equally weighted categories: playgrounds per resident and spending per resident. In TPL's national sample of 40 cities, playgrounds per 10,000 residents range 1 - 5, median 1.89, and spending per resident ranges $31 to $303 with a median of $85. 9 of 40 In the Service and Investment category up to 40 points can be awarded, split equally between Spending per Resident (20) and Playgrounds per 10,000 Residents (20). Lee County earns 4 of 20 and 5 of 20, respectively, gaining 9 of 40 points overall. This places Lee County at the national median of $85 in spending per resident, and just below the national median of 1.87 playgrounds per 10,000 residents at 1.53. Spending per Resident: $84.82 4 of 20 Points Playgrounds per 10,000 Residents: 1.53 5 of 20 Points In the Access category up to 40 points can be awarded. Lee County earns 1 of 40 points at 12% of unincorporated residents served. This places Lee County below TPL's national sample of 40 cities ( median 57%). Lee County's score is representative of a large county area as opposed to ParkScore's city areas. 1 of 40 Serviced Population 12% The Access category measures the percent of the population living within a half-mile, or about a 10-minute walk, of a park's entrance. The service area is determined by network analysis. Points awarded are based on TPL's national sample of 40 cities, the range is 26 to 97 percent with a median of 57 percent. Access Acreage The Acreage category takes into account the influence of regional parks. Points are based on TPL's national sample, where median park size ranges from 0.6 to 19.9 acres, median 4.9 acres, and park acres as a percentage of city area ranges from 2.3 to 22.8 percent, with a median of 9.1 percent. Median Park Size: 6.3 acres 7 of 20 Points Park Land as Percent of County Area: 4.9% 4 of 20 Points 11 of 40 In the Acreage catagory up to 40 points can be awarded split equally between Median Park Size (20) and Park Lands as Percent of County Area (20). Lee County earns 7 of 20 and 4 of 20, respectively. This places Lee County (6.3 acres) above TPL's median of 4.9 acres median park size. Lee County's 4.9 percent is below the mean of 9.1 percent in the Park Lands as Percent of County Area category.