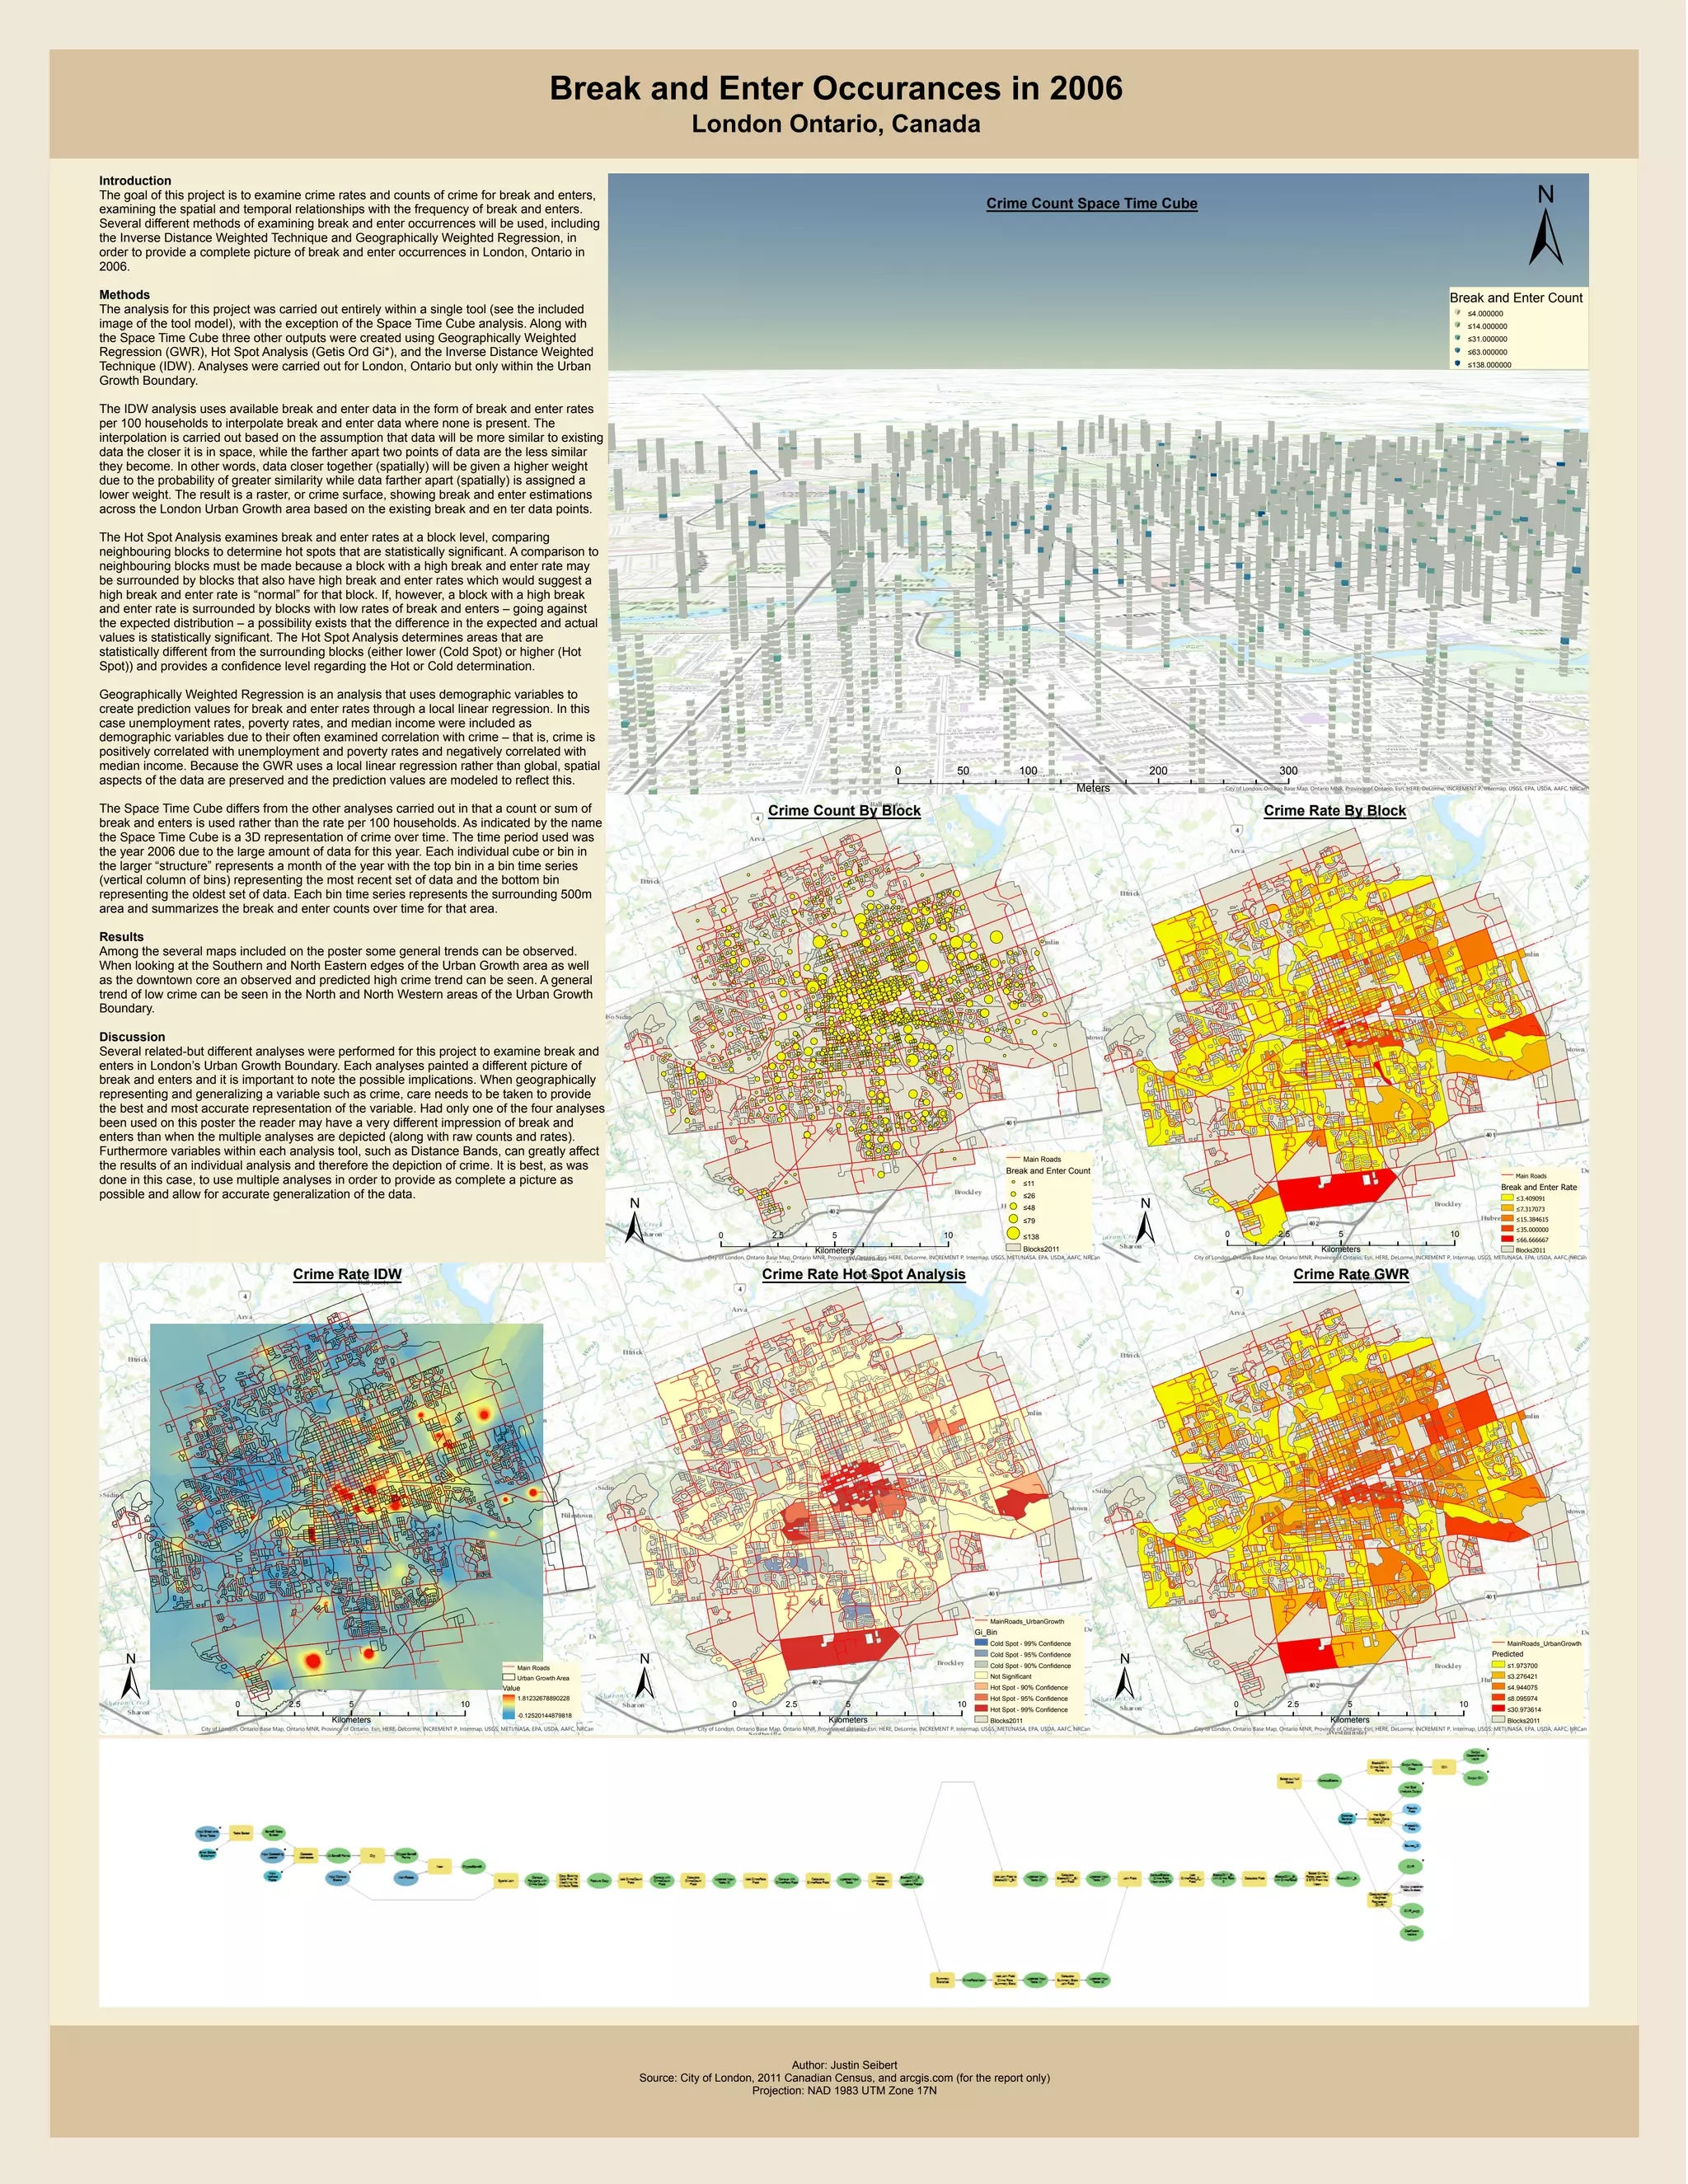
BreakandEnterOccurancesin2006
LondonOntario,Canada
CityofLondon,OntarioBaseMap,OntarioMNR,ProvinceofOntario,Esri,HERE,DeLorme,INCREMENTP,Intermap,USGS,METI/NASA,EPA,USDA,AAFC,NRCanCityofLondon,OntarioBaseMap,OntarioMNR,ProvinceofOntario,Esri,HERE,DeLorme,INCREMENTP,Intermap,USGS,METI/NASA,EPA,USDA,AAFC,NRCan
Author:JustinSeibert
Source:CityofLondon,2011CanadianCensus,andarcgis.com(forthereportonly)
Projection:NAD1983UTMZone17N
CityofLondon,OntarioBaseMap,OntarioMNR,ProvinceofOntario,Esri,HERE,DeLorme,INCREMENTP,Intermap,USGS,METI/NASA,EPA,USDA,AAFC,NRCan CityofLondon,OntarioBaseMap,OntarioMNR,ProvinceofOntario,Esri,HERE,DeLorme,INCREMENTP,Intermap,USGS,METI/NASA,EPA,USDA,AAFC,NRCan CityofLondon,OntarioBaseMap,OntarioMNR,ProvinceofOntario,Esri,HERE,DeLorme,INCREMENTP,Intermap,USGS,METI/NASA,EPA,USDA,AAFC,NRCan
CityofLondon,OntarioBaseMap,OntarioMNR,ProvinceofOntario,Esri,HERE,DeLorme,INCREMENTP,Intermap,USGS,EPA,USDA,AAFC,NRCan
Introduction
Thegoalofthisprojectistoexaminecrimeratesandcountsofcrimeforbreakandenters,
examiningthespatialandtemporalrelationshipswiththefrequencyofbreakandenters.
Severaldifferentmethodsofexaminingbreakandenteroccurrenceswillbeused,including
theInverseDistanceWeightedTechniqueandGeographicallyWeightedRegression,in
ordertoprovideacompletepictureofbreakandenteroccurrencesinLondon,Ontarioin
2006.
Methods
Theanalysisforthisprojectwascarriedoutentirelywithinasingletool(seetheincluded
imageofthetoolmodel),withtheexceptionoftheSpaceTimeCubeanalysis.Alongwith
theSpaceTimeCubethreeotheroutputswerecreatedusingGeographicallyWeighted
Regression(GWR),HotSpotAnalysis(GetisOrdGi*),andtheInverseDistanceWeighted
Technique(IDW).AnalyseswerecarriedoutforLondon,OntariobutonlywithintheUrban
GrowthBoundary.
TheIDWanalysisusesavailablebreakandenterdataintheformofbreakandenterrates
per100householdstointerpolatebreakandenterdatawherenoneispresent.The
interpolationiscarriedoutbasedontheassumptionthatdatawillbemoresimilartoexisting
datathecloseritisinspace,whilethefartheraparttwopointsofdataarethelesssimilar
theybecome.Inotherwords,dataclosertogether(spatially)willbegivenahigherweight
duetotheprobabilityofgreatersimilaritywhiledatafartherapart(spatially)isassigneda
lowerweight.Theresultisaraster,orcrimesurface,showingbreakandenterestimations
acrosstheLondonUrbanGrowthareabasedontheexistingbreakandenterdatapoints.
TheHotSpotAnalysisexaminesbreakandenterratesatablocklevel,comparing
neighbouringblockstodeterminehotspotsthatarestatisticallysignificant.Acomparisonto
neighbouringblocksmustbemadebecauseablockwithahighbreakandenterratemay
besurroundedbyblocksthatalsohavehighbreakandenterrateswhichwouldsuggesta
highbreakandenterrateis“normal”forthatblock.If,however,ablockwithahighbreak
andenterrateissurroundedbyblockswithlowratesofbreakandenters–goingagainst
theexpecteddistribution–apossibilityexiststhatthedifferenceintheexpectedandactual
valuesisstatisticallysignificant.TheHotSpotAnalysisdeterminesareasthatare
statisticallydifferentfromthesurroundingblocks(eitherlower(ColdSpot)orhigher(Hot
Spot))andprovidesaconfidencelevelregardingtheHotorColddetermination.
GeographicallyWeightedRegressionisananalysisthatusesdemographicvariablesto
createpredictionvaluesforbreakandenterratesthroughalocallinearregression.Inthis
caseunemploymentrates,povertyrates,andmedianincomewereincludedas
demographicvariablesduetotheiroftenexaminedcorrelationwithcrime–thatis,crimeis
positivelycorrelatedwithunemploymentandpovertyratesandnegativelycorrelatedwith
medianincome.BecausetheGWRusesalocallinearregressionratherthanglobal,spatial
aspectsofthedataarepreservedandthepredictionvaluesaremodeledtoreflectthis.
TheSpaceTimeCubediffersfromtheotheranalysescarriedoutinthatacountorsumof
breakandentersisusedratherthantherateper100households.Asindicatedbythename
theSpaceTimeCubeisa3Drepresentationofcrimeovertime.Thetimeperiodusedwas
theyear2006duetothelargeamountofdataforthisyear.Eachindividualcubeorbinin
thelarger“structure”representsamonthoftheyearwiththetopbininabintimeseries
(verticalcolumnofbins)representingthemostrecentsetofdataandthebottombin
representingtheoldestsetofdata.Eachbintimeseriesrepresentsthesurrounding500m
areaandsummarizesthebreakandentercountsovertimeforthatarea.
Results
Amongtheseveralmapsincludedonthepostersomegeneraltrendscanbeobserved.
WhenlookingattheSouthernandNorthEasternedgesoftheUrbanGrowthareaaswell
asthedowntowncoreanobservedandpredictedhighcrimetrendcanbeseen.Ageneral
trendoflowcrimecanbeseenintheNorthandNorthWesternareasoftheUrbanGrowth
Boundary.
Discussion
Severalrelated-butdifferentanalyseswereperformedforthisprojecttoexaminebreakand
entersinLondon’sUrbanGrowthBoundary.Eachanalysespaintedadifferentpictureof
breakandentersanditisimportanttonotethepossibleimplications.Whengeographically
representingandgeneralizingavariablesuchascrime,careneedstobetakentoprovide
thebestandmostaccuraterepresentationofthevariable.Hadonlyoneofthefouranalyses
beenusedonthisposterthereadermayhaveaverydifferentimpressionofbreakand
entersthanwhenthemultipleanalysesaredepicted(alongwithrawcountsandrates).
Furthermorevariableswithineachanalysistool,suchasDistanceBands,cangreatlyaffect
theresultsofanindividualanalysisandthereforethedepictionofcrime.Itisbest,aswas
doneinthiscase,tousemultipleanalysesinordertoprovideascompleteapictureas
possibleandallowforaccurategeneralizationofthedata.
BreakandEnterCount
≤4.000000
≤14.000000
≤31.000000
≤63.000000
≤138.000000
0 100 200 30050
Meters
CrimeCountSpaceTimeCube
MainRoads
BreakandEnterCount
≤11
≤26
≤48
≤79
≤138
Blocks2011
0 5 102.5
Kilometers
0 5 102.5
Kilometers
MainRoads
BreakandEnterRate
≤3.409091
≤7.317073
≤15.384615
≤35.000000
≤66.666667
Blocks2011
0 5 102.5
Kilometers
0 5 102.5
Kilometers
0 5 102.5
Kilometers
MainRoads
UrbanGrowthArea
Value
-0.12520144879818
1.81232678890228
MainRoads_UrbanGrowth
Gi_Bin
ColdSpot-99%Confidence
ColdSpot-95%Confidence
ColdSpot-90%Confidence
NotSignificant
HotSpot-90%Confidence
HotSpot-95%Confidence
HotSpot-99%Confidence
Blocks2011
MainRoads_UrbanGrowth
Predicted
≤1.973700
≤3.276421
≤4.944075
≤8.095974
≤30.973614
Blocks2011
CrimeCountByBlock CrimeRateByBlock
CrimeRateIDW CrimeRateHotSpotAnalysis CrimeRateGWR

Layout3