Downloaded 274 times

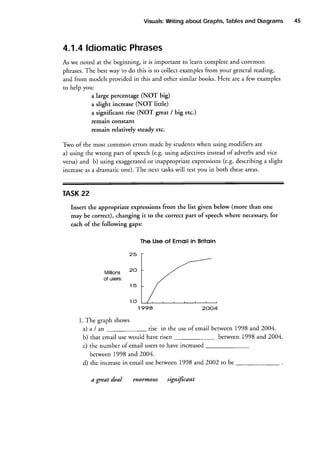
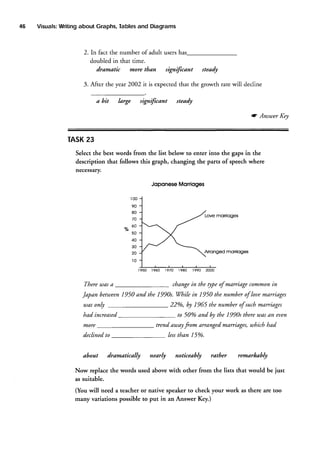
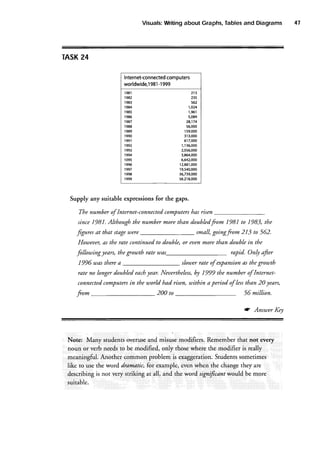
![:::::t;i:r:i::::1::lilr.ii::i:ii:i:l
:::iitirii::::i:::i.,::::rtijti:i:i:;iii
:
)r:tl::t:t:
iti;l:;::;:ritl::;i::::,.,,r :i i
l.lNrl.tl.,i.'.t.
.., .
:':':,::]'],:'] :,,:.!,,:r]]:]|]:'.'.'':
::::r'l
:::l::.,
,,:tt: t t
t:
lli:rll j,,rl:::.
'..
Diagrams
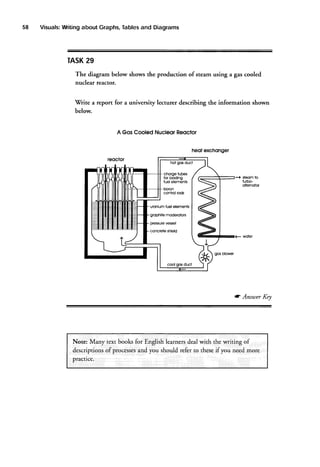
Diagrams occur infrequently in IELfS Academic Writing Task 1, and as there
is very little vocabulary and grammar that coversall rypes of diagrams this
section is very short. It includes three practice taskswith model answers.
The purpose of a diagram is normally to show a process,how a piece of
equipment works, or the operational structure of a system.
5.1Vocabulary
and Grammar
The vocabulary will mostly be closely related to the specialsubject matter
being shown, and so you cannot prepare for that. There are, however, two
of
aspects the languagethat you will require for describing most diagrams and
you should make sure that you know how to use them well:
a) The verbs will normally be in the present tenseand the passiveform.
b) Wherea processor structure is being presented,you will need a variery
or
of connectorsshowing stages time.](https://image.slidesharecdn.com/langmastervisualswritingaboutgraphstablesanddiagrams-140118070715-phpapp01/85/Langmaster-visuals-writing-about-graphs-tables-and-diagrams-59-320.jpg)

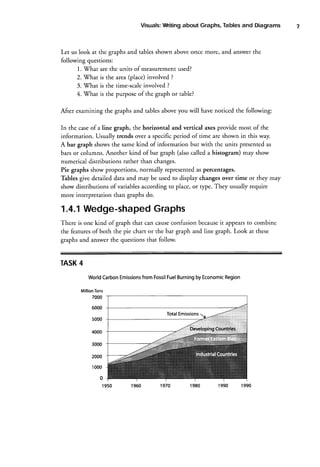
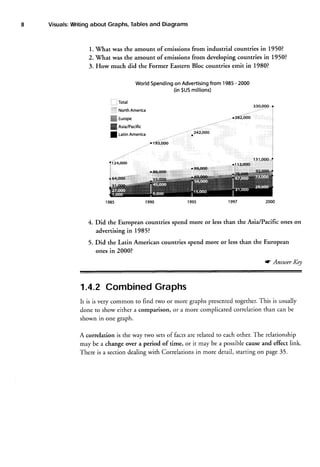
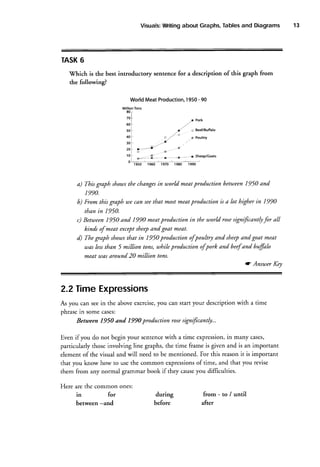
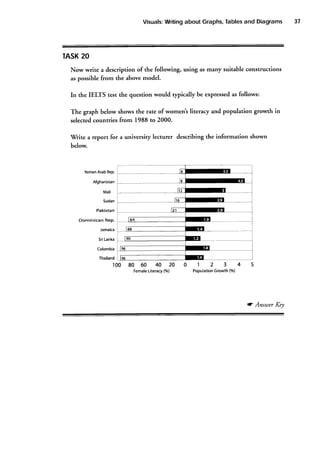
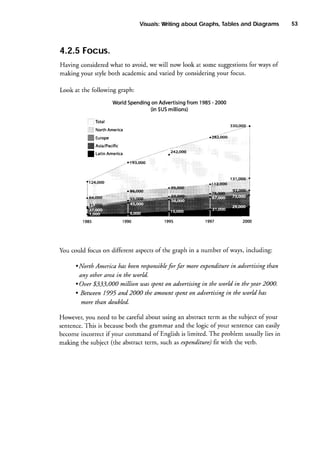
1. The graph does not provide data for industrial countries' emissionsin 1950. The first data point shown is for 1990. 2. The graph does not provide data for developing countries' emissionsin 1950. The first data point shown is for 1990. 3. For the Former Eastern Bloc countries, emissionsin 1980 were approximately 2000 million tons according to the graph. TASK5 Look at the secondgraph on world spendingon advertising. Answer the following questions: 1. How much was spent on advertising worldwide in 1985? 2. How much more was spent in 1995 compared to 1985? 3. Approximately what percentageof total spendingwas on television advertising in 1995?


