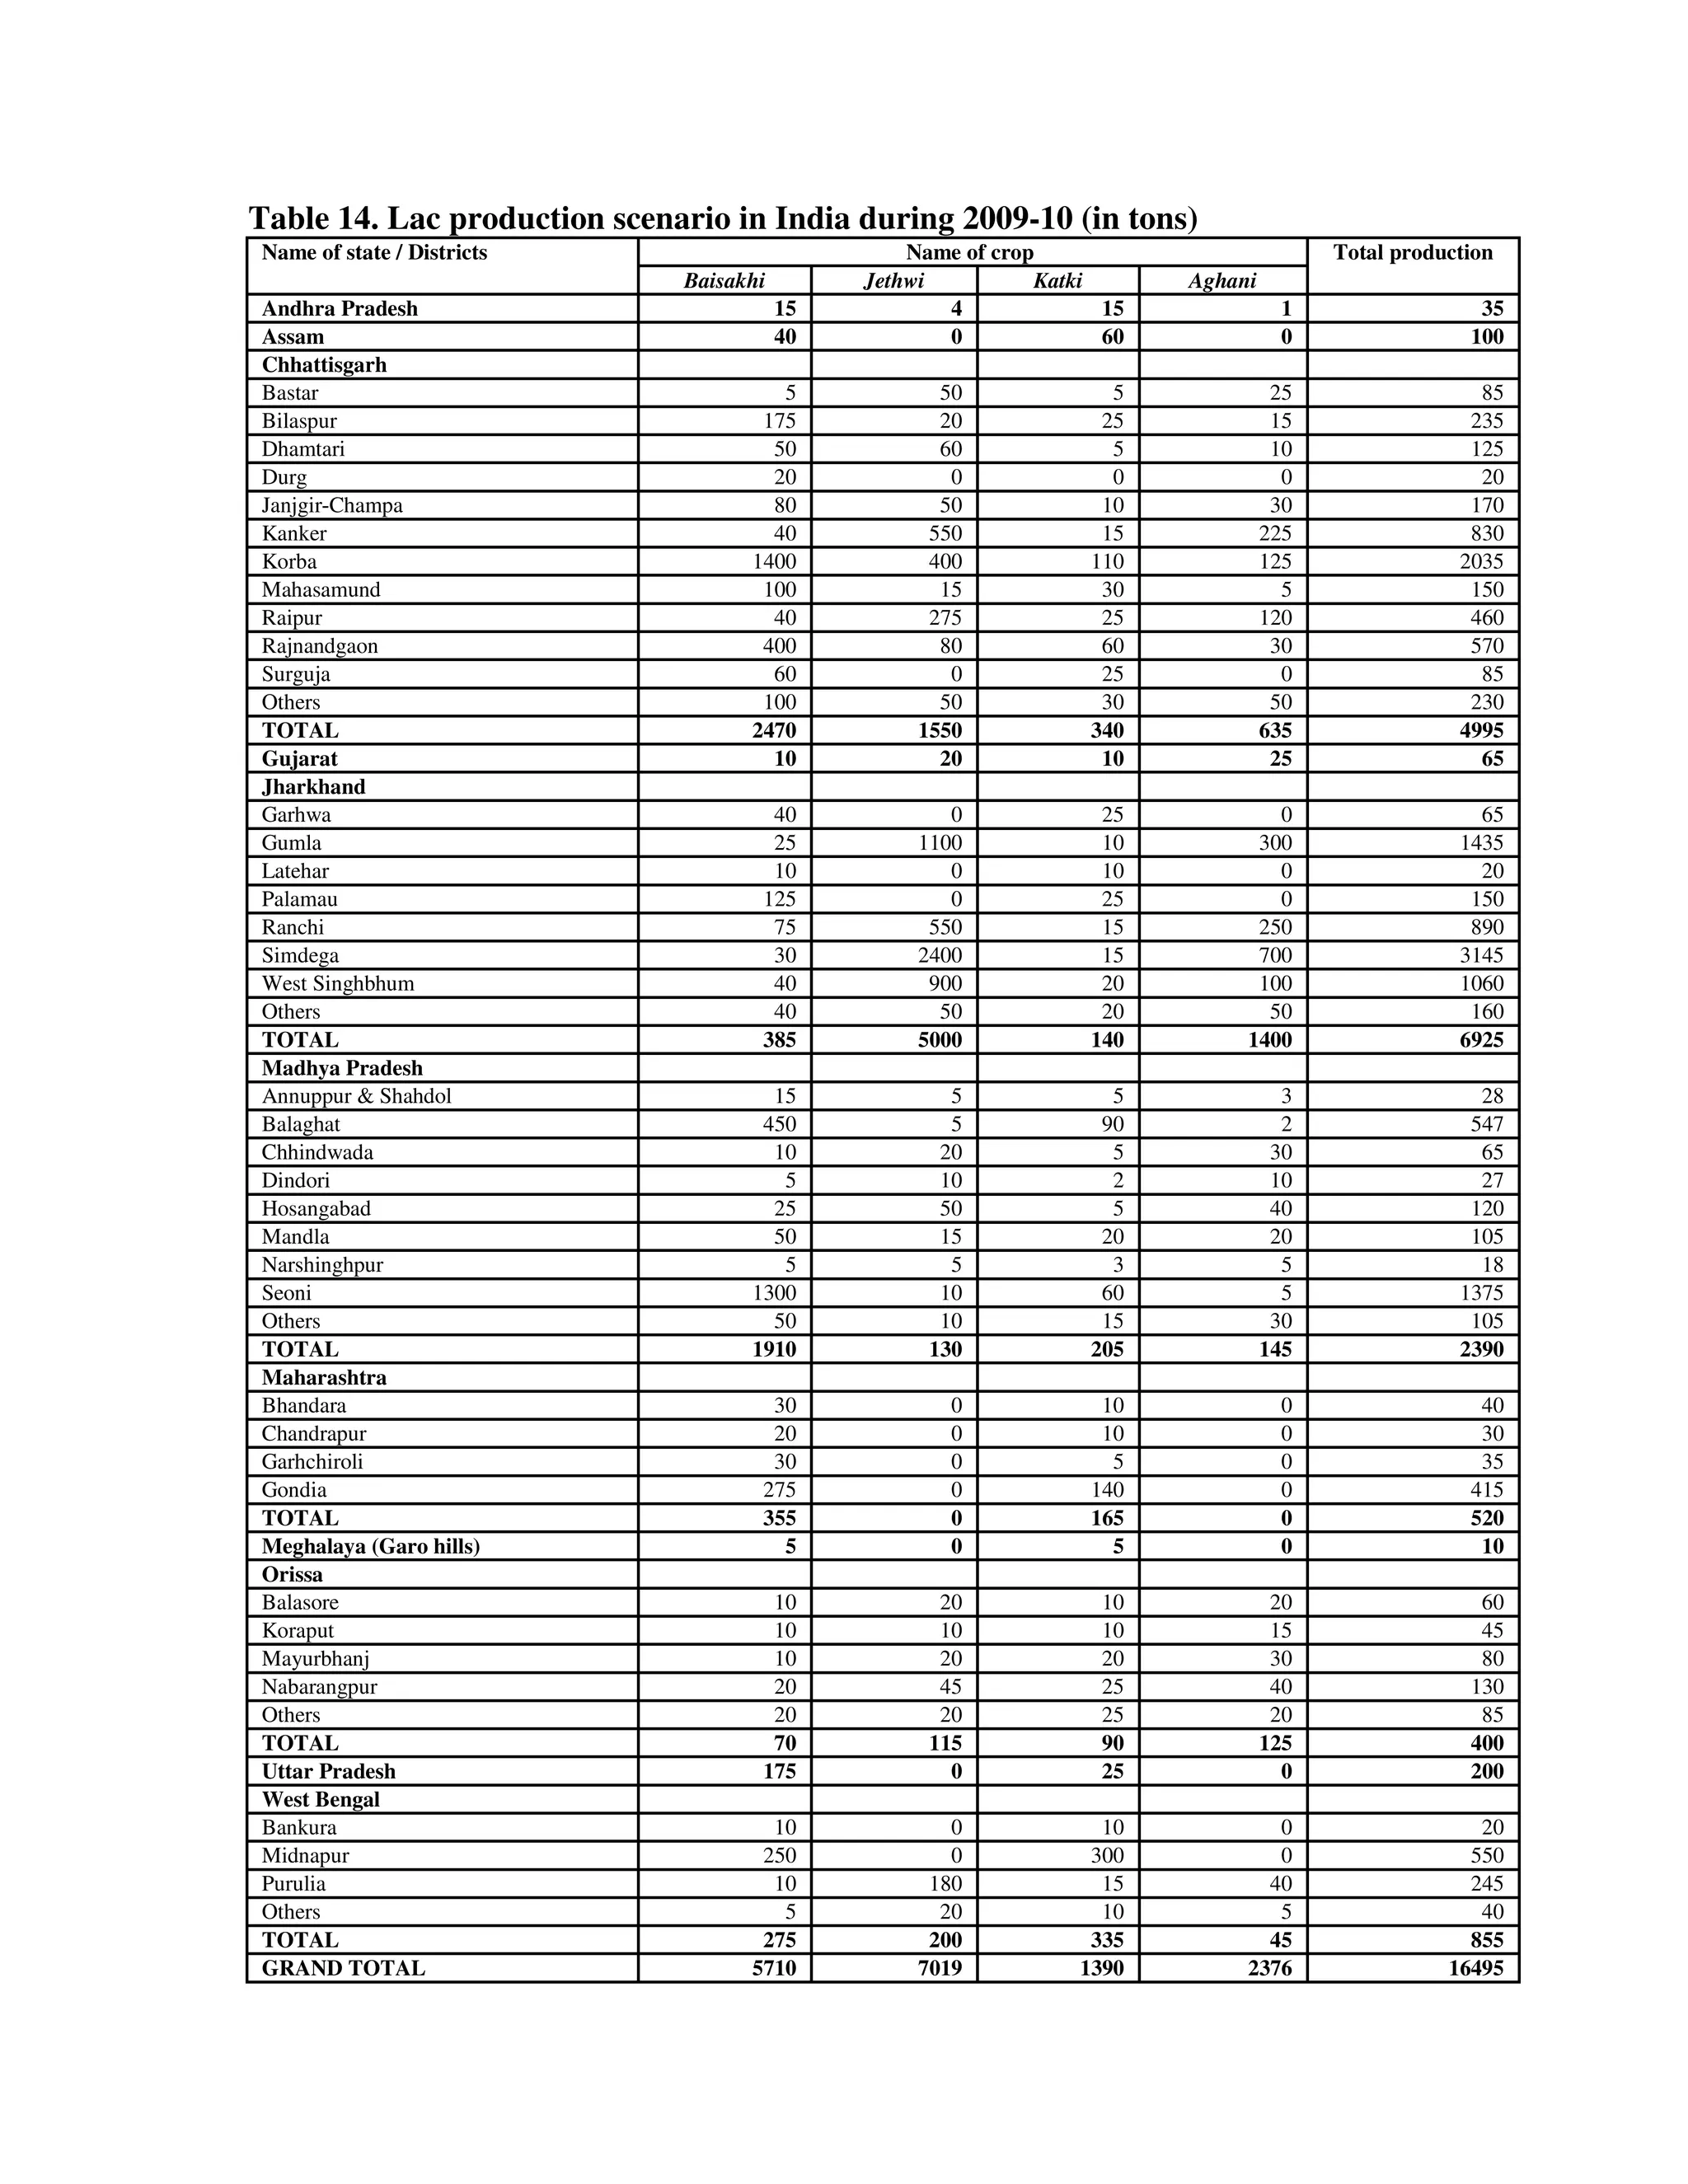
This document provides statistics on lac production in India for the year 2009-2010. Some key points:
- India is the largest producer of lac in the world. Jharkhand is the top producing state, contributing over 40% of national production.
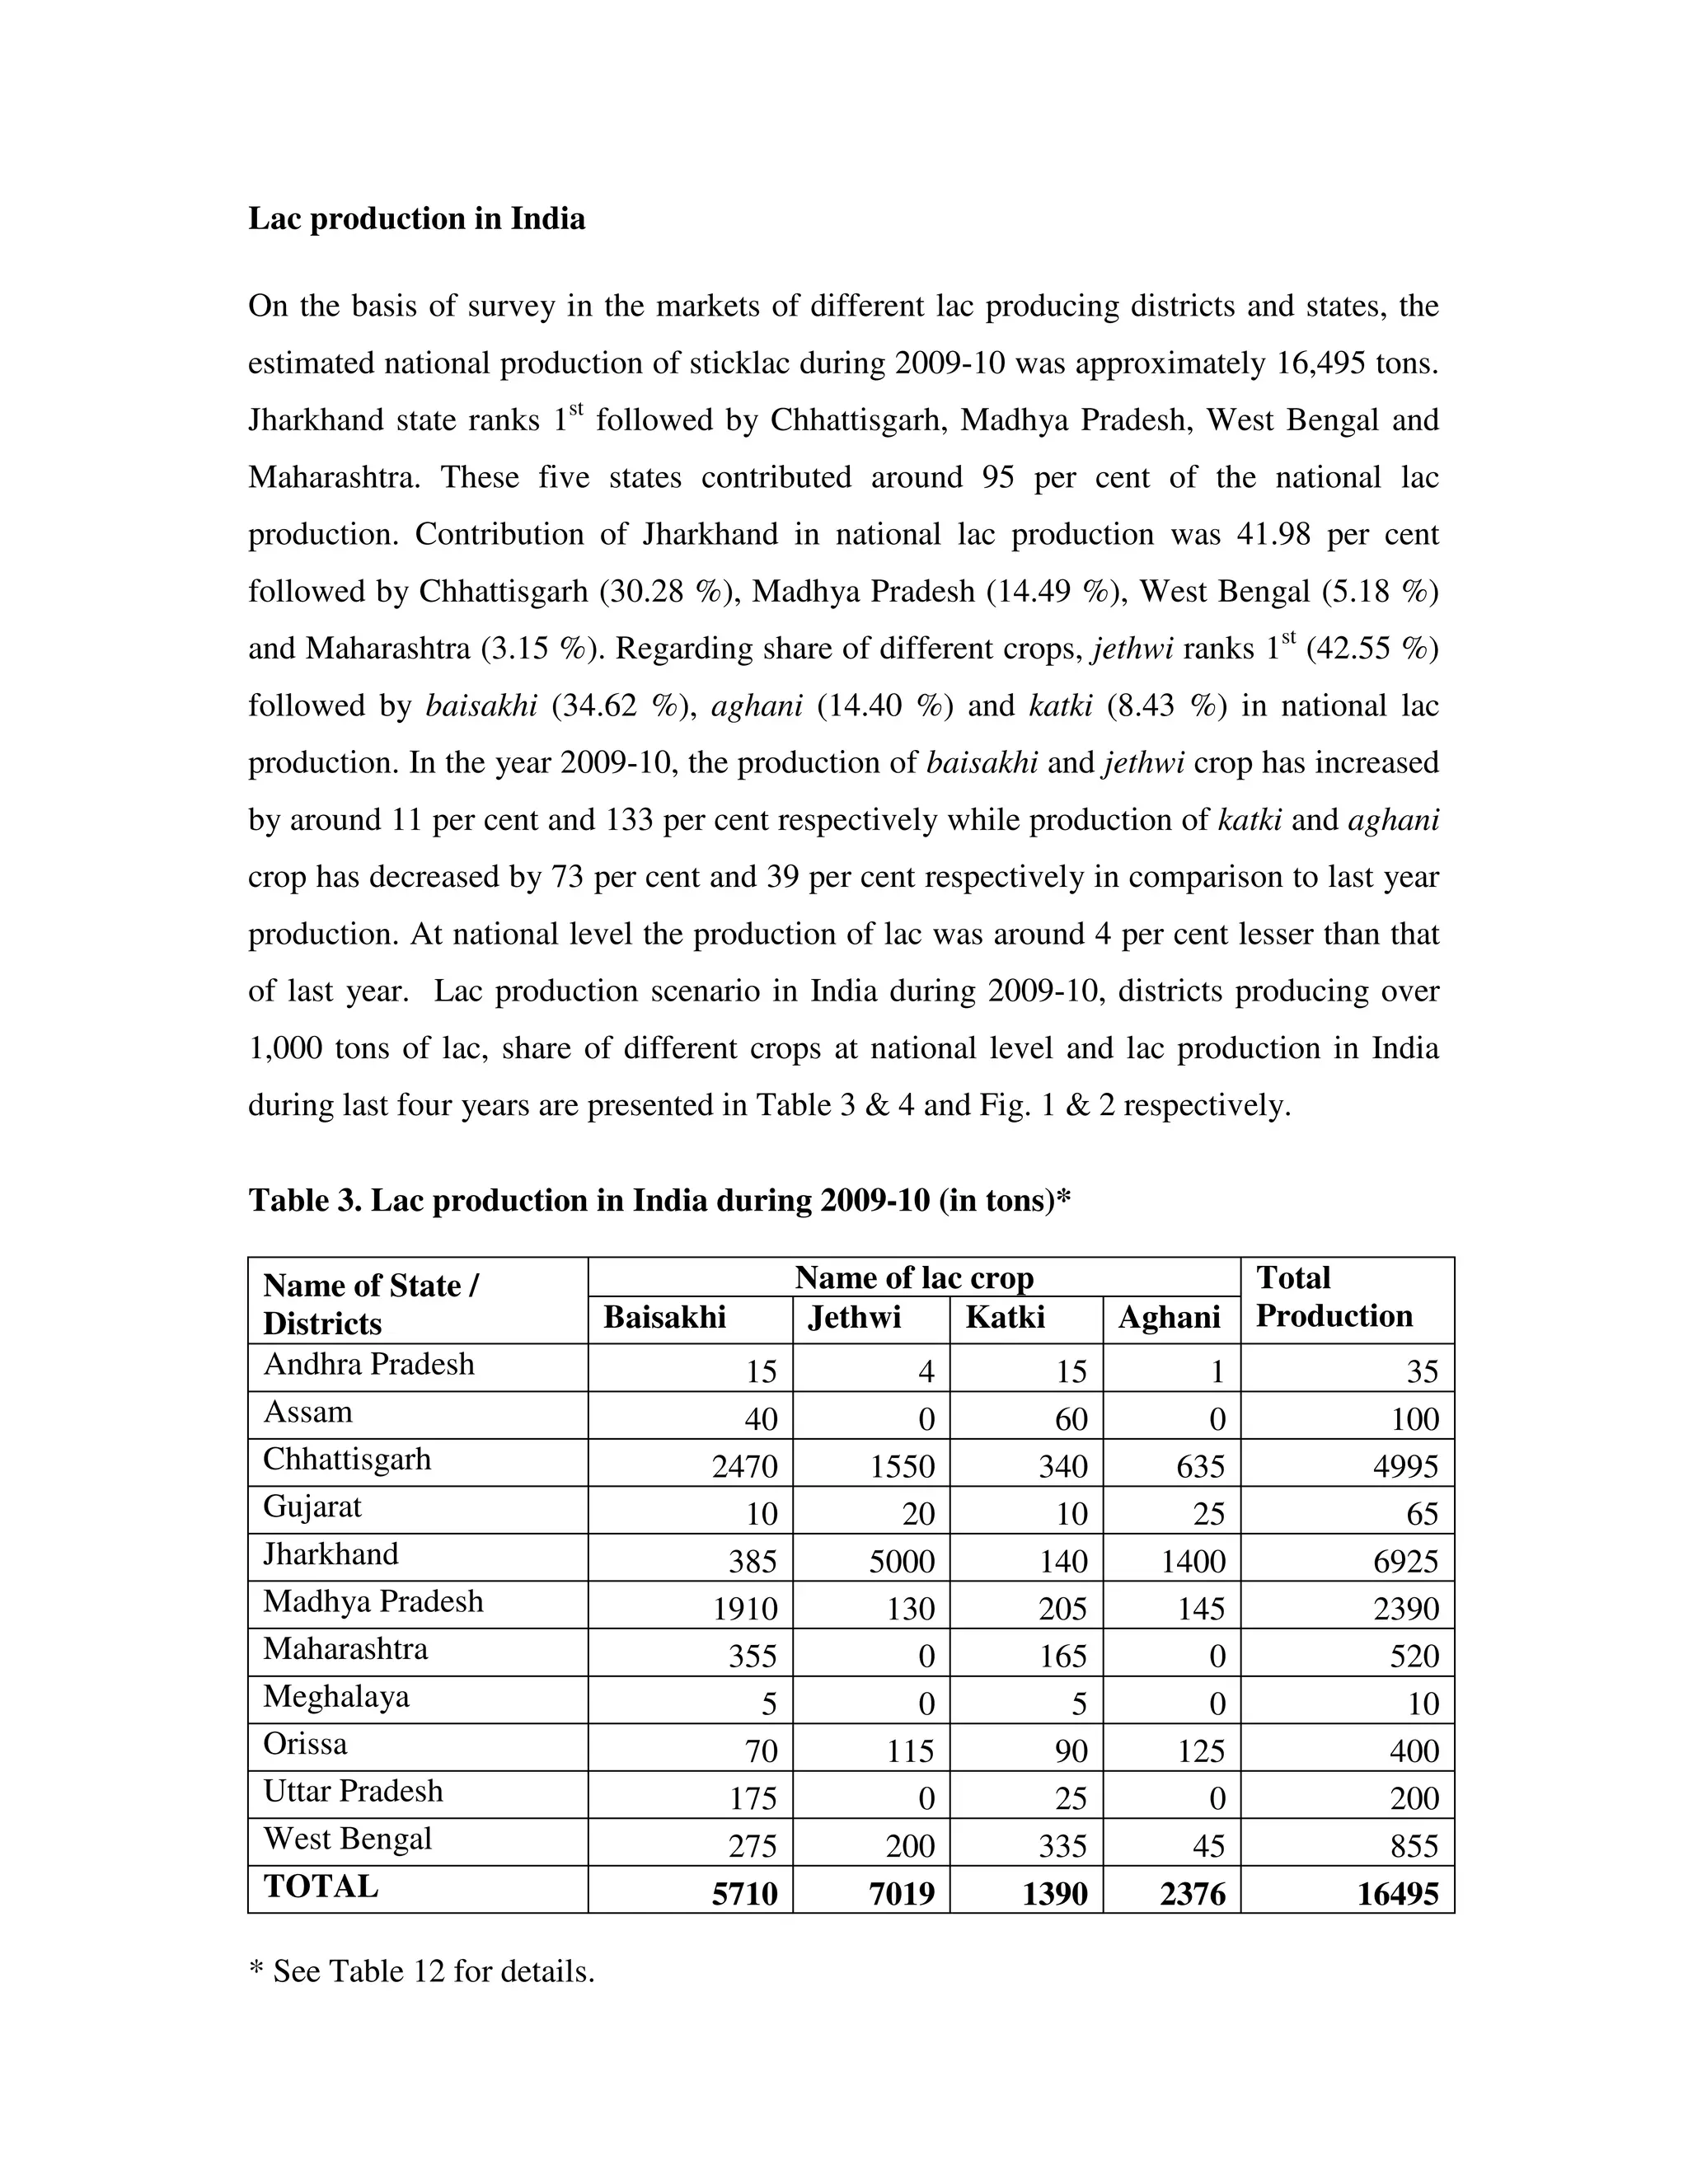
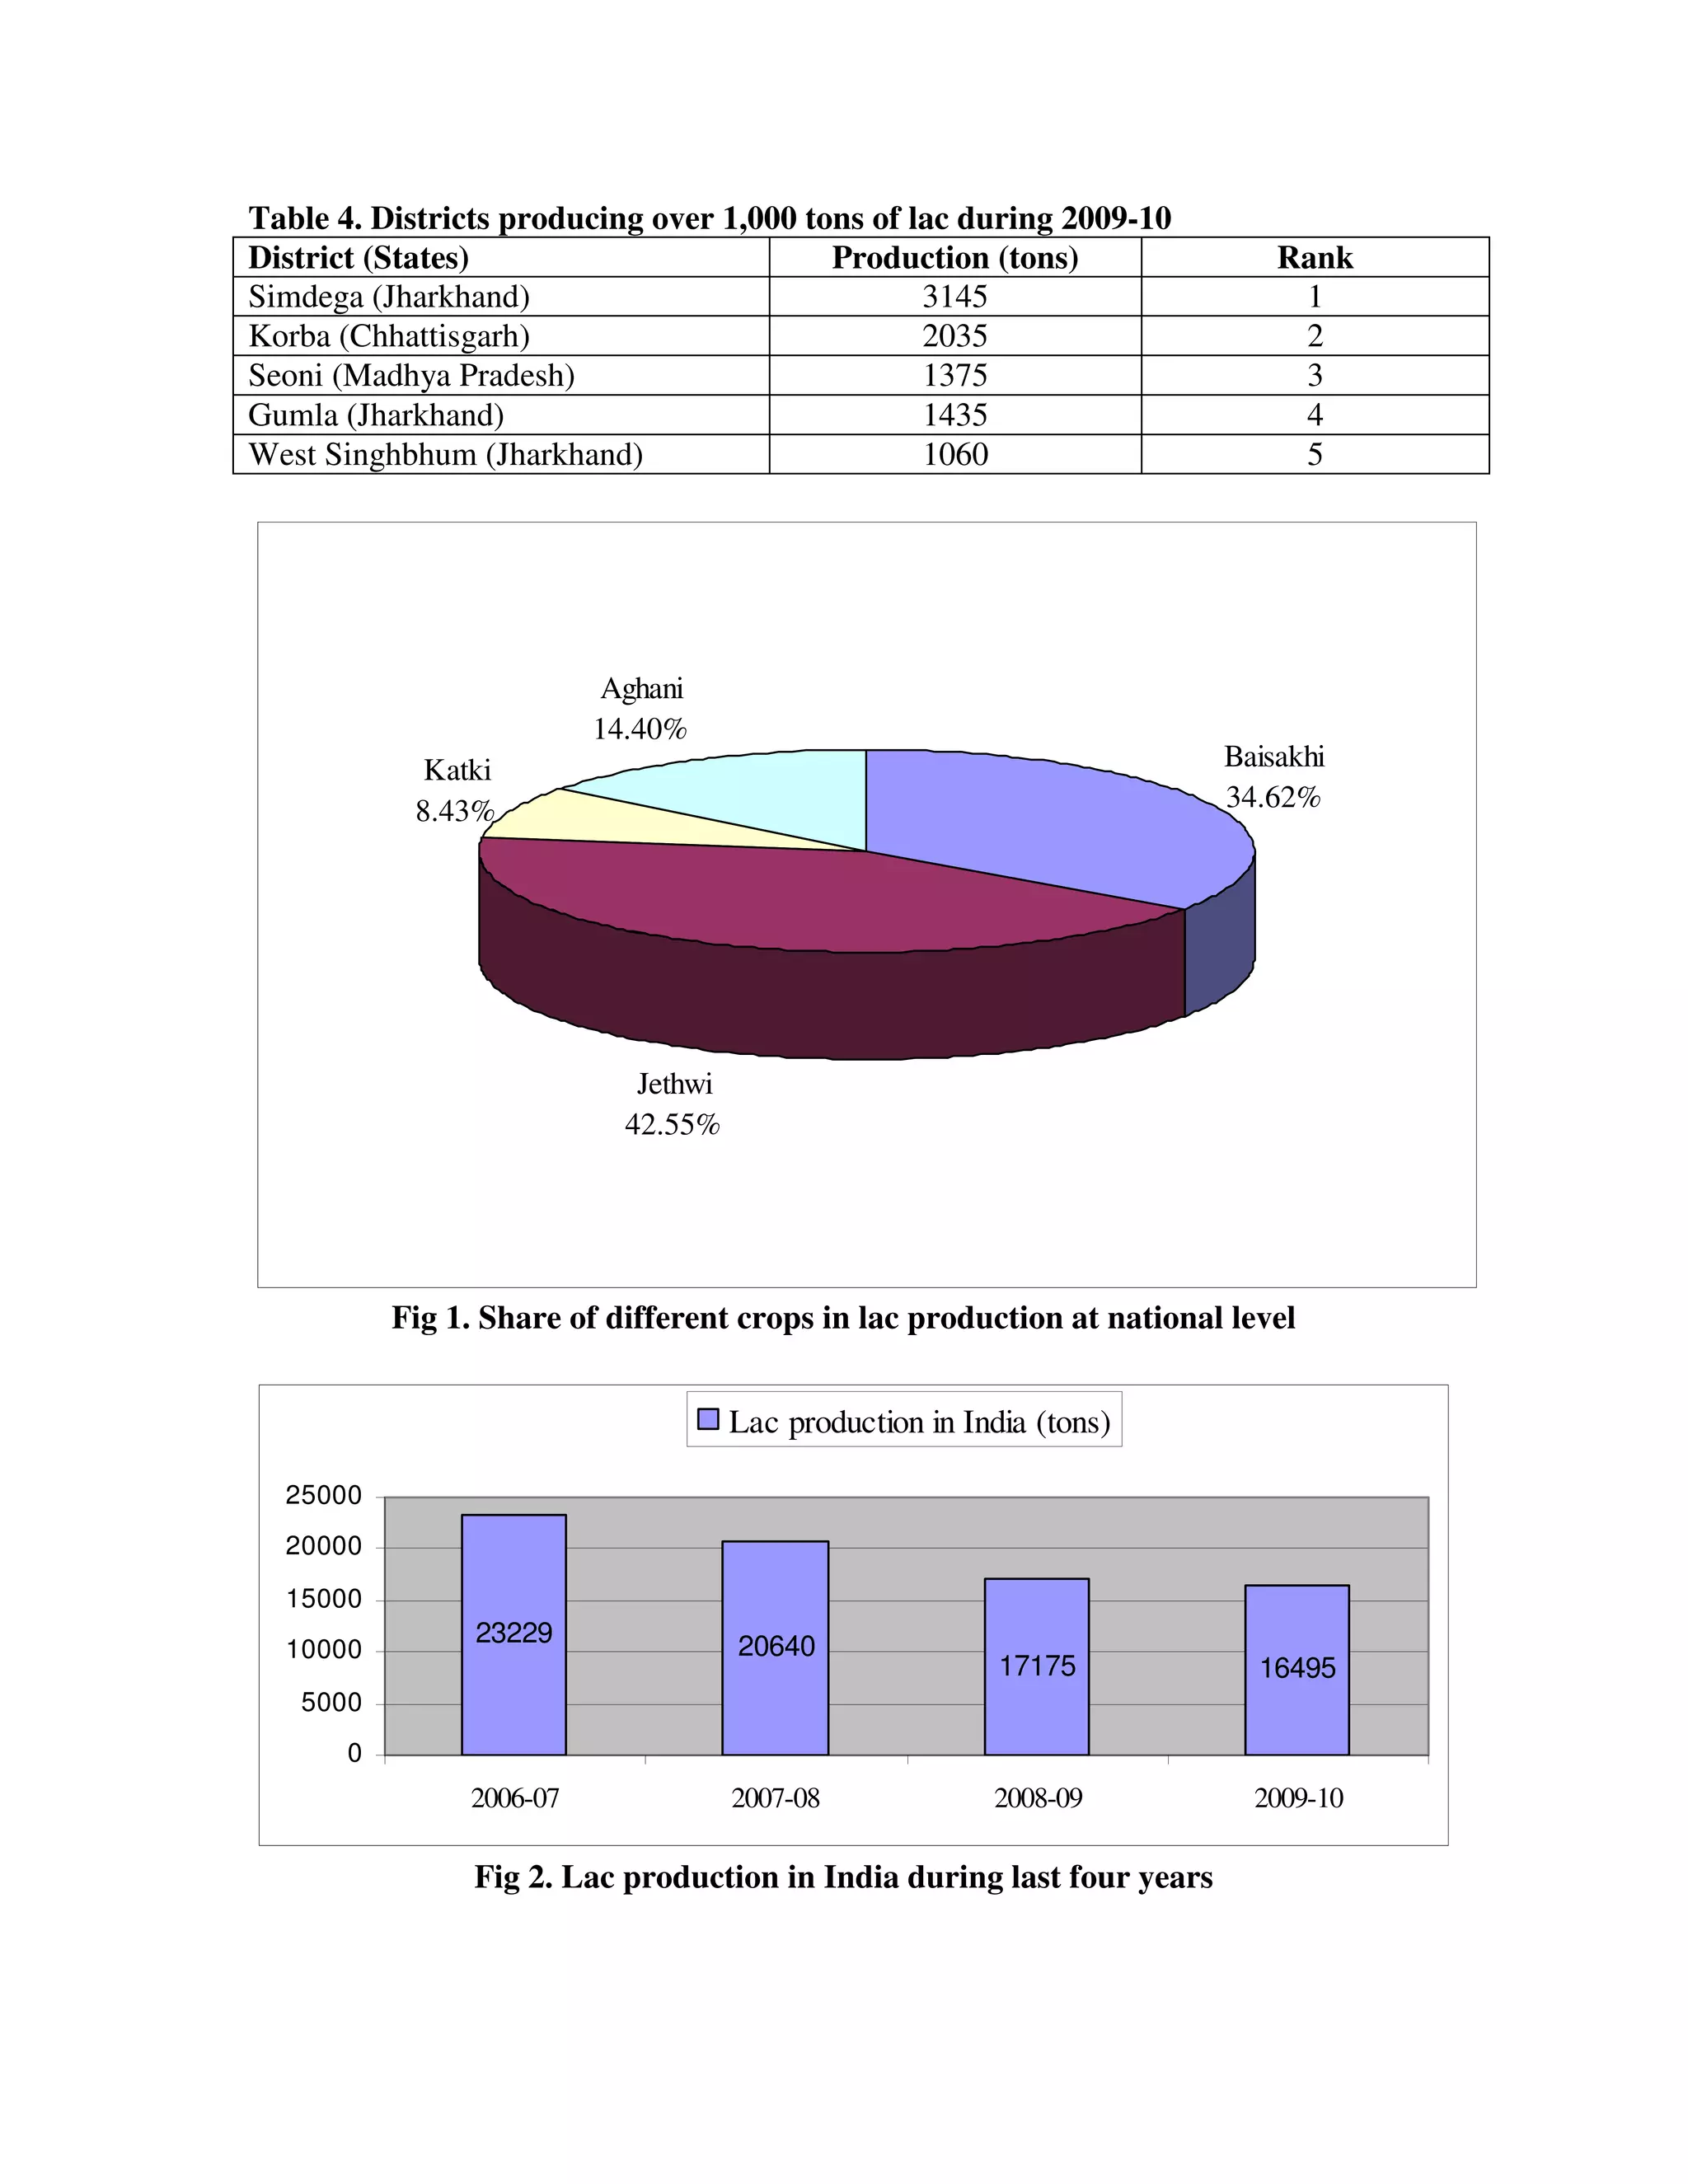
- Total estimated production in 2009-2010 was 16,495 tons, a 4% decrease from the previous year. The top 5 producing states accounted for 95% of production.
- By crop, jethwi was the largest at 42.55% of production, followed by baisakhi, aghani, and katki. Production of baisakhi and jethwi increased while katki and aghani decreased compared