SlideShare a Scribd company logo
1 of 10
Download to read offline
American Research Journal of Humanities Social Science (ARJHSS)R) 2021
ARJHSS Journal www.arjhss.com Page | 82
American Research Journal of Humanities Social Science (ARJHSS)
E-ISSN: 2378-702X
Volume-04, Issue-06, pp-82-91
www.arjhss.com
Research Paper Open Access
Can people with hypertension lose weight through a group
cognitive-behavioral self-control intervention?
Huidobro, E.
; Cuadrado, I. 2
1
Department of Basic Psychology II, National DistanceEducation University; Spain.
2
Department of Psychology and Anthropology, University of Extremadura; España, Spain
Abstract: Objective: to test the efficacy of a cognitive-behavioral self-control program in reducing weight
instage I essential hypertensive patients in primary care. Experimental study of three stages: pre-
intervention,post-intervention and follow-up and three experimental groups with eight subjects each:
intervention 1,intervention 2, differing in program duration, and a control group. Individual plans covering a
balanced diet andphysical exercise were made. Compliance with self-control rules was used with recording in
a daily log.Results:there are no statistically significant differences between the groups, nor with the control
group. In theintervention groups there was significant weight loss between pre- and post-treatment conditions.
In the follow-up, group 2 maintained weight loss, group 1 regained weight, although their weight was still
significantly lowercompared to pre-treatment. In the subjects as a whole, the correlations between logging
compliance with self-control rules and weight loss are statistically significant. The greater the rigor and length
of compliance, thegreater the weight loss. Conclusions: The intervention has been effective in achieving
weight reduction. Studyparticipants who registered greater observance of the self-control rules obtained
greater effectiveness in weightloss. An innovative conclusion is that the longer duration program was more
effective in maintaining weightloss at the follow-up stage.
Keywords - physical activity, self-control, diet, hypertension, cognitive-behavioral intervention, weight loss.
I. INTRODUCTION
Hypertension -or high blood pressure- is a chronic, serious and silent medical condition and one of the
leading causes of premature death worldwide. It is estimated that 1.13 billion people in the world have
hypertension and less than 1 in 5 have it under control1. This can lead to disability, poor quality of life, heart
attack, stroke, kidney failure, blindness, and cognitive decline2.
This lack of control, which results in failure to comply with therapeutic measures, is between 60-90%
for hygiene-dietary measures3.Especially in relation to diet4.
The consumption of salt in the diet contributes to raised blood pressure, as well as the prevalence of
hypertension. More than 70% of dietary sodium comes from the consumption of packaged and prepared foods.
Sodium intake can be reduced by reading the Nutrition Facts label on foods5.
Hypertension requires modification to a) behavioral habits: diet and sedentary lifestyle; b) metabolic
habits: obesity and hyperlipidemia2. To help the chronically ill to modify their habits it is necessary to
promote the self-management of the disease by the patient themself6.
Support groups facilitate educational activities and the incorporation of primary preventive activities such as
physical exercise, weight control and changing health habits7.The medical advice that requires a change in
patients' habits involves delaying or enduring the lack of immediate satisfaction that their habits provide. To
achieve these physician-imposed goals, patients' willpower and their self-control in sustaining the effort must be
strengthened for which they need a support group to back them up 8. Self-control rules make it easier for the
patient to set objectives related to specific habits, promote self-monitoring of harmful habits and influence the
patent's environment, facilitating a more favorable context for achieving the objectives 6.Self-logging
facilitates taking a baseline, rule observance, achievement of goals, evaluation of the intervention and patient
progress. It also provides feedback, since desirable behavior is reinforced by the fact of logging it and presenting
it later to the group with the progress achieved, while undesirable behavior becomes more difficult since logging
it is a reminder of the reasons for not putting that behavior into practice9.
American Research Journal of Humanities Social Science (ARJHSS)R) 2021
ARJHSS Journal www.arjhss.com Page | 83
There are studies on psychosocial and specifically cognitive behavioral interventions in the treatment of
hypertension that support the effectiveness of this type of intervention in lowering blood pressure10, 11,
12, 13, 14, 15.
Excess weight is a risk factor in hypertension and losing weight leads to a significant decrease in blood
pressure16.
Being aware of the efficacy of cognitive behavioral techniques in lowering blood pressure in
hypertensive patients and knowing the importance of weight loss in these patients, we proposed this intervention
to test the efficacy of a cognitive-behavioral self-control program in groups to reduce weight in stage I essential
hypertensive patients. Our contribution to this field is to test whether it is possible through a cognitive
behavioral intervention for hypertensive patients to lose weight, by training them in self-control and intervening
directly in their eating and physical activity habits.
II. RESEARCH METHOD
In this intervention, a group cognitive-behavioral program with self-control rules was implemented. To
achieve this, we worked on two programs: diet and physical exercise, aiming for a balanced, hypocaloric diet
with control over lipid and sodium intake, together with regular physical activity. The sessions were divided into
two parts: informative and behavioral. Based on an analysis of each patient's diet, a specific dietary plan was
developed for each one, following medical recommendations and the patient was helped to follow that plan,
enabling them to plan menus, estimate amounts and the composition of their diet. In addition, an increase in
physical activity was attempted by advising the patient on how to incorporate it into their daily life.
2.1. Design
The intervention was carried out in accordance with an experimental design, including a control group,
and involved data collection (measurements): baseline (pre-treatment), outcome measurement (post-treatment)
and follow-up at six months (follow-up).
The 24 subjects chosen at random were randomly distributed into three groups: two experimental
(intervention 1 and intervention 2) and one control group, with eight subjects each.
The control group did not take part in the cognitive-behavioral self-control program in support groups,
but received increased attention from health personnel, more visits, personal contact, more recommendations,
etc. than before becoming part of the control group, so we cannot refer to them as a group that did not receive
any attention, but rather one that received more conventional attention.
The aim of our intervention was to test the efficacy of a cognitive-behavioral self-control program with
intervention groups to reduce weight in stage I essential hypertensive patients.
The hypotheses were as follows:
Hypothesis 1. Hypertensive patients who receive a group cognitive-behavioral self-control intervention
lose weight, which does not occur in those who do not.
Hypothesis 2. The duration of the intervention influences the results obtained.
Hypothesis 3. The better the subjects' degree of compliance with the self-control rules, the greater the
weight loss.
Hypothesis 4. The greater the number of weeks during which the subjects comply with the self-control
rules, the greater the weight loss.
Variables: the independent variable (IV) studied was the cognitive-behavioral self-control intervention
performed in a group. This is broken down into three aspects: self-control over diet, self-control over physical
activity, the duration of the intervention. The dependent variables (DVs) considered included: weight,
compliance with self-control rules regarding diet and physical activity and weeks of logging behavior.
2.2. Participants
Patients attending three General Medicine clinics in a Primary Care Health Center in the province of
Cáceres, Spain participated in the study. The subjects were selected after studying the databases and medical
records pertaining to a total of 5,372 people using these clinics, of whom 669 were diagnosed as hypertensive.
Of these, 70 had the following characteristics: essential hypertension in STAGE I, without metabolic and/or
mental disorders, overweight, and who appeared to have poor adherence to medical treatment and little control
over their disease. Attempts were made to contact all these subjects, 46 were reached by telephone, and 41 were
invited to a first interview. In addition to having an interview and receiving general information about the
program, they were also presented with the informed consent form, which was signed by 40 once the subjects
had received an explanation regarding the objective of the study, confidentiality, the truthfulness of the
information and the possibility of withdrawing at any time.
Of these subjects, 24 were randomly chosen and randomly distributed into three groups, two
experimental and one control, with eight subjects in each. The mean age of the participants was 62 years, with
age ranges between 34 and 73 years. In total, 16.7% were men and 83.3% women.
American Research Journal of Humanities Social Science (ARJHSS)R) 2021
ARJHSS Journal www.arjhss.com Page | 84
2.3. Research Instruments
The instruments and materials used included:
a) Self-reporting logs.
b) Diet calculation and menu planning protocols.
c) Food exchange lists.
d) Printed and in-kind support material (spice jars).
e) Scales
2.4. Process
In the intervention, three distinct periods were defined:
Period I, the selection and commitment to participate by the participating professionals, three nurses,
three doctors and one pharmacist, who received specific training relating to the intervention, which was
coordinated and directed by a psychologist. After studying the history and selecting the subjects, three face-to-
face interviews were carried out, baseline measurements were then taken over a two-week period, with self-
logging of weight, diet and physical activity. The composition of the diet, kilocalories, active ingredients in
percentages of proteins, carbohydrates and fat were analyzed. The conclusions regarding their diet and physical
activity, which was also analyzed, were explained to each patient, and a date for beginning the group sessions
was scheduled.
Period II, the intervention itself began with the sessions, two groups were formed in order to have a
smaller number of subjects in each one, since the active participation of all members was sought. The groups
were both led by the same therapist, a psychologist, with the same content, the same procedure, although the
groups were not held simultaneously, with one following the other. In addition, in order to assess whether the
duration of the intervention had any effect on its effectiveness, the length of time the intervention lasted for the
two groups was different, the Intervention 1 Group had eleven sessions with an approximate frequency of one a
week for fourteen weeks, the Intervention 2 Group had 15 sessions for 21 weeks, one a week (approximately)
for the first 11 weeks and then one every fortnight. At the end of this period, post-treatment measurements were
taken.
Period III, six months after the end of the intervention and the post-treatment measurements being
taken, the last group session was convened for a reminder and a personal interview, in which the last logs were
collected and follow-up measurements taken.
2.4.1. The groups: Two groups were established to encourage the participation of all the members, each
comprised the coordinator and the eight subjects in each intervention group. Sitting in a circle, the coordinator
sought to ensure everyone participated equitably. In the group, there was an increase in personal capacity as
users shared their daily findings which helped others, for example, with where to find low sodium foods. The
failure to achieve goals was shared and the subject felt supported by the others, successes were reinforced by
everyone and became achievements to be imitated by the others. For example, the person who achieved the
greatest weight loss in a week was applauded by the others. Healthy habits were encouraged, for example, they
described the walking routes with information on distance and difficulty.
2.4.2. The sessions: Each session featured two parts, an informative part and a behavioral one that ended with
sharing.The former lasted about 20 minutes and the latter about 40 minutes. A very important part of the
sessions, which was highly appreciated by the subjects, was the sharing, in which everyone talked about their
problems, concerns and achievements. For example, the subjects weighed themselves every day, calculated their
weekly average and this data was entered in each session on their personal graph on which the weight lost was
very clearly seen, this was shared with others during the sharing, reinforcing achievements and giving an
incentive to all the group members.
2.4.2.1. In the informative, educational part, explanations were given regarding hypertension, obesity, diet, food,
its immediate principles, healthy nutrition, sodium content, prohibited foods, processed foods, water intake, salt,
alternatives for seasoning, sedentary lifestyle, physical activity, benefits, classes and safety standards. The
explanations were accompanied by printed informative material.
2.4.2.2.In the behavioral part, the guidelines to be followed were given for the proper functioning of the group
that were always reinforced with explanatory posters. The implementation of the diet and physical exercise
plans and self-control were worked on.
2.4.2.2.1.To implement the diet plans we relied on the guidelines from the American Dietetic Association 17,
with a diet composition of: 30% fat, 22% proteins and 48% carbohydrates; the dietary monitoring was based on
interchangeable choices that the subject made regarding their food:
Six food exchange lists were explained and distributed, 1: milk, 2: vegetables, 3: fruit, 4:
carbohydrates, 5: meat, 6: fats. Each list included: composition of the food, information on what each choice on
the list provides, grams of carbohydrates, proteins, fat and kilocalories, in addition to what that food provides in
terms of vitamins, minerals and how it can be used. For example, on list 1: a choice of skimmed milk
American Research Journal of Humanities Social Science (ARJHSS)R) 2021
ARJHSS Journal www.arjhss.com Page | 85
corresponds to 1 cup and contains 12 grams of carbohydrates, 8 grams of protein, very little fat and 80 kcal. List
2, a choice of vegetables corresponds to ½ cup and contains 5 grams of carbohydrates, 2 grams of protein and 25
kcal. List 3, a choice contains 10 grams of carbohydrates and 40 kcal. List 4, a choice contains 15 grams of
carbohydrates, 2 grams of protein and 70 kcal. List 5 depends on the type of meat, in the case of lean meat each
amount of 30 grams contains 7 grams of protein, 3 grams of fat and 55 kcal. List 6, each choice contains 5
grams of fat and 45 kcal. The most common foods that correspond to each category were also listed with the
amount corresponding to each choice, for example, a cup (we used the US measure 236.5 ml or cm³). For
example, in list 3, fruit, 2 medium-sized fresh apricots correspond to a choice.
To establish the diet plan, which was planned based on the food exchange lists and taking into account
the subject's preferences, we started by estimating the weight that the subject should have, using the Lorentz
formula, which allowed us to calculate the theoretical ideal weight (IW) based on height and sex: Lorentz
Formula (LF): IWLF= (height [cm] – 100)–((height [cm]-150)/K). In men k=4, in women k=2.5. Normal caloric
needs were calculated = ideal weight (kg) x 30. For example, for a woman whose ideal weight is 65 kg. This
would be: 65 x 30 = 1950 kcal. In our case, the subjects performed moderate physical activity; if they had had a
high energy expenditure due to work or sport, their energy needs would have been increased. Since the subjects
had to lose weight, the calorie expenditure had to be lower than the maintenance energy expenditure, it was
reduced by 500 kcal: daily kcal = caloric needs – 500 kcal. In our example 1950 kcal – 500 kcal = 1450 kcal.
In order to have objective information about each participant's daily intake, each participant brought
their own domestic crockery, plates, serving spoon, etc. to one of the sessions, and a comparison was made with
measuring spoons and jugs (reference measures in the United States), in order to make them aware of the
amounts they ate. They also brought in the amount of bread they ate daily and weighed it on a scale.
During the sessions, the patients were trained to use the lists, plan their menu to fit the prescribed diet
composition, make choices and add up the calories to achieve their target weight. To achieve a low-sodium diet,
the consumption of spices as a substitute for salt was encouraged, a basket with spices was given to each patient
with suggestions on how to use them. Instructions were also given regarding buying, reading labels, storing and
what to do in situations when it is difficult to follow the diet.
Each subject had personalized menu planning sheets, indicating: the permitted kilocalories, with six
columns corresponding to the food lists with the permitted choices for each column that could be distributed in
four intakes a day, breakfast, lunch, snack and dinner.
2.4.2.2.2.For the physical activity we started from the information collected in the self-logging of activity that
was carried out on two different days, one on a Sunday and the other on a working day. In these, the subjects
logged all the activities undertaken during the day with the start and end time. The sessions explained the
recommended exercises for people with hypertension, the possible exercises they could do with the
corresponding energy expenditure and how to do the exercises safely. Work was undertaken on integrating the
exercises into daily life, seeking to take advantage of every opportunity to move around, for example, instead of
taking the elevator, climbing stairs.
2.4.2.3.Self-control was developed through behavioral rules, really "homework", which was either proposed in
the program or elaborated by the subjects themselves, and this involved the observation of their own behavior,
encouraging self-vigilance and helping them to comply. The purpose was to facilitate changing habits that are
harmful to health. The subjects carried out daily self-logging in relation to the degree of compliance with the
rules and this was grouped around five habits to work on: the quantity of food, the quality of the food, the
physical activity carried out, the environment surrounding the meal and the act of eating itself. As an example of
latter type of rule: "I leave the fork on the plate between mouthfuls".
III. DATA ANALYSIS
The evaluation during the intervention included baseline, post-treatment and follow-up measurements
on the one hand, and measurements during the treatment on the other.
The self-logged measurements made during the treatment included: weight; diet composition and amount; and
self-assessment of adherence to self-control rules including physical activity. The subjects could choose several
rules from each of the 5 types or only from some of the types. The self-logging was undertaken weekly,
delivered and collected in each session and completed with a daily self-evaluation of the degree to which they
have observed the rules chosen by them, with precise indications:
“Evaluate each night the extent to which you have observed the self-control rules you have chosen”:
Use the following grading: Today I have fulfilled the rule: + fully, (+) pretty well, (-) Not too well, – I didn't
follow the rule.
Next, there was a table with eight columns and six rows (more could be added if the subject chose more
than six rules). The first, very wide, column was to write, in each row, the chosen rule; the next seven columns
corresponded to each day of the week, and they were used to log the assessment by the subject in accordance
with the explained grading.
American Research Journal of Humanities Social Science (ARJHSS)R) 2021
ARJHSS Journal www.arjhss.com Page | 86
The data was analyzed using Statical Package for Social Sciences (SPSS) version 25. The central
tendencies and dispersion were calculated to determine the sample's characteristics.
The study variables present symmetry and a kurtosis similar to normal, so we applied parametric tests. In
addition, the Shapiro-Wilk test was applied to guarantee this compliance, with p-values greater than 0.05
calculated, and therefore parametric tests were performed.
The tests used were the Student's T-test to evaluate the differences between pre and post; between pre and
follow-up; and between post and follow-up. These comparisons were made for the weight variable.
To analyze the differences between the three measurement stages, pre, post and follow-up, a global
repeated measures Anova test was applied with the F-test. Pearson's correlation was applied to analyze
correlations between variables.
All our tests have a partially repeated measures design, with an intrasubject factor, which is the
measurement at three different times for each subject. And also, an intergroup factor, which is the type of group
(with three levels: control, intervention 1 and intervention).
In the F-test, the assumed hypothesis was that there are no differences between the three groups,
therefore, a p-value of less than 0.05 implies that there are differences. Subsequently, two-by-two comparisons
were made for each group separately, to evaluate between which of the three moments there are differences.
Simple dispersion with pre-post variance line adjustment and R2 was calculated to provide information
on the relationship between the dependent variable weight loss and the dependent variables rule completion and
weeks of logging.
IV. RESULTS
Significant differences in the weight of the subjects were found in our study. This difference is seen in
both intervention groups, however, there is no such variation in the control group, which confirms our
hypothesis 1. The hypertensive patients who received a cognitive-behavioral self-control intervention including
support groups lost weight, which did not occur in those who did not.
Statistically significant differences were observed in the intervention groups (p<0.001), while no
significant differences were observed in the control group(p>0.05).
In none of the cases were there statistically significant differences between the three groups.
In some fields, R2
values are expected to be low. For example, any discipline that attempts to predict
human behavior, such as psychology, usually has R2
values under 50%. Human beings are simply more difficult
to predict than, for example, physical processes. In addition, if the R2
value is low, but there are statistically
significant predictors, it is still possible to draw important conclusions about the association between changes in
predictor values and changes in response value18.
In this experiment we have to point out that the variables have a relatively small range of variation, as
they are biological variables their margin of variation is never large, for example, one of the patients who
weighed 86 kilos, lost 7 kilos during the intervention, which is a clinically significant value in their case, but the
range of variation is only 8%. This limited potential for variation contributes to the fact that the values are not
statistically significant when comparing the intervention groups with the control group, although they do
indicate that the intervention has clinical efficacy.
Figure 1. Weight evolution
American Research Journal of Humanities Social Science (ARJHSS)R) 2021
ARJHSS Journal www.arjhss.com Page | 87
Table 1. Comparison between stages
Fig 1 and Table 1 demonstrate that the groups' results are different, presenting a pattern in which the
intervention groups show an improvement,while the control group remains constant. However, statistically this
difference is not sufficient to state that it is significant. It seems logical to assume that, by increasing the sample
size, or incorporating a control variable, these differences will be significant, as can be seen very clearly in these
figure and table.
We have found intragroup differences, that is, when evaluating each group separately, over the three
time points, we found significant differences over time in the intervention groups.
In the control group, as was expected, there were no significant differences between Pre-Post, Pre-
Follow-up, or Post-Follow-up, see Fig. 1 and Table 1
In the Intervention 1 Group, there are significant differences between the three comparisons. In the pre-
post comparison, we have an average for the pre of 77.85, which reduced to 72.75 in the post. In the case of the
difference between pre and follow-up, which is also significant, we see that the averages go from 77.85 in the
pre to 74.4125, that is, it is lower, but there is not as great a difference with respect to the Pre-Post findings.
In the Intervention 2 Group we have differences in Pre-Post and Pre-Follow-up, but not between Post
and Follow-up. This indicates that the effect of intervention 2 is maintained up until the follow-up
measurements. Between Pre-Post we see that the average goes from an initial value of 75.35 down to 70.25. The
same occurs for the difference between Pre and Follow-up, where we went from the initial 75.35 to 70.0605,
which is even lower than the post measurement.
Graphically, Fig.1 shows that initially we have more or less equivalent groups, with a higher mean for
the Intervention 1 Group and a very similar mean for the others. In the post measurements, it can be clearly
observed that the control group remains stable with virtually no changes, but the other two have decreased
significantly. Moving on to the follow-up, in intervention 1 (which is the shortest duration of the intervention)
this effect is diluted, however, in intervention 2 the effect of the decrease is maintained.
Figure 2. Weighted score in rule log weeks
Group T gl P-value
Pre Post -0,165 7 0,873
Pre Follow-up -0,638 7 0,543
Post Follow-up -0,801 7 0,45
Pre Post 6,947 7 0,0000
Pre Follow-up 4,292 7 0,004
Post Follow-up -2,974 7 0,021
Pre Post 6,859 7 0,0000
Pre Follow-up 3,807 7 0,007
Post Follow-up 0,161 7 0,877
Weight in kilos
CONTROL
1 Intervention
2 Intervention
Variable Comparison at times
COMPARISON STAGES
(Pre-Post-Follow-up)
Measurement stage
y = 4,7423x + 0,3548
R² = 0,249
0,00
1,00
2,00
3,00
4,00
5,00
6,00
7,00
8,00
9,00
0,00 0,20 0,40 0,60 0,80 1,00 1,20 1,40
Lost
weight
Weighted score in total rule log weeks
American Research Journal of Humanities Social Science (ARJHSS)R) 2021
ARJHSS Journal www.arjhss.com Page | 88
Figure 3. Degree to which the subject complied with all the rules
Figure 4. Degree to which the subject complied for physical activity.
Figure 5. Degree to which the subject complied for physical activity.
Data for all the subjects in the two groups, intervention 1 and intervention 2, n=16, are presented in Fig.
2, 3, 4 and 5. The blue points are the scores obtained by each subject, we calculated the correlations and R2
to
find out whether there is a relationship between the weight loss DV and the other DVs.
The scores for each subject were obtained as follows: To assess compliance with the self-control rules,
several steps were followed: A value was given to the evaluations made by the subjects: + totally: 1 point, (+)
fairly well: 0.67 points, (–) not very well: 0.33 points, - I have not followed the rule: 0 points. For each subject,
the sum of all the values for each rule was calculated, giving a subtotal. For the types of rules used by the
subject (maximum five) we added together the corresponding subtotals. The result of this sum was divided by
the number of types of rules chosen by the subject, which gives the average for each subject's rating, this is the
Subjective Compliance Index for each subject for all the rules.
American Research Journal of Humanities Social Science (ARJHSS)R) 2021
ARJHSS Journal www.arjhss.com Page | 89
In order to evaluate the number of weeks that the subjects have completed the logs, we added the
number of weeks each subject completed the logs, we took the group mean and divided the score for each
subject by this average which gives us the weighted score in total rule log weeks. Fig. 2
In order to obtain an overall score for each subject that takes into account rule completion and log
weeks, we multiplied each subject's subjective compliance index score by the weighted score in rule log weeks.
The group mean was calculated. The score for each subject was divided by the group mean and this gives us the
weighted score of each subject for rule compliance, which is thedegree to which the subject complied with all
the rules. Fig. 3
The weighted score in weeksdegree to which the subject complied for physical activity, Fig.4, and
weighted score in activity log weeks, Fig. 5, is the same, but only considering the rules relating to physical
activity.
It is clear that there is a relatively linear and direct relationship between the different variables (x-axis)
and kilos lost (y-axis). In all cases the relationship is direct, the variables vary in the same direction and
increasing the score obtained in any of them causes an increase in kilos lost.
In Fig. 2, weighted score in total rule log weeks (x-axis), the R2
implies that the rule log weeks
parameter explains 24.9% of the weight loss. That is, there is a direct relationship between the number of weeks
the log was kept on compliance with the self-control rules and the change in weight, with the longer the log time
the greater the decrease in weight.
In Fig. 3, degree to which the subject complied with all the rules(x-axis), the R2
implies that through
this linear model, a subject's total degree of compliance with the self-control rules explains 28.29% of the
variability for this dependent variable, that is, the weight lost. Comparing the R2
values from Fig. 2, 3, 4and 5
we see that it is this R2
= 0.2829 that best correlates with weight loss. The better and longer the subject's
completion of the log relating to all the rules, the greater the weight loss.
In Fig.4, degree to which the subject complied for physical activity(x-axis), the R2
value implies that
the extent to which the activity rules were complied with explains 24.29% of the weight lost variability. That is,
we can see that an increase in the score obtained regarding the degree of compliance with the physical activity
rules causes an increase in kilos lost.
In Fig. %, weighted score in activity log weeks (x-axis), the R2
implies that the number of weeks
compliance with physical activity rules was logged explains 23.73% of the variability in weight lost. That is,
there is a direct relationship between the number of weeks compliance with physical activity rules was logged
and the change in weight, with the longer the log time the greater the decrease in weight.
The hypotheses have been confirmed:
Hypothesis 1. Hypertensive patients who receive a group cognitive-behavioral self-control intervention
lose weight, which does not occur in those who do not.
Hypothesis 2. The duration of the intervention influences the results obtained, in the Intervention 2
Group, which had the longest intervention, the results obtained in post-treatment were maintained, while in the
Intervention 1 Group they were not, although the subjects did not return to their pre-treatment weights. The
hypertensive patients who received a group self-control cognitive behavioral intervention with a longer duration
retained their post-treatment achievements. While those who received the intervention for a shorter time put
weight back on, even if they did not their return to their baseline levels.
Hypothesis 3. The greater the degree of compliance by the subjects with the self-control rules, the
greater the weight loss; this is true for both diet and physical activity self-control rules. The subjects who
obtained a higher weighted score for diet self-control rules log completion lost more weight than those who had
a lower score. The subjects with a higher weighted score for the activity self-control rules log completion lost
more weight than those with a lower score.
Hypothesis 4. The greater the number of weeks over which the subjects complied with the self-control
rules, the greater the weight loss, which is true for both the diet self-control rules as well as for the physical
activity rules. Subjects who logged the self-control rules for longer lost more weight than those who logged
them for less time. The subjects who logged the activity rules for longer lost more weight than those who
logged them for less time.
V. CONCLUSION
Differences can be observed in the intervention groups as regards weight loss between pre-treatment
and post-treatment, while, in the control group this loss does not occur and even increases slightly post-
treatment.
There are differences in maintaining the results obtained during the intervention, since the Intervention
2 Group, which received the same intervention as the Intervention 1 Group, but for a longer period of time,
maintained the weight loss achieved at the post-treatment measurement (even losing more weight) at follow-up.
The Intervention 1 Group, on the other hand, did not maintain the weight loss, although it did not return to the
American Research Journal of Humanities Social Science (ARJHSS)R) 2021
ARJHSS Journal www.arjhss.com Page | 90
pretreatment weight. We consider that the subjects not only had to learn to change their habits, but they needed a
time when they had support that helps them to consolidate these changes, so a longer intervention period
favored the consolidation of their achievements. That the longer duration program was more effective in
maintaining weight loss on follow-up is undoubtedly the most novel conclusion of our study.
The completion of the self-recorded logs by the subjects correlates positively with weight loss, with
greater loss the better the logging and the more weeks it was performed for.
The scope of the study has demonstrated that follow-up to medical advice on weight loss can be
improved in overweight hypertensive patients. These patients are advised to follow a specific diet, which they
do not know how to carry out, we intervened by teaching them how to plan their menus in terms of composition
and quantity, this aspect is especially relevant since, being people at risk, they cannot simply follow one of the
many diets to which we all have access through the varied information we all receive on a daily basis.
In addition, our study highlights the possibilities within Primary Care of multidisciplinary treatment,
involving physicians, nurses and psychologists to care for hypertensive patients, who need to lose weight to
control their hypertension, for which it is essential that patients are trained and have sufficient skills to do so,
which has been achieved in this cognitive-behavioral self-control intervention.
It should also be stressed that in this study we have seen the possibilities of self-control to help self-
manage disease, in this case weight loss, in essential hypertensive patients, as recommended by the WHO in
relation to chronic diseases6.
Limitations: the most significant relates to the limited number of experimental subjects, the study
should be repeated over a longer period and with more subjects.
Recommendation: the current recording of physical activity through smart watches and similar devices,
which provide information on heart rate, calories burned, step count, pace, distance traveled, etc. in different
exercises, represent a real advance and will greatly facilitate the self-recording of physical activity, so we
recommend their use in future studies.
REFERENCES
[1] WHO (April 22, 2021) https://www.who.int/data/global-health-estimates#Hypertension (who.int)
[2] WHO (April 2013) A global brief on hypertension
[3] Schmidt, J., Cruz, F., C., Villaverde, D., Prados, M.P., García, A., Muñoz, A., Pappous, A., (2006)
Adherencia terapéutica en hipertensos. Estudio cualitativo. Index
Enferm, 15 (54) http://scielo.isciii.es/scielo.php?script=sci_arttext&pid=S1132-
12962006000200005versión On-line ISSN 1699-5988versión impresa ISSN 1132-1296
[4] Márquez, E., Gil, V., Casado, JJ., Martel, N., De la Figuera, M., Martín, JL., Atienza, F., Gros, T.,
Espinosa, J., (2006) Análisis de los estudios publicados sobre el incumplimiento terapéutico en el
tratamiento de la hipertensión arterial en España entre los años 1984 y 2005. Atención Primaria, 38 (6)
325-332, ISSN 0212-6567, https://doi.org/10.1157/13093369.
(http://www.sciencedirect.com/science/article/pii/S0212656706705121)
[5] FDA (March, 2020). Sodium in Your Diet. Retrieved on April 28, 2021 from
https://www.fda.gov/food/nutrition-education-resources-materials/sodium-your-diet
[6] WHO (2005) Preparing a Health Care Workforce for the 21 st Century: The Challenge of Chronic
Conditions. https://www.who.int/publications/list/chp_workforce_report/es/
[7] Organización Panamericana de la Salud (1990). La hipertensión arterial como problema de salud
comunitario. Manual de normas operativas para un programa de control en los diferentes niveles de
atención. Oficina Sanitaria Panamericana, Oficina Regional de la ORGANIZACIÓN MUNDIAL DE
LA SALUD ISBN 92 75 71025
[8] Mischel, W. (2014). The Marshmallow Test. Little Brown Book.
[9] Rehm, L.P., (1995) Métodos de autocontrol. En V.C. Caballo. (Ed.), Manual de técnicas de terapia y
modificación de conducta. (págs. 655-683) Siglo XXI de España editores S.A.
[10] Grzib, G., Fernández, J.L., Ortega, R., &Brengelman, J.C. (1989) Intervención psicológica de apoyo al
régimen médico: un estudio piloto con enfermos hipertensos. Revista de Psicol. Gral. Y Aplicada,
2,223-249.
[11] Arrivillaga M., Varela, M.T.; Cáceres D.E., Correa, D. y Holguín L.D. (2007) Eficacia de un programa
cognitivo conductual para la disminución de los niveles de presión arterial. Pensamiento Psicológico,
vol.3, Nº 9: 33-49
[12] Appel, L., Champagne, C., Harsha, D., Cooper, L., Obarzanek, E., Elmer, P.J., Stevens, V.J., Vollmer,
W.M., Lin, P.H., Svethey, L.P., Stedman, S.W. & Young, D.R. (2003). Effects of comprehensive
lifestyle modification on blood pressure control: main results of the Premier clinical trial. JAMA, 289
(16), 2083-2094.
[13] WHO (2004) Adherence to long-term therapies: evidence for action.
American Research Journal of Humanities Social Science (ARJHSS)R) 2021
ARJHSS Journal www.arjhss.com Page | 91
[14] Paz, M., Sanz, J. & Labrador, F. (2004) Blood pressure variability and stress management training for
essential hypertension. Behavioral Medicine, 30 (2), 53-62.
[15] Holguín, L., Correa, D., Arrivillaga, M., Cáceres, D. y Varela, M. (2006).Adherencia al tratamiento de
hipertensión arterial: efectividad de un programa de intervención Biopsicosocial. Univ. Psychol.
Bogota 5 (3), 511-548. Recuperado en:
<http://revistas.javeriana.edu.co/index.php/revPsycho/article/view/459>.
[16] Sánchez-Benito, J.L., Pontes Torrado, Y. y González Rodríguez, A. (2012) La intervención de pérdida
de peso conlleva una disminución significativa de la presión arterial y del colesterol. Clínica e
investigación en arterioesclerosis, 24 (5), 1055-1070
[17] American Dietetic Association (1992). Handbook of Clinical Dietetics (2th ed.). Yale University Press.
[18] Minitab Blog Editor (18 de abril 2019). Análisis de Regresión: ¿Cómo puedo interpretar el R- cuadrado
y evaluar la bondad de ajuste? Recuperado el 12 de febrero de 2021 de
https://blog.minitab.com/es/analisis-de-regresion-como-puedo-interpretar-el-r-cuadrado-y-evaluar-la-
bondad-de-ajuste

More Related Content

What's hot

Nutritional Rehabilitation for Eating Disorders
Nutritional Rehabilitation for Eating DisordersNutritional Rehabilitation for Eating Disorders
Nutritional Rehabilitation for Eating DisordersDavid Garner
 
Eating Attitudes Test-26 (EAT-26)
Eating Attitudes Test-26 (EAT-26)Eating Attitudes Test-26 (EAT-26)
Eating Attitudes Test-26 (EAT-26)David Garner
 
home based pulmonaRY REHABILITATION IN COPD
home based pulmonaRY REHABILITATION IN COPDhome based pulmonaRY REHABILITATION IN COPD
home based pulmonaRY REHABILITATION IN COPDSurendra Ojha
 
Association between-stress-and-dietary-behaviours-among-undergraduate-student...
Association between-stress-and-dietary-behaviours-among-undergraduate-student...Association between-stress-and-dietary-behaviours-among-undergraduate-student...
Association between-stress-and-dietary-behaviours-among-undergraduate-student...Annex Publishers
 
Glycemic elderly study
Glycemic elderly studyGlycemic elderly study
Glycemic elderly studySteve Epstein
 
Effects of an Intensive 3-Week Yoga Retreat on Sense of Well Being in Cancer ...
Effects of an Intensive 3-Week Yoga Retreat on Sense of Well Being in Cancer ...Effects of an Intensive 3-Week Yoga Retreat on Sense of Well Being in Cancer ...
Effects of an Intensive 3-Week Yoga Retreat on Sense of Well Being in Cancer ...Yogacharya AB Bhavanani
 
UNDERSTANDING HOW YOGA WORKS: A SHORT REVIEW OF FINDINGS FROM CYTER, PONDICHE...
UNDERSTANDING HOW YOGA WORKS: A SHORT REVIEW OF FINDINGS FROM CYTER, PONDICHE...UNDERSTANDING HOW YOGA WORKS: A SHORT REVIEW OF FINDINGS FROM CYTER, PONDICHE...
UNDERSTANDING HOW YOGA WORKS: A SHORT REVIEW OF FINDINGS FROM CYTER, PONDICHE...Yogacharya AB Bhavanani
 
Nutrition screening and assessment in critically ill patients
Nutrition screening and assessment in critically ill patientsNutrition screening and assessment in critically ill patients
Nutrition screening and assessment in critically ill patientsMario Sanchez
 
Levels of Anxiety and Quality of Life in Overweight Individuals Under Nutriti...
Levels of Anxiety and Quality of Life in Overweight Individuals Under Nutriti...Levels of Anxiety and Quality of Life in Overweight Individuals Under Nutriti...
Levels of Anxiety and Quality of Life in Overweight Individuals Under Nutriti...CrimsonPublishersIOD
 
Perspectives of Nursing in the Care of the Patient with Diabetes Mellitus-Cr...
Perspectives of Nursing in the Care of the  Patient with Diabetes Mellitus-Cr...Perspectives of Nursing in the Care of the  Patient with Diabetes Mellitus-Cr...
Perspectives of Nursing in the Care of the Patient with Diabetes Mellitus-Cr...CrimsonPublishersIOD
 
Management of sam guidelines for physicians and health officials
Management of sam guidelines for physicians and health officialsManagement of sam guidelines for physicians and health officials
Management of sam guidelines for physicians and health officialsSM Lalon
 
ISPOR_2014_II review_04 23 14_final
ISPOR_2014_II review_04 23 14_finalISPOR_2014_II review_04 23 14_final
ISPOR_2014_II review_04 23 14_finalSmeet Gala
 
NIX.SURF.022516
NIX.SURF.022516NIX.SURF.022516
NIX.SURF.022516Hallie Nix
 
Health Related Quality of Life (HRQoL) in pulmonary medicine
Health Related Quality of Life (HRQoL) in pulmonary medicineHealth Related Quality of Life (HRQoL) in pulmonary medicine
Health Related Quality of Life (HRQoL) in pulmonary medicineZia Hashim
 
Dia Care-2001-Clark-1079-86 (1)
Dia Care-2001-Clark-1079-86 (1)Dia Care-2001-Clark-1079-86 (1)
Dia Care-2001-Clark-1079-86 (1)Denise Burgh, MBA
 
Factors affecting quality of life in patients with diabetes
Factors affecting quality of life in patients with diabetesFactors affecting quality of life in patients with diabetes
Factors affecting quality of life in patients with diabetesFrank Reynold
 
A Study to Assess the Effectiveness of Abdominal Breathing Exercise in Reduct...
A Study to Assess the Effectiveness of Abdominal Breathing Exercise in Reduct...A Study to Assess the Effectiveness of Abdominal Breathing Exercise in Reduct...
A Study to Assess the Effectiveness of Abdominal Breathing Exercise in Reduct...ijtsrd
 

What's hot (20)

Nutritional Rehabilitation for Eating Disorders
Nutritional Rehabilitation for Eating DisordersNutritional Rehabilitation for Eating Disorders
Nutritional Rehabilitation for Eating Disorders
 
Eating Attitudes Test-26 (EAT-26)
Eating Attitudes Test-26 (EAT-26)Eating Attitudes Test-26 (EAT-26)
Eating Attitudes Test-26 (EAT-26)
 
Group Intervention Design
Group Intervention DesignGroup Intervention Design
Group Intervention Design
 
home based pulmonaRY REHABILITATION IN COPD
home based pulmonaRY REHABILITATION IN COPDhome based pulmonaRY REHABILITATION IN COPD
home based pulmonaRY REHABILITATION IN COPD
 
Association between-stress-and-dietary-behaviours-among-undergraduate-student...
Association between-stress-and-dietary-behaviours-among-undergraduate-student...Association between-stress-and-dietary-behaviours-among-undergraduate-student...
Association between-stress-and-dietary-behaviours-among-undergraduate-student...
 
Glycemic elderly study
Glycemic elderly studyGlycemic elderly study
Glycemic elderly study
 
Effects of an Intensive 3-Week Yoga Retreat on Sense of Well Being in Cancer ...
Effects of an Intensive 3-Week Yoga Retreat on Sense of Well Being in Cancer ...Effects of an Intensive 3-Week Yoga Retreat on Sense of Well Being in Cancer ...
Effects of an Intensive 3-Week Yoga Retreat on Sense of Well Being in Cancer ...
 
UNDERSTANDING HOW YOGA WORKS: A SHORT REVIEW OF FINDINGS FROM CYTER, PONDICHE...
UNDERSTANDING HOW YOGA WORKS: A SHORT REVIEW OF FINDINGS FROM CYTER, PONDICHE...UNDERSTANDING HOW YOGA WORKS: A SHORT REVIEW OF FINDINGS FROM CYTER, PONDICHE...
UNDERSTANDING HOW YOGA WORKS: A SHORT REVIEW OF FINDINGS FROM CYTER, PONDICHE...
 
3. first aid training
3. first aid training3. first aid training
3. first aid training
 
Nutrition screening and assessment in critically ill patients
Nutrition screening and assessment in critically ill patientsNutrition screening and assessment in critically ill patients
Nutrition screening and assessment in critically ill patients
 
Levels of Anxiety and Quality of Life in Overweight Individuals Under Nutriti...
Levels of Anxiety and Quality of Life in Overweight Individuals Under Nutriti...Levels of Anxiety and Quality of Life in Overweight Individuals Under Nutriti...
Levels of Anxiety and Quality of Life in Overweight Individuals Under Nutriti...
 
Perspectives of Nursing in the Care of the Patient with Diabetes Mellitus-Cr...
Perspectives of Nursing in the Care of the  Patient with Diabetes Mellitus-Cr...Perspectives of Nursing in the Care of the  Patient with Diabetes Mellitus-Cr...
Perspectives of Nursing in the Care of the Patient with Diabetes Mellitus-Cr...
 
Management of sam guidelines for physicians and health officials
Management of sam guidelines for physicians and health officialsManagement of sam guidelines for physicians and health officials
Management of sam guidelines for physicians and health officials
 
ISPOR_2014_II review_04 23 14_final
ISPOR_2014_II review_04 23 14_finalISPOR_2014_II review_04 23 14_final
ISPOR_2014_II review_04 23 14_final
 
NIX.SURF.022516
NIX.SURF.022516NIX.SURF.022516
NIX.SURF.022516
 
Health Related Quality of Life (HRQoL) in pulmonary medicine
Health Related Quality of Life (HRQoL) in pulmonary medicineHealth Related Quality of Life (HRQoL) in pulmonary medicine
Health Related Quality of Life (HRQoL) in pulmonary medicine
 
Dia Care-2001-Clark-1079-86 (1)
Dia Care-2001-Clark-1079-86 (1)Dia Care-2001-Clark-1079-86 (1)
Dia Care-2001-Clark-1079-86 (1)
 
Cancer mama
Cancer mamaCancer mama
Cancer mama
 
Factors affecting quality of life in patients with diabetes
Factors affecting quality of life in patients with diabetesFactors affecting quality of life in patients with diabetes
Factors affecting quality of life in patients with diabetes
 
A Study to Assess the Effectiveness of Abdominal Breathing Exercise in Reduct...
A Study to Assess the Effectiveness of Abdominal Breathing Exercise in Reduct...A Study to Assess the Effectiveness of Abdominal Breathing Exercise in Reduct...
A Study to Assess the Effectiveness of Abdominal Breathing Exercise in Reduct...
 

Similar to L468291.pdf

Literature Review
Literature ReviewLiterature Review
Literature Reviewebeisenb
 
AbstractBackground Hypertension is the most common non-.docx
AbstractBackground Hypertension is the most common non-.docxAbstractBackground Hypertension is the most common non-.docx
AbstractBackground Hypertension is the most common non-.docxbartholomeocoombs
 
Effectiveness of rehabilitation in the treatment ofalcohol abusepatients as d...
Effectiveness of rehabilitation in the treatment ofalcohol abusepatients as d...Effectiveness of rehabilitation in the treatment ofalcohol abusepatients as d...
Effectiveness of rehabilitation in the treatment ofalcohol abusepatients as d...inventionjournals
 
RESEARCH Open AccessTelecoaching plus a portion control pl.docx
RESEARCH Open AccessTelecoaching plus a portion control pl.docxRESEARCH Open AccessTelecoaching plus a portion control pl.docx
RESEARCH Open AccessTelecoaching plus a portion control pl.docxsyreetamacaulay
 
Nutritional Assessment in community.pptx
Nutritional Assessment in community.pptxNutritional Assessment in community.pptx
Nutritional Assessment in community.pptxDr-Faisal Al-Shormany
 
ppt Community nutrition
ppt Community nutritionppt Community nutrition
ppt Community nutritionArushi Negi
 
PICOT Question and literature.docx
PICOT Question and literature.docxPICOT Question and literature.docx
PICOT Question and literature.docxstudywriters
 
CLINICAL INQUIRIES From theFamily PhysiciansInquiries Networ.docx
CLINICAL INQUIRIES From theFamily PhysiciansInquiries Networ.docxCLINICAL INQUIRIES From theFamily PhysiciansInquiries Networ.docx
CLINICAL INQUIRIES From theFamily PhysiciansInquiries Networ.docxclarebernice
 
UNIT 4NUTRITIONAL ASSESSMENT.pptx
UNIT 4NUTRITIONAL ASSESSMENT.pptxUNIT 4NUTRITIONAL ASSESSMENT.pptx
UNIT 4NUTRITIONAL ASSESSMENT.pptxsangam neupane
 
MM-combination report #2
MM-combination report #2MM-combination report #2
MM-combination report #2Mia Matthews
 
Risck reduction programe for diabetes
Risck reduction programe for diabetes Risck reduction programe for diabetes
Risck reduction programe for diabetes Stevgo
 
Patient activation: New insights into the role of patients in self-management
Patient activation: New insights into the role of patients in self-managementPatient activation: New insights into the role of patients in self-management
Patient activation: New insights into the role of patients in self-managementMS Trust
 
Medical Self-care Education for Elders: A Controlled Trial to Evaluate Impact
Medical Self-care Education for Elders: A Controlled Trial to Evaluate ImpactMedical Self-care Education for Elders: A Controlled Trial to Evaluate Impact
Medical Self-care Education for Elders: A Controlled Trial to Evaluate ImpactWilliam Zubkoff
 

Similar to L468291.pdf (20)

Literature Review
Literature ReviewLiterature Review
Literature Review
 
Pdf hypoglycemia
 Pdf hypoglycemia Pdf hypoglycemia
Pdf hypoglycemia
 
AbstractBackground Hypertension is the most common non-.docx
AbstractBackground Hypertension is the most common non-.docxAbstractBackground Hypertension is the most common non-.docx
AbstractBackground Hypertension is the most common non-.docx
 
J377783
J377783J377783
J377783
 
AOWMC-05-00134
AOWMC-05-00134AOWMC-05-00134
AOWMC-05-00134
 
Effectiveness of rehabilitation in the treatment ofalcohol abusepatients as d...
Effectiveness of rehabilitation in the treatment ofalcohol abusepatients as d...Effectiveness of rehabilitation in the treatment ofalcohol abusepatients as d...
Effectiveness of rehabilitation in the treatment ofalcohol abusepatients as d...
 
RESEARCH Open AccessTelecoaching plus a portion control pl.docx
RESEARCH Open AccessTelecoaching plus a portion control pl.docxRESEARCH Open AccessTelecoaching plus a portion control pl.docx
RESEARCH Open AccessTelecoaching plus a portion control pl.docx
 
Nutritional Assessment in community.pptx
Nutritional Assessment in community.pptxNutritional Assessment in community.pptx
Nutritional Assessment in community.pptx
 
ppt Community nutrition
ppt Community nutritionppt Community nutrition
ppt Community nutrition
 
PICOT Question and literature.docx
PICOT Question and literature.docxPICOT Question and literature.docx
PICOT Question and literature.docx
 
CLINICAL INQUIRIES From theFamily PhysiciansInquiries Networ.docx
CLINICAL INQUIRIES From theFamily PhysiciansInquiries Networ.docxCLINICAL INQUIRIES From theFamily PhysiciansInquiries Networ.docx
CLINICAL INQUIRIES From theFamily PhysiciansInquiries Networ.docx
 
NISHU.pptx
NISHU.pptxNISHU.pptx
NISHU.pptx
 
UNIT 4NUTRITIONAL ASSESSMENT.pptx
UNIT 4NUTRITIONAL ASSESSMENT.pptxUNIT 4NUTRITIONAL ASSESSMENT.pptx
UNIT 4NUTRITIONAL ASSESSMENT.pptx
 
MM-combination report #2
MM-combination report #2MM-combination report #2
MM-combination report #2
 
Regression of Coronary Atherosclerosis through Healthy Lifestyle in Coronary ...
Regression of Coronary Atherosclerosis through Healthy Lifestyle in Coronary ...Regression of Coronary Atherosclerosis through Healthy Lifestyle in Coronary ...
Regression of Coronary Atherosclerosis through Healthy Lifestyle in Coronary ...
 
Risck reduction programe for diabetes
Risck reduction programe for diabetes Risck reduction programe for diabetes
Risck reduction programe for diabetes
 
Patient activation: New insights into the role of patients in self-management
Patient activation: New insights into the role of patients in self-managementPatient activation: New insights into the role of patients in self-management
Patient activation: New insights into the role of patients in self-management
 
Improving Diabetes Care ELDEP
Improving Diabetes Care ELDEPImproving Diabetes Care ELDEP
Improving Diabetes Care ELDEP
 
Medical Self-care Education for Elders: A Controlled Trial to Evaluate Impact
Medical Self-care Education for Elders: A Controlled Trial to Evaluate ImpactMedical Self-care Education for Elders: A Controlled Trial to Evaluate Impact
Medical Self-care Education for Elders: A Controlled Trial to Evaluate Impact
 
william zubkoff.pdf
william zubkoff.pdfwilliam zubkoff.pdf
william zubkoff.pdf
 

More from American Research Journal of Humanities & Social Science

More from American Research Journal of Humanities & Social Science (20)

O49117143.pdf
O49117143.pdfO49117143.pdf
O49117143.pdf
 
N412114120.pdf
N412114120.pdfN412114120.pdf
N412114120.pdf
 
M41095107.pdf
M41095107.pdfM41095107.pdf
M41095107.pdf
 
F493852.pdf
F493852.pdfF493852.pdf
F493852.pdf
 
H4104461.pdf
H4104461.pdfH4104461.pdf
H4104461.pdf
 
J4127989.pdf
J4127989.pdfJ4127989.pdf
J4127989.pdf
 
J497785.pdf
J497785.pdfJ497785.pdf
J497785.pdf
 
I4127078.pdf
I4127078.pdfI4127078.pdf
I4127078.pdf
 
G4125261.pdf
G4125261.pdfG4125261.pdf
G4125261.pdf
 
J4107480.pdf
J4107480.pdfJ4107480.pdf
J4107480.pdf
 
K4108187.pdf
K4108187.pdfK4108187.pdf
K4108187.pdf
 
H4126269.pdf
H4126269.pdfH4126269.pdf
H4126269.pdf
 
H496771.pdf
H496771.pdfH496771.pdf
H496771.pdf
 
F4103238.pdf
F4103238.pdfF4103238.pdf
F4103238.pdf
 
A490108.pdf
A490108.pdfA490108.pdf
A490108.pdf
 
D4123036.pdf
D4123036.pdfD4123036.pdf
D4123036.pdf
 
I497276.pdf
I497276.pdfI497276.pdf
I497276.pdf
 
G495366.pdf
G495366.pdfG495366.pdf
G495366.pdf
 
G4114953.pdf
G4114953.pdfG4114953.pdf
G4114953.pdf
 
F4114248.pdf
F4114248.pdfF4114248.pdf
F4114248.pdf
 

Recently uploaded

如何办理伦敦南岸大学毕业证(本硕)LSBU学位证书
如何办理伦敦南岸大学毕业证(本硕)LSBU学位证书如何办理伦敦南岸大学毕业证(本硕)LSBU学位证书
如何办理伦敦南岸大学毕业证(本硕)LSBU学位证书FS LS
 
FINALTRUEENFORCEMENT OF BARANGAY SETTLEMENT.ppt
FINALTRUEENFORCEMENT OF BARANGAY SETTLEMENT.pptFINALTRUEENFORCEMENT OF BARANGAY SETTLEMENT.ppt
FINALTRUEENFORCEMENT OF BARANGAY SETTLEMENT.pptjudeplata
 
Cleades Robinson's Commitment to Service
Cleades Robinson's Commitment to ServiceCleades Robinson's Commitment to Service
Cleades Robinson's Commitment to ServiceCleades Robinson
 
一比一原版旧金山州立大学毕业证学位证书
 一比一原版旧金山州立大学毕业证学位证书 一比一原版旧金山州立大学毕业证学位证书
一比一原版旧金山州立大学毕业证学位证书SS A
 
The Active Management Value Ratio: The New Science of Benchmarking Investment...
The Active Management Value Ratio: The New Science of Benchmarking Investment...The Active Management Value Ratio: The New Science of Benchmarking Investment...
The Active Management Value Ratio: The New Science of Benchmarking Investment...James Watkins, III JD CFP®
 
如何办理新加坡南洋理工大学毕业证(本硕)NTU学位证书
如何办理新加坡南洋理工大学毕业证(本硕)NTU学位证书如何办理新加坡南洋理工大学毕业证(本硕)NTU学位证书
如何办理新加坡南洋理工大学毕业证(本硕)NTU学位证书Fir L
 
如何办理(USF文凭证书)美国旧金山大学毕业证学位证书
如何办理(USF文凭证书)美国旧金山大学毕业证学位证书如何办理(USF文凭证书)美国旧金山大学毕业证学位证书
如何办理(USF文凭证书)美国旧金山大学毕业证学位证书Fs Las
 
Mediation ppt for study materials. notes
Mediation ppt for study materials. notesMediation ppt for study materials. notes
Mediation ppt for study materials. notesPRATIKNAYAK31
 
一比一原版牛津布鲁克斯大学毕业证学位证书
一比一原版牛津布鲁克斯大学毕业证学位证书一比一原版牛津布鲁克斯大学毕业证学位证书
一比一原版牛津布鲁克斯大学毕业证学位证书E LSS
 
Transferable and Non-Transferable Property.pptx
Transferable and Non-Transferable Property.pptxTransferable and Non-Transferable Property.pptx
Transferable and Non-Transferable Property.pptx2020000445musaib
 
一比一原版西澳大学毕业证学位证书
 一比一原版西澳大学毕业证学位证书 一比一原版西澳大学毕业证学位证书
一比一原版西澳大学毕业证学位证书SS A
 
6th sem cpc notes for 6th semester students samjhe. Padhlo bhai
6th sem cpc notes for 6th semester students samjhe. Padhlo bhai6th sem cpc notes for 6th semester students samjhe. Padhlo bhai
6th sem cpc notes for 6th semester students samjhe. Padhlo bhaiShashankKumar441258
 
如何办理(SFSta文凭证书)美国旧金山州立大学毕业证学位证书
如何办理(SFSta文凭证书)美国旧金山州立大学毕业证学位证书如何办理(SFSta文凭证书)美国旧金山州立大学毕业证学位证书
如何办理(SFSta文凭证书)美国旧金山州立大学毕业证学位证书Fs Las
 
LITERAL RULE OF INTERPRETATION - PRIMARY RULE
LITERAL RULE OF INTERPRETATION - PRIMARY RULELITERAL RULE OF INTERPRETATION - PRIMARY RULE
LITERAL RULE OF INTERPRETATION - PRIMARY RULEsreeramsaipranitha
 
INVOLUNTARY TRANSFERS Kenya school of law.pptx
INVOLUNTARY TRANSFERS Kenya school of law.pptxINVOLUNTARY TRANSFERS Kenya school of law.pptx
INVOLUNTARY TRANSFERS Kenya school of law.pptxnyabatejosphat1
 
如何办理澳洲南澳大学(UniSA)毕业证学位证书
如何办理澳洲南澳大学(UniSA)毕业证学位证书如何办理澳洲南澳大学(UniSA)毕业证学位证书
如何办理澳洲南澳大学(UniSA)毕业证学位证书Fir L
 
CALL ON ➥8923113531 🔝Call Girls Singar Nagar Lucknow best sexual service
CALL ON ➥8923113531 🔝Call Girls Singar Nagar Lucknow best sexual serviceCALL ON ➥8923113531 🔝Call Girls Singar Nagar Lucknow best sexual service
CALL ON ➥8923113531 🔝Call Girls Singar Nagar Lucknow best sexual serviceanilsa9823
 
CAFC Chronicles: Costly Tales of Claim Construction Fails
CAFC Chronicles: Costly Tales of Claim Construction FailsCAFC Chronicles: Costly Tales of Claim Construction Fails
CAFC Chronicles: Costly Tales of Claim Construction FailsAurora Consulting
 

Recently uploaded (20)

如何办理伦敦南岸大学毕业证(本硕)LSBU学位证书
如何办理伦敦南岸大学毕业证(本硕)LSBU学位证书如何办理伦敦南岸大学毕业证(本硕)LSBU学位证书
如何办理伦敦南岸大学毕业证(本硕)LSBU学位证书
 
FINALTRUEENFORCEMENT OF BARANGAY SETTLEMENT.ppt
FINALTRUEENFORCEMENT OF BARANGAY SETTLEMENT.pptFINALTRUEENFORCEMENT OF BARANGAY SETTLEMENT.ppt
FINALTRUEENFORCEMENT OF BARANGAY SETTLEMENT.ppt
 
Cleades Robinson's Commitment to Service
Cleades Robinson's Commitment to ServiceCleades Robinson's Commitment to Service
Cleades Robinson's Commitment to Service
 
Russian Call Girls Rohini Sector 7 💓 Delhi 9999965857 @Sabina Modi VVIP MODEL...
Russian Call Girls Rohini Sector 7 💓 Delhi 9999965857 @Sabina Modi VVIP MODEL...Russian Call Girls Rohini Sector 7 💓 Delhi 9999965857 @Sabina Modi VVIP MODEL...
Russian Call Girls Rohini Sector 7 💓 Delhi 9999965857 @Sabina Modi VVIP MODEL...
 
一比一原版旧金山州立大学毕业证学位证书
 一比一原版旧金山州立大学毕业证学位证书 一比一原版旧金山州立大学毕业证学位证书
一比一原版旧金山州立大学毕业证学位证书
 
The Active Management Value Ratio: The New Science of Benchmarking Investment...
The Active Management Value Ratio: The New Science of Benchmarking Investment...The Active Management Value Ratio: The New Science of Benchmarking Investment...
The Active Management Value Ratio: The New Science of Benchmarking Investment...
 
如何办理新加坡南洋理工大学毕业证(本硕)NTU学位证书
如何办理新加坡南洋理工大学毕业证(本硕)NTU学位证书如何办理新加坡南洋理工大学毕业证(本硕)NTU学位证书
如何办理新加坡南洋理工大学毕业证(本硕)NTU学位证书
 
如何办理(USF文凭证书)美国旧金山大学毕业证学位证书
如何办理(USF文凭证书)美国旧金山大学毕业证学位证书如何办理(USF文凭证书)美国旧金山大学毕业证学位证书
如何办理(USF文凭证书)美国旧金山大学毕业证学位证书
 
Mediation ppt for study materials. notes
Mediation ppt for study materials. notesMediation ppt for study materials. notes
Mediation ppt for study materials. notes
 
Vip Call Girls Greater Noida ➡️ Delhi ➡️ 9999965857 No Advance 24HRS Live
Vip Call Girls Greater Noida ➡️ Delhi ➡️ 9999965857 No Advance 24HRS LiveVip Call Girls Greater Noida ➡️ Delhi ➡️ 9999965857 No Advance 24HRS Live
Vip Call Girls Greater Noida ➡️ Delhi ➡️ 9999965857 No Advance 24HRS Live
 
一比一原版牛津布鲁克斯大学毕业证学位证书
一比一原版牛津布鲁克斯大学毕业证学位证书一比一原版牛津布鲁克斯大学毕业证学位证书
一比一原版牛津布鲁克斯大学毕业证学位证书
 
Transferable and Non-Transferable Property.pptx
Transferable and Non-Transferable Property.pptxTransferable and Non-Transferable Property.pptx
Transferable and Non-Transferable Property.pptx
 
一比一原版西澳大学毕业证学位证书
 一比一原版西澳大学毕业证学位证书 一比一原版西澳大学毕业证学位证书
一比一原版西澳大学毕业证学位证书
 
6th sem cpc notes for 6th semester students samjhe. Padhlo bhai
6th sem cpc notes for 6th semester students samjhe. Padhlo bhai6th sem cpc notes for 6th semester students samjhe. Padhlo bhai
6th sem cpc notes for 6th semester students samjhe. Padhlo bhai
 
如何办理(SFSta文凭证书)美国旧金山州立大学毕业证学位证书
如何办理(SFSta文凭证书)美国旧金山州立大学毕业证学位证书如何办理(SFSta文凭证书)美国旧金山州立大学毕业证学位证书
如何办理(SFSta文凭证书)美国旧金山州立大学毕业证学位证书
 
LITERAL RULE OF INTERPRETATION - PRIMARY RULE
LITERAL RULE OF INTERPRETATION - PRIMARY RULELITERAL RULE OF INTERPRETATION - PRIMARY RULE
LITERAL RULE OF INTERPRETATION - PRIMARY RULE
 
INVOLUNTARY TRANSFERS Kenya school of law.pptx
INVOLUNTARY TRANSFERS Kenya school of law.pptxINVOLUNTARY TRANSFERS Kenya school of law.pptx
INVOLUNTARY TRANSFERS Kenya school of law.pptx
 
如何办理澳洲南澳大学(UniSA)毕业证学位证书
如何办理澳洲南澳大学(UniSA)毕业证学位证书如何办理澳洲南澳大学(UniSA)毕业证学位证书
如何办理澳洲南澳大学(UniSA)毕业证学位证书
 
CALL ON ➥8923113531 🔝Call Girls Singar Nagar Lucknow best sexual service
CALL ON ➥8923113531 🔝Call Girls Singar Nagar Lucknow best sexual serviceCALL ON ➥8923113531 🔝Call Girls Singar Nagar Lucknow best sexual service
CALL ON ➥8923113531 🔝Call Girls Singar Nagar Lucknow best sexual service
 
CAFC Chronicles: Costly Tales of Claim Construction Fails
CAFC Chronicles: Costly Tales of Claim Construction FailsCAFC Chronicles: Costly Tales of Claim Construction Fails
CAFC Chronicles: Costly Tales of Claim Construction Fails
 

L468291.pdf

  • 1. American Research Journal of Humanities Social Science (ARJHSS)R) 2021 ARJHSS Journal www.arjhss.com Page | 82 American Research Journal of Humanities Social Science (ARJHSS) E-ISSN: 2378-702X Volume-04, Issue-06, pp-82-91 www.arjhss.com Research Paper Open Access Can people with hypertension lose weight through a group cognitive-behavioral self-control intervention? Huidobro, E. ; Cuadrado, I. 2 1 Department of Basic Psychology II, National DistanceEducation University; Spain. 2 Department of Psychology and Anthropology, University of Extremadura; España, Spain Abstract: Objective: to test the efficacy of a cognitive-behavioral self-control program in reducing weight instage I essential hypertensive patients in primary care. Experimental study of three stages: pre- intervention,post-intervention and follow-up and three experimental groups with eight subjects each: intervention 1,intervention 2, differing in program duration, and a control group. Individual plans covering a balanced diet andphysical exercise were made. Compliance with self-control rules was used with recording in a daily log.Results:there are no statistically significant differences between the groups, nor with the control group. In theintervention groups there was significant weight loss between pre- and post-treatment conditions. In the follow-up, group 2 maintained weight loss, group 1 regained weight, although their weight was still significantly lowercompared to pre-treatment. In the subjects as a whole, the correlations between logging compliance with self-control rules and weight loss are statistically significant. The greater the rigor and length of compliance, thegreater the weight loss. Conclusions: The intervention has been effective in achieving weight reduction. Studyparticipants who registered greater observance of the self-control rules obtained greater effectiveness in weightloss. An innovative conclusion is that the longer duration program was more effective in maintaining weightloss at the follow-up stage. Keywords - physical activity, self-control, diet, hypertension, cognitive-behavioral intervention, weight loss. I. INTRODUCTION Hypertension -or high blood pressure- is a chronic, serious and silent medical condition and one of the leading causes of premature death worldwide. It is estimated that 1.13 billion people in the world have hypertension and less than 1 in 5 have it under control1. This can lead to disability, poor quality of life, heart attack, stroke, kidney failure, blindness, and cognitive decline2. This lack of control, which results in failure to comply with therapeutic measures, is between 60-90% for hygiene-dietary measures3.Especially in relation to diet4. The consumption of salt in the diet contributes to raised blood pressure, as well as the prevalence of hypertension. More than 70% of dietary sodium comes from the consumption of packaged and prepared foods. Sodium intake can be reduced by reading the Nutrition Facts label on foods5. Hypertension requires modification to a) behavioral habits: diet and sedentary lifestyle; b) metabolic habits: obesity and hyperlipidemia2. To help the chronically ill to modify their habits it is necessary to promote the self-management of the disease by the patient themself6. Support groups facilitate educational activities and the incorporation of primary preventive activities such as physical exercise, weight control and changing health habits7.The medical advice that requires a change in patients' habits involves delaying or enduring the lack of immediate satisfaction that their habits provide. To achieve these physician-imposed goals, patients' willpower and their self-control in sustaining the effort must be strengthened for which they need a support group to back them up 8. Self-control rules make it easier for the patient to set objectives related to specific habits, promote self-monitoring of harmful habits and influence the patent's environment, facilitating a more favorable context for achieving the objectives 6.Self-logging facilitates taking a baseline, rule observance, achievement of goals, evaluation of the intervention and patient progress. It also provides feedback, since desirable behavior is reinforced by the fact of logging it and presenting it later to the group with the progress achieved, while undesirable behavior becomes more difficult since logging it is a reminder of the reasons for not putting that behavior into practice9.
  • 2. American Research Journal of Humanities Social Science (ARJHSS)R) 2021 ARJHSS Journal www.arjhss.com Page | 83 There are studies on psychosocial and specifically cognitive behavioral interventions in the treatment of hypertension that support the effectiveness of this type of intervention in lowering blood pressure10, 11, 12, 13, 14, 15. Excess weight is a risk factor in hypertension and losing weight leads to a significant decrease in blood pressure16. Being aware of the efficacy of cognitive behavioral techniques in lowering blood pressure in hypertensive patients and knowing the importance of weight loss in these patients, we proposed this intervention to test the efficacy of a cognitive-behavioral self-control program in groups to reduce weight in stage I essential hypertensive patients. Our contribution to this field is to test whether it is possible through a cognitive behavioral intervention for hypertensive patients to lose weight, by training them in self-control and intervening directly in their eating and physical activity habits. II. RESEARCH METHOD In this intervention, a group cognitive-behavioral program with self-control rules was implemented. To achieve this, we worked on two programs: diet and physical exercise, aiming for a balanced, hypocaloric diet with control over lipid and sodium intake, together with regular physical activity. The sessions were divided into two parts: informative and behavioral. Based on an analysis of each patient's diet, a specific dietary plan was developed for each one, following medical recommendations and the patient was helped to follow that plan, enabling them to plan menus, estimate amounts and the composition of their diet. In addition, an increase in physical activity was attempted by advising the patient on how to incorporate it into their daily life. 2.1. Design The intervention was carried out in accordance with an experimental design, including a control group, and involved data collection (measurements): baseline (pre-treatment), outcome measurement (post-treatment) and follow-up at six months (follow-up). The 24 subjects chosen at random were randomly distributed into three groups: two experimental (intervention 1 and intervention 2) and one control group, with eight subjects each. The control group did not take part in the cognitive-behavioral self-control program in support groups, but received increased attention from health personnel, more visits, personal contact, more recommendations, etc. than before becoming part of the control group, so we cannot refer to them as a group that did not receive any attention, but rather one that received more conventional attention. The aim of our intervention was to test the efficacy of a cognitive-behavioral self-control program with intervention groups to reduce weight in stage I essential hypertensive patients. The hypotheses were as follows: Hypothesis 1. Hypertensive patients who receive a group cognitive-behavioral self-control intervention lose weight, which does not occur in those who do not. Hypothesis 2. The duration of the intervention influences the results obtained. Hypothesis 3. The better the subjects' degree of compliance with the self-control rules, the greater the weight loss. Hypothesis 4. The greater the number of weeks during which the subjects comply with the self-control rules, the greater the weight loss. Variables: the independent variable (IV) studied was the cognitive-behavioral self-control intervention performed in a group. This is broken down into three aspects: self-control over diet, self-control over physical activity, the duration of the intervention. The dependent variables (DVs) considered included: weight, compliance with self-control rules regarding diet and physical activity and weeks of logging behavior. 2.2. Participants Patients attending three General Medicine clinics in a Primary Care Health Center in the province of Cáceres, Spain participated in the study. The subjects were selected after studying the databases and medical records pertaining to a total of 5,372 people using these clinics, of whom 669 were diagnosed as hypertensive. Of these, 70 had the following characteristics: essential hypertension in STAGE I, without metabolic and/or mental disorders, overweight, and who appeared to have poor adherence to medical treatment and little control over their disease. Attempts were made to contact all these subjects, 46 were reached by telephone, and 41 were invited to a first interview. In addition to having an interview and receiving general information about the program, they were also presented with the informed consent form, which was signed by 40 once the subjects had received an explanation regarding the objective of the study, confidentiality, the truthfulness of the information and the possibility of withdrawing at any time. Of these subjects, 24 were randomly chosen and randomly distributed into three groups, two experimental and one control, with eight subjects in each. The mean age of the participants was 62 years, with age ranges between 34 and 73 years. In total, 16.7% were men and 83.3% women.
  • 3. American Research Journal of Humanities Social Science (ARJHSS)R) 2021 ARJHSS Journal www.arjhss.com Page | 84 2.3. Research Instruments The instruments and materials used included: a) Self-reporting logs. b) Diet calculation and menu planning protocols. c) Food exchange lists. d) Printed and in-kind support material (spice jars). e) Scales 2.4. Process In the intervention, three distinct periods were defined: Period I, the selection and commitment to participate by the participating professionals, three nurses, three doctors and one pharmacist, who received specific training relating to the intervention, which was coordinated and directed by a psychologist. After studying the history and selecting the subjects, three face-to- face interviews were carried out, baseline measurements were then taken over a two-week period, with self- logging of weight, diet and physical activity. The composition of the diet, kilocalories, active ingredients in percentages of proteins, carbohydrates and fat were analyzed. The conclusions regarding their diet and physical activity, which was also analyzed, were explained to each patient, and a date for beginning the group sessions was scheduled. Period II, the intervention itself began with the sessions, two groups were formed in order to have a smaller number of subjects in each one, since the active participation of all members was sought. The groups were both led by the same therapist, a psychologist, with the same content, the same procedure, although the groups were not held simultaneously, with one following the other. In addition, in order to assess whether the duration of the intervention had any effect on its effectiveness, the length of time the intervention lasted for the two groups was different, the Intervention 1 Group had eleven sessions with an approximate frequency of one a week for fourteen weeks, the Intervention 2 Group had 15 sessions for 21 weeks, one a week (approximately) for the first 11 weeks and then one every fortnight. At the end of this period, post-treatment measurements were taken. Period III, six months after the end of the intervention and the post-treatment measurements being taken, the last group session was convened for a reminder and a personal interview, in which the last logs were collected and follow-up measurements taken. 2.4.1. The groups: Two groups were established to encourage the participation of all the members, each comprised the coordinator and the eight subjects in each intervention group. Sitting in a circle, the coordinator sought to ensure everyone participated equitably. In the group, there was an increase in personal capacity as users shared their daily findings which helped others, for example, with where to find low sodium foods. The failure to achieve goals was shared and the subject felt supported by the others, successes were reinforced by everyone and became achievements to be imitated by the others. For example, the person who achieved the greatest weight loss in a week was applauded by the others. Healthy habits were encouraged, for example, they described the walking routes with information on distance and difficulty. 2.4.2. The sessions: Each session featured two parts, an informative part and a behavioral one that ended with sharing.The former lasted about 20 minutes and the latter about 40 minutes. A very important part of the sessions, which was highly appreciated by the subjects, was the sharing, in which everyone talked about their problems, concerns and achievements. For example, the subjects weighed themselves every day, calculated their weekly average and this data was entered in each session on their personal graph on which the weight lost was very clearly seen, this was shared with others during the sharing, reinforcing achievements and giving an incentive to all the group members. 2.4.2.1. In the informative, educational part, explanations were given regarding hypertension, obesity, diet, food, its immediate principles, healthy nutrition, sodium content, prohibited foods, processed foods, water intake, salt, alternatives for seasoning, sedentary lifestyle, physical activity, benefits, classes and safety standards. The explanations were accompanied by printed informative material. 2.4.2.2.In the behavioral part, the guidelines to be followed were given for the proper functioning of the group that were always reinforced with explanatory posters. The implementation of the diet and physical exercise plans and self-control were worked on. 2.4.2.2.1.To implement the diet plans we relied on the guidelines from the American Dietetic Association 17, with a diet composition of: 30% fat, 22% proteins and 48% carbohydrates; the dietary monitoring was based on interchangeable choices that the subject made regarding their food: Six food exchange lists were explained and distributed, 1: milk, 2: vegetables, 3: fruit, 4: carbohydrates, 5: meat, 6: fats. Each list included: composition of the food, information on what each choice on the list provides, grams of carbohydrates, proteins, fat and kilocalories, in addition to what that food provides in terms of vitamins, minerals and how it can be used. For example, on list 1: a choice of skimmed milk
  • 4. American Research Journal of Humanities Social Science (ARJHSS)R) 2021 ARJHSS Journal www.arjhss.com Page | 85 corresponds to 1 cup and contains 12 grams of carbohydrates, 8 grams of protein, very little fat and 80 kcal. List 2, a choice of vegetables corresponds to ½ cup and contains 5 grams of carbohydrates, 2 grams of protein and 25 kcal. List 3, a choice contains 10 grams of carbohydrates and 40 kcal. List 4, a choice contains 15 grams of carbohydrates, 2 grams of protein and 70 kcal. List 5 depends on the type of meat, in the case of lean meat each amount of 30 grams contains 7 grams of protein, 3 grams of fat and 55 kcal. List 6, each choice contains 5 grams of fat and 45 kcal. The most common foods that correspond to each category were also listed with the amount corresponding to each choice, for example, a cup (we used the US measure 236.5 ml or cm³). For example, in list 3, fruit, 2 medium-sized fresh apricots correspond to a choice. To establish the diet plan, which was planned based on the food exchange lists and taking into account the subject's preferences, we started by estimating the weight that the subject should have, using the Lorentz formula, which allowed us to calculate the theoretical ideal weight (IW) based on height and sex: Lorentz Formula (LF): IWLF= (height [cm] – 100)–((height [cm]-150)/K). In men k=4, in women k=2.5. Normal caloric needs were calculated = ideal weight (kg) x 30. For example, for a woman whose ideal weight is 65 kg. This would be: 65 x 30 = 1950 kcal. In our case, the subjects performed moderate physical activity; if they had had a high energy expenditure due to work or sport, their energy needs would have been increased. Since the subjects had to lose weight, the calorie expenditure had to be lower than the maintenance energy expenditure, it was reduced by 500 kcal: daily kcal = caloric needs – 500 kcal. In our example 1950 kcal – 500 kcal = 1450 kcal. In order to have objective information about each participant's daily intake, each participant brought their own domestic crockery, plates, serving spoon, etc. to one of the sessions, and a comparison was made with measuring spoons and jugs (reference measures in the United States), in order to make them aware of the amounts they ate. They also brought in the amount of bread they ate daily and weighed it on a scale. During the sessions, the patients were trained to use the lists, plan their menu to fit the prescribed diet composition, make choices and add up the calories to achieve their target weight. To achieve a low-sodium diet, the consumption of spices as a substitute for salt was encouraged, a basket with spices was given to each patient with suggestions on how to use them. Instructions were also given regarding buying, reading labels, storing and what to do in situations when it is difficult to follow the diet. Each subject had personalized menu planning sheets, indicating: the permitted kilocalories, with six columns corresponding to the food lists with the permitted choices for each column that could be distributed in four intakes a day, breakfast, lunch, snack and dinner. 2.4.2.2.2.For the physical activity we started from the information collected in the self-logging of activity that was carried out on two different days, one on a Sunday and the other on a working day. In these, the subjects logged all the activities undertaken during the day with the start and end time. The sessions explained the recommended exercises for people with hypertension, the possible exercises they could do with the corresponding energy expenditure and how to do the exercises safely. Work was undertaken on integrating the exercises into daily life, seeking to take advantage of every opportunity to move around, for example, instead of taking the elevator, climbing stairs. 2.4.2.3.Self-control was developed through behavioral rules, really "homework", which was either proposed in the program or elaborated by the subjects themselves, and this involved the observation of their own behavior, encouraging self-vigilance and helping them to comply. The purpose was to facilitate changing habits that are harmful to health. The subjects carried out daily self-logging in relation to the degree of compliance with the rules and this was grouped around five habits to work on: the quantity of food, the quality of the food, the physical activity carried out, the environment surrounding the meal and the act of eating itself. As an example of latter type of rule: "I leave the fork on the plate between mouthfuls". III. DATA ANALYSIS The evaluation during the intervention included baseline, post-treatment and follow-up measurements on the one hand, and measurements during the treatment on the other. The self-logged measurements made during the treatment included: weight; diet composition and amount; and self-assessment of adherence to self-control rules including physical activity. The subjects could choose several rules from each of the 5 types or only from some of the types. The self-logging was undertaken weekly, delivered and collected in each session and completed with a daily self-evaluation of the degree to which they have observed the rules chosen by them, with precise indications: “Evaluate each night the extent to which you have observed the self-control rules you have chosen”: Use the following grading: Today I have fulfilled the rule: + fully, (+) pretty well, (-) Not too well, – I didn't follow the rule. Next, there was a table with eight columns and six rows (more could be added if the subject chose more than six rules). The first, very wide, column was to write, in each row, the chosen rule; the next seven columns corresponded to each day of the week, and they were used to log the assessment by the subject in accordance with the explained grading.
  • 5. American Research Journal of Humanities Social Science (ARJHSS)R) 2021 ARJHSS Journal www.arjhss.com Page | 86 The data was analyzed using Statical Package for Social Sciences (SPSS) version 25. The central tendencies and dispersion were calculated to determine the sample's characteristics. The study variables present symmetry and a kurtosis similar to normal, so we applied parametric tests. In addition, the Shapiro-Wilk test was applied to guarantee this compliance, with p-values greater than 0.05 calculated, and therefore parametric tests were performed. The tests used were the Student's T-test to evaluate the differences between pre and post; between pre and follow-up; and between post and follow-up. These comparisons were made for the weight variable. To analyze the differences between the three measurement stages, pre, post and follow-up, a global repeated measures Anova test was applied with the F-test. Pearson's correlation was applied to analyze correlations between variables. All our tests have a partially repeated measures design, with an intrasubject factor, which is the measurement at three different times for each subject. And also, an intergroup factor, which is the type of group (with three levels: control, intervention 1 and intervention). In the F-test, the assumed hypothesis was that there are no differences between the three groups, therefore, a p-value of less than 0.05 implies that there are differences. Subsequently, two-by-two comparisons were made for each group separately, to evaluate between which of the three moments there are differences. Simple dispersion with pre-post variance line adjustment and R2 was calculated to provide information on the relationship between the dependent variable weight loss and the dependent variables rule completion and weeks of logging. IV. RESULTS Significant differences in the weight of the subjects were found in our study. This difference is seen in both intervention groups, however, there is no such variation in the control group, which confirms our hypothesis 1. The hypertensive patients who received a cognitive-behavioral self-control intervention including support groups lost weight, which did not occur in those who did not. Statistically significant differences were observed in the intervention groups (p<0.001), while no significant differences were observed in the control group(p>0.05). In none of the cases were there statistically significant differences between the three groups. In some fields, R2 values are expected to be low. For example, any discipline that attempts to predict human behavior, such as psychology, usually has R2 values under 50%. Human beings are simply more difficult to predict than, for example, physical processes. In addition, if the R2 value is low, but there are statistically significant predictors, it is still possible to draw important conclusions about the association between changes in predictor values and changes in response value18. In this experiment we have to point out that the variables have a relatively small range of variation, as they are biological variables their margin of variation is never large, for example, one of the patients who weighed 86 kilos, lost 7 kilos during the intervention, which is a clinically significant value in their case, but the range of variation is only 8%. This limited potential for variation contributes to the fact that the values are not statistically significant when comparing the intervention groups with the control group, although they do indicate that the intervention has clinical efficacy. Figure 1. Weight evolution
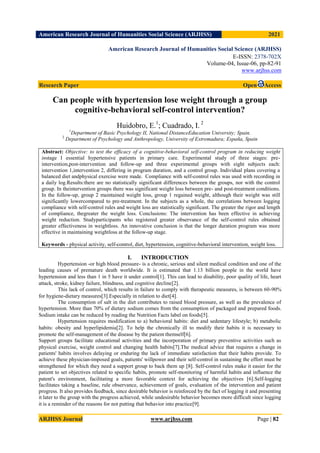
  • 6. American Research Journal of Humanities Social Science (ARJHSS)R) 2021 ARJHSS Journal www.arjhss.com Page | 87 Table 1. Comparison between stages Fig 1 and Table 1 demonstrate that the groups' results are different, presenting a pattern in which the intervention groups show an improvement,while the control group remains constant. However, statistically this difference is not sufficient to state that it is significant. It seems logical to assume that, by increasing the sample size, or incorporating a control variable, these differences will be significant, as can be seen very clearly in these figure and table. We have found intragroup differences, that is, when evaluating each group separately, over the three time points, we found significant differences over time in the intervention groups. In the control group, as was expected, there were no significant differences between Pre-Post, Pre- Follow-up, or Post-Follow-up, see Fig. 1 and Table 1 In the Intervention 1 Group, there are significant differences between the three comparisons. In the pre- post comparison, we have an average for the pre of 77.85, which reduced to 72.75 in the post. In the case of the difference between pre and follow-up, which is also significant, we see that the averages go from 77.85 in the pre to 74.4125, that is, it is lower, but there is not as great a difference with respect to the Pre-Post findings. In the Intervention 2 Group we have differences in Pre-Post and Pre-Follow-up, but not between Post and Follow-up. This indicates that the effect of intervention 2 is maintained up until the follow-up measurements. Between Pre-Post we see that the average goes from an initial value of 75.35 down to 70.25. The same occurs for the difference between Pre and Follow-up, where we went from the initial 75.35 to 70.0605, which is even lower than the post measurement. Graphically, Fig.1 shows that initially we have more or less equivalent groups, with a higher mean for the Intervention 1 Group and a very similar mean for the others. In the post measurements, it can be clearly observed that the control group remains stable with virtually no changes, but the other two have decreased significantly. Moving on to the follow-up, in intervention 1 (which is the shortest duration of the intervention) this effect is diluted, however, in intervention 2 the effect of the decrease is maintained. Figure 2. Weighted score in rule log weeks Group T gl P-value Pre Post -0,165 7 0,873 Pre Follow-up -0,638 7 0,543 Post Follow-up -0,801 7 0,45 Pre Post 6,947 7 0,0000 Pre Follow-up 4,292 7 0,004 Post Follow-up -2,974 7 0,021 Pre Post 6,859 7 0,0000 Pre Follow-up 3,807 7 0,007 Post Follow-up 0,161 7 0,877 Weight in kilos CONTROL 1 Intervention 2 Intervention Variable Comparison at times COMPARISON STAGES (Pre-Post-Follow-up) Measurement stage y = 4,7423x + 0,3548 R² = 0,249 0,00 1,00 2,00 3,00 4,00 5,00 6,00 7,00 8,00 9,00 0,00 0,20 0,40 0,60 0,80 1,00 1,20 1,40 Lost weight Weighted score in total rule log weeks
  • 7. American Research Journal of Humanities Social Science (ARJHSS)R) 2021 ARJHSS Journal www.arjhss.com Page | 88 Figure 3. Degree to which the subject complied with all the rules Figure 4. Degree to which the subject complied for physical activity. Figure 5. Degree to which the subject complied for physical activity. Data for all the subjects in the two groups, intervention 1 and intervention 2, n=16, are presented in Fig. 2, 3, 4 and 5. The blue points are the scores obtained by each subject, we calculated the correlations and R2 to find out whether there is a relationship between the weight loss DV and the other DVs. The scores for each subject were obtained as follows: To assess compliance with the self-control rules, several steps were followed: A value was given to the evaluations made by the subjects: + totally: 1 point, (+) fairly well: 0.67 points, (–) not very well: 0.33 points, - I have not followed the rule: 0 points. For each subject, the sum of all the values for each rule was calculated, giving a subtotal. For the types of rules used by the subject (maximum five) we added together the corresponding subtotals. The result of this sum was divided by the number of types of rules chosen by the subject, which gives the average for each subject's rating, this is the Subjective Compliance Index for each subject for all the rules.
  • 8. American Research Journal of Humanities Social Science (ARJHSS)R) 2021 ARJHSS Journal www.arjhss.com Page | 89 In order to evaluate the number of weeks that the subjects have completed the logs, we added the number of weeks each subject completed the logs, we took the group mean and divided the score for each subject by this average which gives us the weighted score in total rule log weeks. Fig. 2 In order to obtain an overall score for each subject that takes into account rule completion and log weeks, we multiplied each subject's subjective compliance index score by the weighted score in rule log weeks. The group mean was calculated. The score for each subject was divided by the group mean and this gives us the weighted score of each subject for rule compliance, which is thedegree to which the subject complied with all the rules. Fig. 3 The weighted score in weeksdegree to which the subject complied for physical activity, Fig.4, and weighted score in activity log weeks, Fig. 5, is the same, but only considering the rules relating to physical activity. It is clear that there is a relatively linear and direct relationship between the different variables (x-axis) and kilos lost (y-axis). In all cases the relationship is direct, the variables vary in the same direction and increasing the score obtained in any of them causes an increase in kilos lost. In Fig. 2, weighted score in total rule log weeks (x-axis), the R2 implies that the rule log weeks parameter explains 24.9% of the weight loss. That is, there is a direct relationship between the number of weeks the log was kept on compliance with the self-control rules and the change in weight, with the longer the log time the greater the decrease in weight. In Fig. 3, degree to which the subject complied with all the rules(x-axis), the R2 implies that through this linear model, a subject's total degree of compliance with the self-control rules explains 28.29% of the variability for this dependent variable, that is, the weight lost. Comparing the R2 values from Fig. 2, 3, 4and 5 we see that it is this R2 = 0.2829 that best correlates with weight loss. The better and longer the subject's completion of the log relating to all the rules, the greater the weight loss. In Fig.4, degree to which the subject complied for physical activity(x-axis), the R2 value implies that the extent to which the activity rules were complied with explains 24.29% of the weight lost variability. That is, we can see that an increase in the score obtained regarding the degree of compliance with the physical activity rules causes an increase in kilos lost. In Fig. %, weighted score in activity log weeks (x-axis), the R2 implies that the number of weeks compliance with physical activity rules was logged explains 23.73% of the variability in weight lost. That is, there is a direct relationship between the number of weeks compliance with physical activity rules was logged and the change in weight, with the longer the log time the greater the decrease in weight. The hypotheses have been confirmed: Hypothesis 1. Hypertensive patients who receive a group cognitive-behavioral self-control intervention lose weight, which does not occur in those who do not. Hypothesis 2. The duration of the intervention influences the results obtained, in the Intervention 2 Group, which had the longest intervention, the results obtained in post-treatment were maintained, while in the Intervention 1 Group they were not, although the subjects did not return to their pre-treatment weights. The hypertensive patients who received a group self-control cognitive behavioral intervention with a longer duration retained their post-treatment achievements. While those who received the intervention for a shorter time put weight back on, even if they did not their return to their baseline levels. Hypothesis 3. The greater the degree of compliance by the subjects with the self-control rules, the greater the weight loss; this is true for both diet and physical activity self-control rules. The subjects who obtained a higher weighted score for diet self-control rules log completion lost more weight than those who had a lower score. The subjects with a higher weighted score for the activity self-control rules log completion lost more weight than those with a lower score. Hypothesis 4. The greater the number of weeks over which the subjects complied with the self-control rules, the greater the weight loss, which is true for both the diet self-control rules as well as for the physical activity rules. Subjects who logged the self-control rules for longer lost more weight than those who logged them for less time. The subjects who logged the activity rules for longer lost more weight than those who logged them for less time. V. CONCLUSION Differences can be observed in the intervention groups as regards weight loss between pre-treatment and post-treatment, while, in the control group this loss does not occur and even increases slightly post- treatment. There are differences in maintaining the results obtained during the intervention, since the Intervention 2 Group, which received the same intervention as the Intervention 1 Group, but for a longer period of time, maintained the weight loss achieved at the post-treatment measurement (even losing more weight) at follow-up. The Intervention 1 Group, on the other hand, did not maintain the weight loss, although it did not return to the
  • 9. American Research Journal of Humanities Social Science (ARJHSS)R) 2021 ARJHSS Journal www.arjhss.com Page | 90 pretreatment weight. We consider that the subjects not only had to learn to change their habits, but they needed a time when they had support that helps them to consolidate these changes, so a longer intervention period favored the consolidation of their achievements. That the longer duration program was more effective in maintaining weight loss on follow-up is undoubtedly the most novel conclusion of our study. The completion of the self-recorded logs by the subjects correlates positively with weight loss, with greater loss the better the logging and the more weeks it was performed for. The scope of the study has demonstrated that follow-up to medical advice on weight loss can be improved in overweight hypertensive patients. These patients are advised to follow a specific diet, which they do not know how to carry out, we intervened by teaching them how to plan their menus in terms of composition and quantity, this aspect is especially relevant since, being people at risk, they cannot simply follow one of the many diets to which we all have access through the varied information we all receive on a daily basis. In addition, our study highlights the possibilities within Primary Care of multidisciplinary treatment, involving physicians, nurses and psychologists to care for hypertensive patients, who need to lose weight to control their hypertension, for which it is essential that patients are trained and have sufficient skills to do so, which has been achieved in this cognitive-behavioral self-control intervention. It should also be stressed that in this study we have seen the possibilities of self-control to help self- manage disease, in this case weight loss, in essential hypertensive patients, as recommended by the WHO in relation to chronic diseases6. Limitations: the most significant relates to the limited number of experimental subjects, the study should be repeated over a longer period and with more subjects. Recommendation: the current recording of physical activity through smart watches and similar devices, which provide information on heart rate, calories burned, step count, pace, distance traveled, etc. in different exercises, represent a real advance and will greatly facilitate the self-recording of physical activity, so we recommend their use in future studies. REFERENCES [1] WHO (April 22, 2021) https://www.who.int/data/global-health-estimates#Hypertension (who.int) [2] WHO (April 2013) A global brief on hypertension [3] Schmidt, J., Cruz, F., C., Villaverde, D., Prados, M.P., García, A., Muñoz, A., Pappous, A., (2006) Adherencia terapéutica en hipertensos. Estudio cualitativo. Index Enferm, 15 (54) http://scielo.isciii.es/scielo.php?script=sci_arttext&pid=S1132- 12962006000200005versión On-line ISSN 1699-5988versión impresa ISSN 1132-1296 [4] Márquez, E., Gil, V., Casado, JJ., Martel, N., De la Figuera, M., Martín, JL., Atienza, F., Gros, T., Espinosa, J., (2006) Análisis de los estudios publicados sobre el incumplimiento terapéutico en el tratamiento de la hipertensión arterial en España entre los años 1984 y 2005. Atención Primaria, 38 (6) 325-332, ISSN 0212-6567, https://doi.org/10.1157/13093369. (http://www.sciencedirect.com/science/article/pii/S0212656706705121) [5] FDA (March, 2020). Sodium in Your Diet. Retrieved on April 28, 2021 from https://www.fda.gov/food/nutrition-education-resources-materials/sodium-your-diet [6] WHO (2005) Preparing a Health Care Workforce for the 21 st Century: The Challenge of Chronic Conditions. https://www.who.int/publications/list/chp_workforce_report/es/ [7] Organización Panamericana de la Salud (1990). La hipertensión arterial como problema de salud comunitario. Manual de normas operativas para un programa de control en los diferentes niveles de atención. Oficina Sanitaria Panamericana, Oficina Regional de la ORGANIZACIÓN MUNDIAL DE LA SALUD ISBN 92 75 71025 [8] Mischel, W. (2014). The Marshmallow Test. Little Brown Book. [9] Rehm, L.P., (1995) Métodos de autocontrol. En V.C. Caballo. (Ed.), Manual de técnicas de terapia y modificación de conducta. (págs. 655-683) Siglo XXI de España editores S.A. [10] Grzib, G., Fernández, J.L., Ortega, R., &Brengelman, J.C. (1989) Intervención psicológica de apoyo al régimen médico: un estudio piloto con enfermos hipertensos. Revista de Psicol. Gral. Y Aplicada, 2,223-249. [11] Arrivillaga M., Varela, M.T.; Cáceres D.E., Correa, D. y Holguín L.D. (2007) Eficacia de un programa cognitivo conductual para la disminución de los niveles de presión arterial. Pensamiento Psicológico, vol.3, Nº 9: 33-49 [12] Appel, L., Champagne, C., Harsha, D., Cooper, L., Obarzanek, E., Elmer, P.J., Stevens, V.J., Vollmer, W.M., Lin, P.H., Svethey, L.P., Stedman, S.W. & Young, D.R. (2003). Effects of comprehensive lifestyle modification on blood pressure control: main results of the Premier clinical trial. JAMA, 289 (16), 2083-2094. [13] WHO (2004) Adherence to long-term therapies: evidence for action.
  • 10. American Research Journal of Humanities Social Science (ARJHSS)R) 2021 ARJHSS Journal www.arjhss.com Page | 91 [14] Paz, M., Sanz, J. & Labrador, F. (2004) Blood pressure variability and stress management training for essential hypertension. Behavioral Medicine, 30 (2), 53-62. [15] Holguín, L., Correa, D., Arrivillaga, M., Cáceres, D. y Varela, M. (2006).Adherencia al tratamiento de hipertensión arterial: efectividad de un programa de intervención Biopsicosocial. Univ. Psychol. Bogota 5 (3), 511-548. Recuperado en: <http://revistas.javeriana.edu.co/index.php/revPsycho/article/view/459>. [16] Sánchez-Benito, J.L., Pontes Torrado, Y. y González Rodríguez, A. (2012) La intervención de pérdida de peso conlleva una disminución significativa de la presión arterial y del colesterol. Clínica e investigación en arterioesclerosis, 24 (5), 1055-1070 [17] American Dietetic Association (1992). Handbook of Clinical Dietetics (2th ed.). Yale University Press. [18] Minitab Blog Editor (18 de abril 2019). Análisis de Regresión: ¿Cómo puedo interpretar el R- cuadrado y evaluar la bondad de ajuste? Recuperado el 12 de febrero de 2021 de https://blog.minitab.com/es/analisis-de-regresion-como-puedo-interpretar-el-r-cuadrado-y-evaluar-la- bondad-de-ajuste