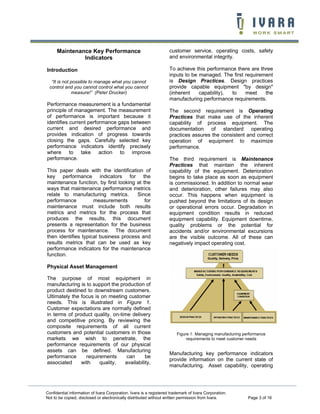
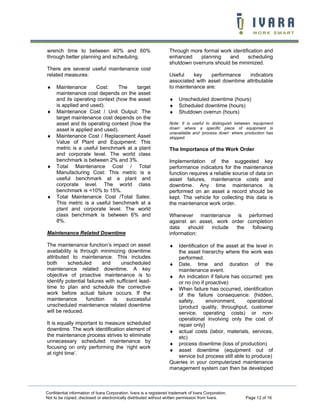
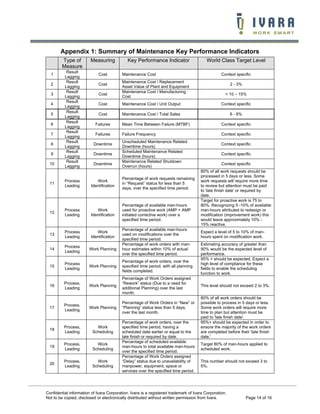
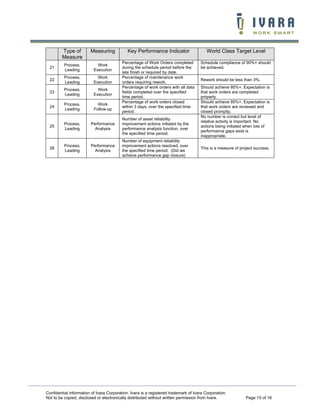
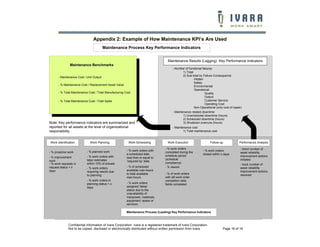
SlideShare a Scribd company logo
1 of 16
Download to read offline
KEY PERFORMANCE
INDICATORS
Measuring and Managing the Maintenance
Function
November 2005

Written by:

Al Weber
Reliability Consultant, Ivara
Ron Thomas
Director of Reliability Practices, Dofasco
IVARA CORPORATION
935 Sheldon Court,
Burlington Ontario. Canada. L7L 5K6

Confidential information of Ivara Corporation. Ivara is a registered trademark of Ivara Corporation.
Not to be copied, disclosed or electronically distributed without written permission from Ivara.
Copyright © 2005 Ivara Corporation. All rights reserved.
Information in this document is confidential.
No part of this document may be reproduced, stored in
a retrieval system or transmitted in any form or any
means electronic or mechanical, including
photocopying for any purpose other than as agreed
without permission of
Ivara Corporation.

Ivara Corporation
935 Sheldon Court
Burlington, Ontario
Canada. L7L 5K6
Toll free: 1-877-746-3787
Tel: 905-632-8000
Fax: 905-632-5129
www.ivara.com

Confidential information of Ivara Corporation. Ivara is a registered trademark of Ivara Corporation.
Not to be copied, disclosed or electronically distributed without written permission from Ivara.
Maintenance Key Performance
Indicators
Introduction
“It is not possible to manage what you cannot
control and you cannot control what you cannot
measure!” (Peter Drucker)

Performance measurement is a fundamental
principle of management. The measurement
of performance is important because it
identifies current performance gaps between
current and desired performance and
provides indication of progress towards
closing the gaps. Carefully selected key
performance indicators identify precisely
where to take action to improve
performance.
This paper deals with the identification of
key performance indicators for the
maintenance function, by first looking at the
ways that maintenance performance metrics
relate to manufacturing metrics.
Since
performance
measurements
for
maintenance must include both results
metrics and metrics for the process that
produces the results, this document
presents a representation for the business
process for maintenance. The document
then identifies typical business process and
results metrics that can be used as key
performance indicators for the maintenance
function.

customer service, operating costs, safety
and environmental integrity.
To achieve this performance there are three
inputs to be managed. The first requirement
is Design Practices. Design practices
provide capable equipment "by design"
(inherent
capability),
to
meet
the
manufacturing performance requirements.
The second requirement is Operating
Practices that make use of the inherent
capability of process equipment. The
documentation of standard operating
practices assures the consistent and correct
operation of equipment to maximize
performance.
The third requirement is Maintenance
Practices that maintain the inherent
capability of the equipment. Deterioration
begins to take place as soon as equipment
is commissioned. In addition to normal wear
and deterioration, other failures may also
occur. This happens when equipment is
pushed beyond the limitations of its design
or operational errors occur. Degradation in
equipment condition results in reduced
equipment capability. Equipment downtime,
quality problems or the potential for
accidents and/or environmental excursions
are the visible outcome. All of these can
negatively impact operating cost.

Physical Asset Management
The purpose of most equipment in
manufacturing is to support the production of
product destined to downstream customers.
Ultimately the focus is on meeting customer
needs. This is illustrated in Figure 1.
Customer expectations are normally defined
in terms of product quality, on-time delivery
and competitive pricing. By reviewing the
composite requirements of all current
customers and potential customers in those
markets we wish to penetrate, the
performance requirements of our physical
assets can be defined. Manufacturing
performance
requirements
can
be
associated
with
quality,
availability,

Figure 1: Managing manufacturing performance
requirements to meet customer needs

Manufacturing key performance indicators
provide information on the current state of
manufacturing. Asset capability, operating

Confidential information of Ivara Corporation. Ivara is a registered trademark of Ivara Corporation.
Not to be copied, disclosed or electronically distributed without written permission from Ivara.

Page 3 of 16
practices and the maintenance of asset
condition all contribute to the ability to meet
these performance requirements.
Some typical key performance indicators for
manufacturing include operating cost; asset
availability, lost time injuries, number of
environmental incidents, OEE and asset
utilization.
Consider asset utilization, as depicted in
Figure 2. Asset utilization is a manufacturing
level key performance indicator. It is a
function of many variables. For example,
asset utilization is impacted by both
maintenance and non-maintenance related
downtime.
Non-maintenance
related
downtime may be attributed to lack of
demand, an interruption in raw material
supply or production scheduling delays
beyond the control of the maintenance
function. Asset utilization is also a function
of operating rate, quality and yield losses,

etc. In each of these areas maintenance
may be a factor but it is not the only
contributor. In order to maintain and improve
performance
each
function
in
the
organization must focus on the portion of the
indicators that they influence.
Similarly,
other
manufacturing
level
performance indicators are not only a
function of maintenance. They are affected
by causes beyond the control of the
maintenance function. Asset capability,
operating practices and the maintenance of
asset condition all contribute to the ability to
meet performance requirements. If a
manufacturing level indicator is used to
measure
maintenance
performance,
improved maintenance may not result in a
proportional
improvement
in
the
manufacturing metric. For instance, in the
asset utilization example, cited above, the
maintenance contributors may all be positive
and yet the resulting asset utilization may
not improve due to other causes.
A key principle of performance management
is to measure what you can manage. In
order
to
maintain
and
improve
manufacturing performance each function in
the organization must focus on the portion of
the
indicators
that they
influence.
Maintenance performance contributes to
manufacturing performance. The key
performance indicators for maintenance are
children
of
the
manufacturing
key
performance indicators.

Figure 2: Asset Utilization is an example of a
manufacturing level key performance indicator.

Key performance indicators for maintenance
are selected ensuring a direct correlation
between the maintenance activity and the
key performance indicator measuring it.
When defining a key performance indicator
for maintenance a good test of the metric
validity is to seek an affirmative response to
the question; “If the maintenance function
does ‘everything right’, will the suggested
metric always reflect a result proportional to
the change; or are there other factors,
external to maintenance, that could mask
the improvement?”
This paper focuses on defining key
performance indicators for the maintenance
function, not the maintenance organization.

Confidential information of Ivara Corporation. Ivara is a registered trademark of Ivara Corporation.
Not to be copied, disclosed or electronically distributed without written permission from Ivara.

Page 4 of 16
Figure 3: The Asset Reliability Process identifies what's required to manage the maintenance function.

The maintenance function can involve other
departments beyond the maintenance
organization. Similarly, the maintenance
department has added responsibilities
beyond the maintenance function and, as
such, will have additional key performance
indicators to report. The key performance
indicators for the maintenance organization
may include key performance indicators for
other areas of accountability such as health
and
safety
performance,
employee
performance management, training and
development, etc.
The Asset Reliability Process
The management of physical asset
performance is integral to business success.
What we manage are the business
processes required to produce results. One
of these business processes is responsible
for the maintenance of physical asset
reliability. The Asset Reliability Process is
shown in Figure 3. It is an integral part of a
much larger business process responsible
for managing the total enterprise.

A proactive Asset Reliability Process,
represented by the seven (7) elements in
the model aims to deliver the performance
required by the enterprise to meet all of its
corporate objectives. Each element within
the maintenance process is in itself a subprocess. A brief description of each element
follows:
Business Focus, represented by the green
box on the left, focuses the maintenance of
physical asset reliability on the business
goals of the company. The potential
contribution of the asset base to these goals
is evaluated. The largest contributors are
recognized as critical assets and specific
performance targets identified.
Work Identification, as a process,
produces technically based Asset Reliability
Programs. Program activities identify and
control failure modes impacting on the
equipment's ability to perform the intended
function at the required performance level.
Activities are evaluated to judge if they are
worth doing based on the consequences of
failure.

Confidential information of Ivara Corporation. Ivara is a registered trademark of Ivara Corporation.
Not to be copied, disclosed or electronically distributed without written permission from Ivara.

Page 5 of 16
Planning develops procedures and work
orders for these work activities. The
procedures identify resource requirements,
safety precautions and special work
instructions required to execute the work.
Scheduling evaluates the availability of all
resources required for work "due" in a
specified time frame. Often this work
requires the equipment to be shut down. A
review of production schedules is required.
Resources are attached to a specific work
schedule. The use of resources is balanced
out.
In the Execution process, trained,
competent personnel carry out the required
work.
The Follow-up process responds to
information collected in the execution
process. Work order completion comments
outline what was done and what was found.
Actual time and manpower, to complete the
job, is documented. Job status is updated as
complete or incomplete. Corrective work
requests, resulting from the analysis of
inspection data, are created. Requests are
made for changes to drawings and
procedures.
The process of Performance Analysis
evaluates
maintenance
program
effectiveness. Gaps between actual process
performance and the required performance
are identified. Historical maintenance data is
compared
to
the
current
process
performance. Maintenance activity costs are
reviewed. Significant performance gaps are
addressed
by
revisiting
the
Work
Identification function.
Each element is important to provide an
effective maintenance strategy. Omitting any
element will result in poor equipment
performance, increased maintenance costs
or both.
For
example,
Work
Identification
systematically identifies the Right Work to
be performed at the Right Time. Without
proper Work Identification, maintenance
resources may be wasted. Unnecessary or
incorrect work will be planned. Once

executed, this work may not achieve the
desired performance results, despite
significant maintenance costs. Without
Planning the correct and efficient execution
of the work is left to chance. The Planned
Maintenance
Process
is
a
cycle.
Maintenance work is targeted to achieve
required
asset
performance.
Its
effectiveness is reviewed and improvement
opportunities identified. This guarantees
continuous
improvement
in
process
performance impacted by Maintenance.
Within the Planned Maintenance Process
two
internal
loops
exist.
Planning,
Scheduling, Execution and Follow Up make
up the first loop. Once maintenance
activities are initially identified, an asset
maintenance program, based on current
knowledge and requirements, is initiated.
The selected maintenance activities will be
enacted upon at the designed frequency and
maintenance tolerance limits. The process is
self-sustaining.
The second loop consists of the Work
Identification and Performance Analysis
elements.
This
is
the
continuous
improvement
loop.
Actual
asset
performance is monitored relative to the
required performance (driven by business
needs). Performance gaps are identified.
The ‘cause’ of these gaps is established and
corrective action recommended.
Performance Metrics for the Maintenance
Function
The Asset Reliability Process represents the
collection of ‘all’ tasks required to support
the maintenance function. The process is a
supply chain. If a step in the process is
skipped, or performed at a substandard
level, the process creates defects known as
failures. The output of a healthy reliability
process is optimal asset reliability at optimal
cost.
Asset Reliability Process measures are
leading indicators. They monitor if the tasks
are being performed that will ‘lead to
results’. For example a leading process
indicator would monitor if the planning
function was taking place. If people are

Confidential information of Ivara Corporation. Ivara is a registered trademark of Ivara Corporation.
Not to be copied, disclosed or electronically distributed without written permission from Ivara.

Page 6 of 16
doing all the right things then the results will
follow. The leading ‘process’ indicators are
more immediate than results measures.
Result measures monitor the products of the
Asset Reliability Process. Result measures
include maintenance cost (as a contributor
to total operating cost), asset downtime due
to planned and unplanned maintenance (as
a contributor to availability) and number of
failures on assets (the measure of reliability:
this can then be translated into mean time
between failures). Results measures lag.
Failure is a good example. Typically the
same piece of equipment doesn’t fail day
after day. Take a pump for example. Say the
pump fails on average once every 8 months.
If we improve its reliability by 50% it will now
fail every 12 months. You have to wait at
least 12 months to see the improvement.
Key performance indicators for the
maintenance function need to include both
leading (maintenance process) measures
and lagging (result) measures. This paper
focuses on identifying both leading and
lagging
measures
of
maintenance
performance.
Collectively,
these
measurements are the key performance
indicators for the maintenance function.
Reliability Process Key Performance
Indicators – Leading Measures
The maintenance process is made up of
elements. All elements are required to
complete the supply chain. Key performance
indicators of the maintenance process are
process assurance measures. They answer
the question ‘how do I know that this
maintenance process element is being
performed well?’ The day-to-day execution
of maintenance is addressed through the
seven elements of the Reliability Process;
Business Focus, Work Identification, Work
Planning,
Work
Scheduling,
Work
Execution, Follow-up and Performance
Analysis. Key performance indicators for
each element are recommended.
It should be noted that variations of these
metrics may be defined or additional
performance metrics may be used. The
metrics presented here provide a clear

indication if the requirements of each
element are being satisfied and, if not, what
action should be taken to correct the lack of
maintenance process adherence.
Work Identification
The function of work identification is to
identify the ‘right work at the right time.
1. Work Requests
Initiating a work request is one method of
identifying work. Once a work request is
submitted it must be reviewed, validated and
approved before it becomes an actual work
order ready to be planned. If the work
request process is performing well, the
validation and approval/rejection of work
requests should occur promptly.
A suggested measure for the work request
process is:
♦

The percentage of work requests
remaining in “Request” status for less
than 5 days, over a specified time period
(for example the last 30 days). The
world class maintenance expectation is
that most work (>80%) requests would
be reviewed and validated within a
maximum of 5 days.

Work requests rely on the random
identification of problems or potential
problems and bringing them to the attention
of maintenance to address them. In a world
class organization, work identification is not
left to chance.
2. Proactive Work
The ‘Asset Maintenance Program’ is
designed to identify potential failure
conditions, changes in state of hidden
functions and known age related failure
causes. The development of the Asset
Maintenance Program defines the routine
maintenance tasks that must be executed to
achieve the performance levels required to
meet business requirements. If the ‘Asset
Maintenance Program’ is effective, it will
successfully identify and address most
maintenance preventable causes of failure.

Confidential information of Ivara Corporation. Ivara is a registered trademark of Ivara Corporation.
Not to be copied, disclosed or electronically distributed without written permission from Ivara.

Page 7 of 16
If the ‘Work Identification’ function is working
well, the majority of work performed by
maintenance would consist of executing the
Asset Maintenance Program (AMP) tasks
and the corrective work originating from it.

♦

The key performance indicator for the work
identification element is:
♦

The percentage of available man-hours
used for proactive work (AMP + AMP
initiated corrective work) over a specified
time period. The world class maintenance
target for proactive work is 75 to 80%.
Recognizing that 5 -10% of available manhours should be attributed to improvement
work (non-maintenance) this would leave
approximately 10% - 15% reactive work.
Work Planning
The primary function of the Work Planning
element of the maintenance process is to
prepare the work to achieve maximum
efficiency in execution.

5. Quality of Planning
These key performance indicators for
planning do not reflect the quality of the
planning being done. A critical aspect of
planning is estimating resources. The quality
of planning can be measured by monitoring
the accuracy of estimating. Labor and
material resources are the dominant
resources specified on a work order.
The accuracy of estimating labor can be
measured by:
♦

3. Amount of Planned Work
In general terms, planning defines how to do
the job and identifies all the required
resources and any special requirements to
execute the work. A properly planned work
order would include all this information.
Maximizing maintenance efficiency requires
a high percentage of planned work.
A measure of whether planning is taking
place is:
♦

The percentage of all work orders, over
a specified time period, with all the
planning fields completed (ex. Labor
assignments, task durations, work
priority, required by date, etc). The world
class expectation is that >95% of all jobs
should be planned.

4. Responsiveness of Planning
Another key performance indicator for
planning is the time it takes a work order to
be planned. A suggested measure of this is:

The percentage of work orders in
‘planning status’ for less than 5 days,
over a specified time period. A world
class performance level of at least 80%
of all work orders processed in 5 days or
less should be possible. Some work
orders will require more time to plan but
attention must be paid to 'late finish or
required by date'.

The percentage of work orders with
man-hour estimates within 10% of
actual over the specified time period.
Estimating accuracy of greater than
90% would be the expected level of
world class maintenance performance.

A second metric of planning quality,
addressing material estimates, would be:
♦

The percentage of planned, scheduled
and assigned work orders, where
execution is delayed due to the need for
materials (spare parts) over the
specified time period. The world class
maintenance expectation is that less
than 2% of all work assigned will have a
material
deficiency
(due
to
planning).Note: this assumes the job
should not have been scheduled if the
materials were not available. Therefore,
the problem is that the work order did
not account for all the required
materials.

Work Scheduling
Good planning is a prerequisite to
scheduling. The primary function of
scheduling is to coordinate the availability of

Confidential information of Ivara Corporation. Ivara is a registered trademark of Ivara Corporation.
Not to be copied, disclosed or electronically distributed without written permission from Ivara.

Page 8 of 16
the asset(s) to be maintained with all the
required resources; labor, material and
services creating a schedule to execute ‘the
right work at the right time’. The schedule is
a contract between operations and
maintenance. The ‘right work at the right
time’ implies that this work must be
executed within the specified time period to
achieve the desired level of performance.
Failure to execute within the schedule period
will increase the risk of failure.
With good work identification, planning and
scheduling in place, the weekly maintenance
schedule should be produced several days
in advance of the beginning of the schedule
period. There should be confidence that this
schedule reflects the work that will be
completed through the schedule period.
6. Quality of Scheduling
A key performance
scheduling function is:
♦

for

the

The percentage of work orders, over the
specified time period, that have a
scheduled date earlier or equal to the
‘late finish or required by date’. A world
class maintenance target of >95%
should be expected in order to ensure
the majority of the work orders are
completed before their 'late finish or
required-by date.'

A second measure
scheduling is:
♦

indicator

of

the

quality

♦

The percentage of scheduled available
man-hours to total available man-hours
over the specified time period. A world
class target of >80% of man-hours
should be applied to scheduled work.
It is not desirable to schedule 100% of
available man-hours within a schedule
period, because we recognize that additional
work will arise after the schedule has been
cast. This includes both emergency work
and other schedule write-ins that must be
accommodated during the schedule period.
Work Execution
Work execution begins with the assignment
of work to the people responsible for
executing it and ends when the individuals
charged with responsibility for execution
provide feedback on the completed work.
7. Schedule Compliance
With a high quality of work identification,
planning and scheduling, maintenance
resources should execute according to the
plan and schedule. Therefore, a key
performance indicator of execution is
schedule compliance. Schedule compliance
is defined as:
♦

of

The percentage of work orders assigned
“Delay” status due to unavailability of
manpower,
equipment,
space
or
services over the specified time period.

Volume of Scheduled Work
The scheduling of properly planned work is
also important to maximize maintenance
efficiency. We would anticipate that a high
percentage of the available maintenance
man-hours would be committed to a
schedule. A second scheduling key
performance indicator measures:

The percentage of work orders
completed during the schedule period
before the late finish or required by date.
World class maintenance should
achieve >90% schedule compliance
during execution.

8. Quality of Work Execution
Work execution quality is measured by:
♦

The percentage of rework. World class
levels of maintenance rework are less
than 3%.

9. Work Order Completion
The purpose of identifying maintenance
process key performance indicators is to
help manage the maintenance process. The
ability to successfully monitor and manage
the process and measure the results of the
process is highly dependent on gathering

Confidential information of Ivara Corporation. Ivara is a registered trademark of Ivara Corporation.
Not to be copied, disclosed or electronically distributed without written permission from Ivara.

Page 9 of 16
correct information during work execution.
The vehicle for collecting this information is
the work order. Work orders should account
for ‘all’ work performed on assets. This is
necessary to gather accurate maintenance
cost and history data, enabling the
management of the physical asset through
its life cycle.
A returned work order should indicate the
status of the job (complete, incomplete), the
actual labor and material consumed, an
indication of what was done and/or what
was found and recommendations for
additional work. In addition, information
about process and equipment downtime and
an indication of whether the maintenance
conducted was in response to a failure
should be provided.
The idea that the job is not done until the
work order is completed and returned is a
significant challenge to many organizations.
For this reason it is also important to have a
key performance indicator on work order
completion. This metric should look at:
♦

The percentage of work orders turned in
with all the data fields completed. World
class
maintenance
organizations
achieve 95% compliance.

should be reviewed and closed within 3
days.
Performance Analysis
The performance analysis element of the
maintenance
process
evaluates
maintenance effectiveness by focusing on
key performance indicators of maintenance
results. Gaps between the actual and
required performance of the maintained
asset are identified. Significant performance
gaps are addressed by initiating work
identification improvement actions to close
the performance gap.
11. Presence of Performance Analysis
One indication that performance analysis is
being executed is the existence of the
maintenance result metrics described under
the next section of this paper entitled key
performance indicators of maintenance
effectiveness (result measures).
12. Quality of Performance Analysis
From a maintenance process perspective it
is important that these results are driving
action. Therefore, a key performance
indicator for performance analysis is a
measure of:

Follow-up

♦

In the Follow-up element of the maintenance
process, actions are initiated to address the
information identified during execution.
Some key follow-up tasks include reviewing
work order comments and closing out
completed work orders, initiating corrective
work and initiating part and procedural
updates as required.

♦

The number of reliability improvement
actions initiated through performance
analysis during the specified period. No
absolute number is correct but no
number suggests inaction.
A second measure is the number of
asset reliability actions resolved over the
last month. In other words, a measure of
how successful the organization is in
performance gap closure.

10. Work Order Closure
Timely follow-up and closure of completed
work orders is essential to maintenance
success. A key performance indicator for
follow-up is:
♦

The percentage of work orders closed
within a maximum of 3 days, over the
specified time period. The expectation is
that >95% of all completed work orders

Key Performance Indicators of
Maintenance Effectiveness (Result
Measures)
The product of maintenance is reliability. A
reliable asset is an asset that functions at
the level of performance that satisfies the
needs of the user. Reliability is assessed by
measuring failure.

Confidential information of Ivara Corporation. Ivara is a registered trademark of Ivara Corporation.
Not to be copied, disclosed or electronically distributed without written permission from Ivara.

Page 10 of 16
Failures
The primary function of maintenance is to
reduce or eliminate the consequences of
physical asset failures. The definition of
functional failure is anytime that asset
performance falls below its required
performance. Therefore a key performance
indicator for maintenance effectiveness is
some measurement of failure on the
asset(s). If the maintenance function is
effective, failures on critical assets and thus
their consequences should be reduced or
eliminated.
Failure consequence impacts manufacturing
level key performance indicators. Failure
classification by consequence identifies the
contribution of maintenance function to
manufacturing level performance.
Failure consequences are classified into the
following categories:
1. Hidden Consequence – there is no
direct consequence of a single point
failure other than exposure to the
increased risk of a multiple failure (a
second failure has to occur to
experience a consequence).
2. Safety Consequence – a single point
failure results in a loss of function or
other damage which could injure or kill
someone.
3. Environmental Consequence –a single
point failure results in a loss of function
or other damage which breaches any
known environmental standard or
regulation;
4. Operational Consequence – a single
point failure has a direct adverse effect
on operational capability (output,
product quality, customer service or
operating costs in addition to the direct
cost of repair).
5. Non-Operational Consequence – a
single point failure involving only the
cost of repair.
Therefore, it is important to track:

♦

The number and frequency of asset
failures by area of consequence. There
is no universal standard for this metric
because of the diversity of industries
and even plants within industry
segments. It is however reasonable to
expect a downward trend and to set
reduction targets based on current
performance levels and business needs.

Maintenance Costs
Maintenance costs are another direct
measure of maintenance performance.
Maintenance costs are impacted by both
maintenance
effectiveness
and
the
efficiency with which maintenance is
performed.
Maintenance maximizes its effectiveness by
ensuring that it performs “The Right Work at
the Right Time”. Proactive maintenance
means intervening before the failure event
occurs.
The impact of proactive
maintenance is not only to minimize the
safety, environmental and operational
consequences of failure but also to reduce
the cost of maintenance by reducing
secondary damage. For example, if the
potential failure of a pump bearing was
detected proactively, the catastrophic failure
of the bearing could be prevented. The
catastrophic failure of the pump bearing
would likely result in damage to the casing,
wear rings, impeller, mechanical seals, etc.
The corrective repair would require an
extensive pump rebuild. Utilizing a proactive
task such as vibration monitoring to detect
the bearing deterioration permits the
scheduled replacement of the bearing prior
to the occurrence of secondary damage.
Less secondary damage means that it takes
less time to repair (labor savings) and
consumes fewer parts (material savings).
The overall effect is the repair costs much
less.
Maintenance costs are also impacted by
increasing the efficiency of maintenance.
These efficiency gains are achieved through
improved planning and scheduling of “the
right work at the right time”. Published data
suggests that companies with estimated
wrench times of 25% to 30% can increase

Confidential information of Ivara Corporation. Ivara is a registered trademark of Ivara Corporation.
Not to be copied, disclosed or electronically distributed without written permission from Ivara.

Page 11 of 16
wrench time to between 40% and 60%
through better planning and scheduling.
There are several useful maintenance cost
related measures:
♦

♦

♦

♦

♦

Maintenance
Cost:
The
target
maintenance cost depends on the asset
and its operating context (how the asset
is applied and used).
Maintenance Cost / Unit Output: The
target maintenance cost depends on the
asset and its operating context (how the
asset is applied and used).
Maintenance Cost / Replacement Asset
Value of Plant and Equipment: This
metric is a useful benchmark at a plant
and corporate level. The world class
benchmark is between 2% and 3%.
Total Maintenance Cost / Total
Manufacturing Cost: This metric is a
useful benchmark at a plant and
corporate level. The world class
benchmark is <10% to 15%.
Total Maintenance Cost /Total Sales:
This metric is a useful benchmark at a
plant and corporate level. The world
class benchmark is between 6% and
8%.

Maintenance Related Downtime
The maintenance function’s impact on asset
availability is through minimizing downtime
attributed to maintenance. This includes
both
scheduled
and
unscheduled
maintenance related downtime. A key
objective of proactive maintenance is to
identify potential failures with sufficient leadtime to plan and schedule the corrective
work before actual failure occurs. If the
maintenance
function
is
successful
unscheduled maintenance related downtime
will be reduced.
It is equally important to measure scheduled
downtime. The work identification element of
the maintenance process strives to eliminate
unnecessary scheduled maintenance by
focusing on only performing the ‘right work
at right time’.

Through more formal work identification and
enhanced
planning
and
scheduling
shutdown overruns should be minimized.
Useful
key
performance
indicators
associated with asset downtime attributable
to maintenance are:
♦
♦
♦

Unscheduled downtime (hours)
Scheduled downtime (hours)
Shutdown overrun (hours)

Note: It is useful to distinguish between ‘equipment
down’ where a specific piece of equipment is
unavailable and ‘process down’ where production has
stopped.

The Importance of the Work Order
Implementation of the suggested key
performance indicators for the maintenance
function requires a reliable source of data on
asset failures, maintenance costs and
downtime. Any time maintenance is
performed on an asset a record should be
kept. The vehicle for collecting this data is
the maintenance work order.
Whenever maintenance is performed
against an asset, work order completion
data
should
include
the
following
information:
♦

Identification of the asset at the level in
the asset hierarchy where the work was
performed.
♦ Date, time and duration of the
maintenance event.
♦ An indication if failure has occurred: yes
or no (no if proactive)
♦ When failure has occurred, identification
of the failure consequence: {hidden,
safety,
environment,
operational
(product quality, throughput, customer
service, operating costs) or nonoperational involving only the cost of
repair only}
♦ actual costs (labor, materials, services,
etc)
♦ process downtime (loss of production)
♦ asset downtime (equipment out of
service but process still able to produce)
Queries in your computerized maintenance
management system can then be developed

Confidential information of Ivara Corporation. Ivara is a registered trademark of Ivara Corporation.
Not to be copied, disclosed or electronically distributed without written permission from Ivara.

Page 12 of 16
to track and report key performance
indicators for asset failure, maintenance
costs and downtime.
Reporting and Use of Key Performance
Indicators
Maintenance
and
reliability
business
process metrics (leading indicators) provide
a clear indication of compliance to the
maintenance business process. They
indicate where to take specific action
because of a gap in the way maintenance is
being performed. This gap in the execution
of the maintenance process will ‘eventually’
lead to asset failure(s). The consequence of
these
failures
translates
into
poor
manufacturing performance.
These key performance indicators should be
aligned
with
defined
roles
and
responsibilities for the maintenance function
against the assets for which they apply.
For example, a planner responsible for ‘Area
A’ would be responsible for the planning
function key performance indicators for the
‘Area A’ assets.
The manager responsible for ‘Area A’ assets
would monitor all process and result metrics
for Area A. Each metric should roll up the
asset hierarchy, in alignment with individual
responsibility for the assets. Management
action is directed at improving compliance
with the requirements of Work Identification,
Planning, Scheduling, Execution and Followup. In this way, the process is managed
leading to world class results. This logic is
repeated at each level of management in the
organization. At the plant and/or corporate
level,
management
is
exercising
accountability for plant-wide maintenance
metrics, both process and results.

Confidential information of Ivara Corporation. Ivara is a registered trademark of Ivara Corporation.
Not to be copied, disclosed or electronically distributed without written permission from Ivara.

Page 13 of 16
Appendix 1: Summary of Maintenance Key Performance Indicators
Type of
Measure
1
2
3
4
5
6
7
8
9
10

Result
Lagging
Result
Lagging
Result
Lagging
Result
Lagging
Result
Lagging
Result
Lagging
Result
Lagging
Result
Lagging
Result
Lagging
Result
Lagging

Measuring
Cost
Cost
Cost

Key Performance Indicator
Maintenance Cost
Maintenance Cost / Replacement
Asset Value of Plant and Equipment
Maintenance Cost / Manufacturing
Cost

World Class Target Level
Context specific
2 - 3%
< 10 – 15%

Cost

Maintenance Cost / Unit Output

Context specific

Cost

Maintenance Cost / Total Sales

6 - 8%

Failures

Mean Time Between Failure (MTBF)

Context specific

Failures

Failure Frequency

Context specific

Downtime
Downtime
Downtime

Unscheduled Maintenance Related
Downtime (hours)
Scheduled Maintenance Related
Downtime (hours)
Maintenance Related Shutdown
Overrun (hours)

11

Process
Leading

Work
Identification

Percentage of work requests remaining
in “Request” status for less than 5
days, over the specified time period.

12

Process
Leading

Work
Identification

Percentage of available man-hours
used for proactive work (AMP + AMP
initiated corrective work) over a
specified time period.

13

Process
Leading

Work
Identification

14

Process
Leading

Work Planning

15

Process
Leading

Work Planning

Percentage of work orders, over the
specified time period, with all planning
fields completed.

16

Process,
Leading

Work Planning

Percentage of Work Orders assigned
“Rework” status (Due to a need for
additional Planning) over the last
month.

17

Process,
Leading

Work Planning

Percentage of Work Orders in “New” or
“Planning” status less than 5 days,
over the last month.

18

Process,
Leading

Work
Scheduling

19

Process,
Leading

Work
Scheduling

20

Process,
Leading

Work
Scheduling

Percentage of available man-hours
used on modifications over the
specified time period.
Percentage of work orders with manhour estimates within 10% of actual
over the specified time period.

Percentage of work orders, over the
specified time period, having a
scheduled date earlier or equal to the
late finish or required by date.
Percentage of scheduled available
man-hours to total available man-hours
over the specified time period.
Percentage of Work Orders assigned
“Delay” status due to unavailability of
manpower, equipment, space or
services over the specified time period.

Context specific
Context specific
Context specific
80% of all work requests should be
processed in 5 days or less. Some
work requests will require more time
to review but attention must be paid
to 'late finish date' or required by
date.
Target for proactive work is 75 to
80%. Recognizing 5 -10% of available
man-hours attributed to redesign or
modification (improvement work) this
would leave approximately 10% 15% reactive.
Expect a level of 5 to 10% of manhours spent on modification work.
Estimating accuracy of greater than
90% would be the expected level of
performance.
95% + should be expected. Expect a
high level of compliance for these
fields to enable the scheduling
function to work.
This level should not exceed 2 to 3%.
80% of all work orders should be
possible to process in 5 days or less.
Some work orders will require more
time to plan but attention must be
paid to 'late finish date'.
95%+ should be expected in order to
ensure the majority of the work orders
are completed before their 'late finish
date.'
Target 80% of man-hours applied to
scheduled work.
This number should not exceed 3 to
5%.

Confidential information of Ivara Corporation. Ivara is a registered trademark of Ivara Corporation.
Not to be copied, disclosed or electronically distributed without written permission from Ivara.

Page 14 of 16
Type of
Measure

Measuring

Key Performance Indicator

World Class Target Level

21

Process,
Leading

Work
Execution

Percentage of Work Orders completed
during the schedule period before the
late finish or required by date.
Percentage of maintenance work
orders requiring rework.
Percentage of work orders with all data
fields completed over the specified
time period.
Percentage of work orders closed
within 3 days, over the specified time
period.

Schedule compliance of 90%+ should
be achieved.

22

Process,
Leading

Work
Execution

23

Process,
Leading

Work
Execution

24

Process,
Leading

Work
Follow-up

25

Process,
Leading

Performance
Analysis

Number of asset reliability
improvement actions initiated by the
performance analysis function, over
the specified time period.

26

Process,
Leading

Performance
Analysis

Number of equipment reliability
improvement actions resolved, over
the specified time period. (Did we
achieve performance gap closure)

Rework should be less than 3%.
Should achieve 95%+. Expectation is
that work orders are completed
properly.
Should achieve 95%+. Expectation is
that work orders are reviewed and
closed promptly.
No number is correct but level of
relative activity is important. No
actions being initiated when lots of
performance gaps exist is
inappropriate.
This is a measure of project success.

Confidential information of Ivara Corporation. Ivara is a registered trademark of Ivara Corporation.
Not to be copied, disclosed or electronically distributed without written permission from Ivara.

Page 15 of 16
Appendix 2: Example of How Maintenance KPI’s Are Used
Maintenance Process Key Performance Indicators
Maintenance Results (Lagging) Key Performance Indicators
Maintenance Benchmarks
- Maintenance Cost / Unit Output
- % Maintenance Cost / Replacement Asset Value
- % Total Maintenance Cost / Total Manufacturing Cost
- % Total Maintenance Cost / Total Sales

Note: Key performance indicators are summarized and
reported for all assets at the level of organizational
responsibility .
Work Identification

Work Planning

- % proactive work

- % planned work

- % improvement
work
- % work requests in
request status < x
days

- % work orders with
labor estimates
within 10% of actuals
- % work orders
requiring rework due
to planning
- % work orders in
planning status < x
days

Work Scheduling
- % work orders with
a scheduled date
less than or equal to
'required by' date.
- % of scheduled
available man-hours
to total available
man-hours
- % work orders
assigned 'delay'
status due to the
unavailability of
manpower, materials,
equipment, space or
services

- Number of functional failures
1) Total
2) Sub-total by Failure Consequence
Hidden
Safety
Environmental
Operational
Quality
Output
Customer Service
Operating Cost
Non-Operational (only cost of repair)
- Maintenance related downtime
1) Unscheduled downtime (hours)
2) Scheduled downtime (hours)
3) Shutdown overruns (hours)
- Maintenance cost
1) Total maintenance cost

Work Execution
- % work orders
completed during the
schedule period
(schedule
compliance)
- % rework

Follow-up
- % work orders
closed within x days

- % of work orders
with alll work order
completion data
fields completed

Performance Analysis
- trend number of
asset reliability
improvement actions
initiated
- track number of
asset reliability
improvement actions
resolved

Maintenance Process (Leading) Key Performance Indicators

Confidential information of Ivara Corporation. Ivara is a registered trademark of Ivara Corporation.
Not to be copied, disclosed or electronically distributed without written permission from Ivara.

Page 16 of 16

More Related Content

What's hot

Enterprise Asset Management Suite
Enterprise Asset Management SuiteEnterprise Asset Management Suite
Enterprise Asset Management SuiteInfor
 
Report of vocational training in jspl
Report of vocational training in jsplReport of vocational training in jspl
Report of vocational training in jsplAashish Chaudhary
 
Top Tips for Improving your Quality Management
Top Tips for Improving your Quality ManagementTop Tips for Improving your Quality Management
Top Tips for Improving your Quality ManagementClaire Healey
 
Plant Productivity Measurement, Analysis & Improvement: Business Case
Plant Productivity Measurement, Analysis & Improvement: Business CasePlant Productivity Measurement, Analysis & Improvement: Business Case
Plant Productivity Measurement, Analysis & Improvement: Business CaseMohammed Hamed Ahmed Soliman
 
Successful Implementation of ERP in a Large Organization
Successful Implementation of ERP in a Large OrganizationSuccessful Implementation of ERP in a Large Organization
Successful Implementation of ERP in a Large OrganizationTalib Imran
 
k10995 ashutosh yadav(Operation planning & control)
k10995 ashutosh yadav(Operation planning & control)k10995 ashutosh yadav(Operation planning & control)
k10995 ashutosh yadav(Operation planning & control)shailesh yadav
 
Presentation maintenence management
Presentation maintenence managementPresentation maintenence management
Presentation maintenence managementVaisakh S Babu
 
Sap Risk Advisory Service V1.0
Sap Risk Advisory Service V1.0Sap Risk Advisory Service V1.0
Sap Risk Advisory Service V1.0agc infotech
 
Ais Romney 2006 Slides 06 Control And Ais
Ais Romney 2006 Slides 06 Control And AisAis Romney 2006 Slides 06 Control And Ais
Ais Romney 2006 Slides 06 Control And AisSharing Slides Training
 
Assessment of ERP Implementation for a Car Dealership
Assessment of ERP Implementation for a Car DealershipAssessment of ERP Implementation for a Car Dealership
Assessment of ERP Implementation for a Car DealershipGhassan Kabbara
 
Simplify Business Process Management with Bonitasoft BPM
Simplify Business Process Management with Bonitasoft BPMSimplify Business Process Management with Bonitasoft BPM
Simplify Business Process Management with Bonitasoft BPMEvoke Technologies
 
Reliability and Maintenance in production Management
Reliability and Maintenance in production ManagementReliability and Maintenance in production Management
Reliability and Maintenance in production ManagementNazneen sheikh
 
A Manager's Guide to OEE (Overall Equipment Effectiveness)
A Manager's Guide to OEE (Overall Equipment Effectiveness)A Manager's Guide to OEE (Overall Equipment Effectiveness)
A Manager's Guide to OEE (Overall Equipment Effectiveness)OEEsystems International
 
benefits from calculating overall equipment effectivness
benefits from calculating overall equipment effectivnessbenefits from calculating overall equipment effectivness
benefits from calculating overall equipment effectivnessahmed_shimi
 
Understanding Hierarchical Asset Structures in CMMS
Understanding Hierarchical Asset Structures in CMMSUnderstanding Hierarchical Asset Structures in CMMS
Understanding Hierarchical Asset Structures in CMMSeMaint Enterprises
 

What's hot (20)

Enterprise Asset Management Suite
Enterprise Asset Management SuiteEnterprise Asset Management Suite
Enterprise Asset Management Suite
 
Report of vocational training in jspl
Report of vocational training in jsplReport of vocational training in jspl
Report of vocational training in jspl
 
Top Tips for Improving your Quality Management
Top Tips for Improving your Quality ManagementTop Tips for Improving your Quality Management
Top Tips for Improving your Quality Management
 
Why RCM Doesn't Work?
Why RCM Doesn't Work?Why RCM Doesn't Work?
Why RCM Doesn't Work?
 
Plant Productivity Measurement, Analysis & Improvement: Business Case
Plant Productivity Measurement, Analysis & Improvement: Business CasePlant Productivity Measurement, Analysis & Improvement: Business Case
Plant Productivity Measurement, Analysis & Improvement: Business Case
 
Successful Implementation of ERP in a Large Organization
Successful Implementation of ERP in a Large OrganizationSuccessful Implementation of ERP in a Large Organization
Successful Implementation of ERP in a Large Organization
 
Plant Maintenance
Plant MaintenancePlant Maintenance
Plant Maintenance
 
k10995 ashutosh yadav(Operation planning & control)
k10995 ashutosh yadav(Operation planning & control)k10995 ashutosh yadav(Operation planning & control)
k10995 ashutosh yadav(Operation planning & control)
 
Presentation maintenence management
Presentation maintenence managementPresentation maintenence management
Presentation maintenence management
 
Sap Risk Advisory Service V1.0
Sap Risk Advisory Service V1.0Sap Risk Advisory Service V1.0
Sap Risk Advisory Service V1.0
 
Ais Romney 2006 Slides 06 Control And Ais
Ais Romney 2006 Slides 06 Control And AisAis Romney 2006 Slides 06 Control And Ais
Ais Romney 2006 Slides 06 Control And Ais
 
Assessment of ERP Implementation for a Car Dealership
Assessment of ERP Implementation for a Car DealershipAssessment of ERP Implementation for a Car Dealership
Assessment of ERP Implementation for a Car Dealership
 
Effect of erp system
Effect of erp system Effect of erp system
Effect of erp system
 
Casa engl
Casa englCasa engl
Casa engl
 
Simplify Business Process Management with Bonitasoft BPM
Simplify Business Process Management with Bonitasoft BPMSimplify Business Process Management with Bonitasoft BPM
Simplify Business Process Management with Bonitasoft BPM
 
Reliability and Maintenance in production Management
Reliability and Maintenance in production ManagementReliability and Maintenance in production Management
Reliability and Maintenance in production Management
 
A Manager's Guide to OEE (Overall Equipment Effectiveness)
A Manager's Guide to OEE (Overall Equipment Effectiveness)A Manager's Guide to OEE (Overall Equipment Effectiveness)
A Manager's Guide to OEE (Overall Equipment Effectiveness)
 
Mm 1 pendahuluan
Mm 1 pendahuluanMm 1 pendahuluan
Mm 1 pendahuluan
 
benefits from calculating overall equipment effectivness
benefits from calculating overall equipment effectivnessbenefits from calculating overall equipment effectivness
benefits from calculating overall equipment effectivness
 
Understanding Hierarchical Asset Structures in CMMS
Understanding Hierarchical Asset Structures in CMMSUnderstanding Hierarchical Asset Structures in CMMS
Understanding Hierarchical Asset Structures in CMMS
 

Similar to Kp is ivara

Maintenance Leading and Lagging Key Performance Indicators (KPIs)
Maintenance Leading and Lagging Key Performance Indicators (KPIs)Maintenance Leading and Lagging Key Performance Indicators (KPIs)
Maintenance Leading and Lagging Key Performance Indicators (KPIs)Ricky Smith CMRP
 
Failure Mode Effect Analysis and Total Productive Maintenance: A Review
Failure Mode Effect Analysis and Total Productive Maintenance: A ReviewFailure Mode Effect Analysis and Total Productive Maintenance: A Review
Failure Mode Effect Analysis and Total Productive Maintenance: A ReviewAM Publications
 
IntegrityPRO-introduction
IntegrityPRO-introductionIntegrityPRO-introduction
IntegrityPRO-introductionCraig Watson
 
Arrelic Services | TRF
Arrelic Services | TRFArrelic Services | TRF
Arrelic Services | TRFArrelic
 
The business case for software analysis & measurement
The business case for software analysis & measurementThe business case for software analysis & measurement
The business case for software analysis & measurementCAST
 
Determine Maintenance strateg.docx
Determine Maintenance strateg.docxDetermine Maintenance strateg.docx
Determine Maintenance strateg.docxDarkKnight367793
 
Iso 55000 white_paper_english
Iso 55000 white_paper_englishIso 55000 white_paper_english
Iso 55000 white_paper_englishKaizenlogcom
 
Managing OEE o optimize factory performance
Managing OEE o optimize factory performanceManaging OEE o optimize factory performance
Managing OEE o optimize factory performanceYasmin AbdelAziz
 
Technology Audit
Technology AuditTechnology Audit
Technology AuditArish Roy
 
Measuring and Improving MP1.ppt
Measuring and Improving MP1.pptMeasuring and Improving MP1.ppt
Measuring and Improving MP1.pptssuserf2880f
 
The Balance Scorecard: Presentation to the Institute of Electrical Engineers
The Balance Scorecard: Presentation to the Institute of Electrical EngineersThe Balance Scorecard: Presentation to the Institute of Electrical Engineers
The Balance Scorecard: Presentation to the Institute of Electrical EngineersKinetik Solutions Ltd
 
How to Create an Effective Preventive Maintenance Schedule?
How to Create an Effective Preventive Maintenance Schedule?How to Create an Effective Preventive Maintenance Schedule?
How to Create an Effective Preventive Maintenance Schedule?CryotosCMMSSoftware
 
SIX-SIGMA-GROUP-5.powerpoint presentation
SIX-SIGMA-GROUP-5.powerpoint presentationSIX-SIGMA-GROUP-5.powerpoint presentation
SIX-SIGMA-GROUP-5.powerpoint presentationcheldulceconstan28
 
Asset Information and Analytics Drivers of Process Industry Operational Excel...
Asset Information and Analytics Drivers of Process Industry Operational Excel...Asset Information and Analytics Drivers of Process Industry Operational Excel...
Asset Information and Analytics Drivers of Process Industry Operational Excel...Rolta
 
ERP SYSTEM POST IMPLEMENTATION AUDIT_TRNG_May,2023 - Part-1.pptx
ERP SYSTEM POST IMPLEMENTATION AUDIT_TRNG_May,2023 - Part-1.pptxERP SYSTEM POST IMPLEMENTATION AUDIT_TRNG_May,2023 - Part-1.pptx
ERP SYSTEM POST IMPLEMENTATION AUDIT_TRNG_May,2023 - Part-1.pptxRamanaBulusu1
 
Compuware Marketing- Annual Report
Compuware Marketing- Annual ReportCompuware Marketing- Annual Report
Compuware Marketing- Annual ReportKaleidico
 

Similar to Kp is ivara (20)

Maintenance Leading and Lagging Key Performance Indicators (KPIs)
Maintenance Leading and Lagging Key Performance Indicators (KPIs)Maintenance Leading and Lagging Key Performance Indicators (KPIs)
Maintenance Leading and Lagging Key Performance Indicators (KPIs)
 
Failure Mode Effect Analysis and Total Productive Maintenance: A Review
Failure Mode Effect Analysis and Total Productive Maintenance: A ReviewFailure Mode Effect Analysis and Total Productive Maintenance: A Review
Failure Mode Effect Analysis and Total Productive Maintenance: A Review
 
IntegrityPRO-introduction
IntegrityPRO-introductionIntegrityPRO-introduction
IntegrityPRO-introduction
 
Tpm Diagnostic 4
Tpm Diagnostic              4Tpm Diagnostic              4
Tpm Diagnostic 4
 
Arrelic Services | TRF
Arrelic Services | TRFArrelic Services | TRF
Arrelic Services | TRF
 
The business case for software analysis & measurement
The business case for software analysis & measurementThe business case for software analysis & measurement
The business case for software analysis & measurement
 
Determine Maintenance strateg.docx
Determine Maintenance strateg.docxDetermine Maintenance strateg.docx
Determine Maintenance strateg.docx
 
Viziya
ViziyaViziya
Viziya
 
Iso 55000 white_paper_english
Iso 55000 white_paper_englishIso 55000 white_paper_english
Iso 55000 white_paper_english
 
6 Sigma - Chapter2
6 Sigma - Chapter26 Sigma - Chapter2
6 Sigma - Chapter2
 
Managing OEE o optimize factory performance
Managing OEE o optimize factory performanceManaging OEE o optimize factory performance
Managing OEE o optimize factory performance
 
Technology Audit
Technology AuditTechnology Audit
Technology Audit
 
Measuring and Improving MP1.ppt
Measuring and Improving MP1.pptMeasuring and Improving MP1.ppt
Measuring and Improving MP1.ppt
 
The Balance Scorecard: Presentation to the Institute of Electrical Engineers
The Balance Scorecard: Presentation to the Institute of Electrical EngineersThe Balance Scorecard: Presentation to the Institute of Electrical Engineers
The Balance Scorecard: Presentation to the Institute of Electrical Engineers
 
How to Create an Effective Preventive Maintenance Schedule?
How to Create an Effective Preventive Maintenance Schedule?How to Create an Effective Preventive Maintenance Schedule?
How to Create an Effective Preventive Maintenance Schedule?
 
SIX-SIGMA-GROUP-5.powerpoint presentation
SIX-SIGMA-GROUP-5.powerpoint presentationSIX-SIGMA-GROUP-5.powerpoint presentation
SIX-SIGMA-GROUP-5.powerpoint presentation
 
Asset Information and Analytics Drivers of Process Industry Operational Excel...
Asset Information and Analytics Drivers of Process Industry Operational Excel...Asset Information and Analytics Drivers of Process Industry Operational Excel...
Asset Information and Analytics Drivers of Process Industry Operational Excel...
 
ERP SYSTEM POST IMPLEMENTATION AUDIT_TRNG_May,2023 - Part-1.pptx
ERP SYSTEM POST IMPLEMENTATION AUDIT_TRNG_May,2023 - Part-1.pptxERP SYSTEM POST IMPLEMENTATION AUDIT_TRNG_May,2023 - Part-1.pptx
ERP SYSTEM POST IMPLEMENTATION AUDIT_TRNG_May,2023 - Part-1.pptx
 
Compuware Marketing- Annual Report
Compuware Marketing- Annual ReportCompuware Marketing- Annual Report
Compuware Marketing- Annual Report
 
Optimize Change Management
Optimize Change ManagementOptimize Change Management
Optimize Change Management
 

Recently uploaded

Neo4j - How KGs are shaping the future of Generative AI at AWS Summit London ...
Neo4j - How KGs are shaping the future of Generative AI at AWS Summit London ...Neo4j - How KGs are shaping the future of Generative AI at AWS Summit London ...
Neo4j - How KGs are shaping the future of Generative AI at AWS Summit London ...Neo4j
 
How to convert PDF to text with Nanonets
How to convert PDF to text with NanonetsHow to convert PDF to text with Nanonets
How to convert PDF to text with Nanonetsnaman860154
 
Transforming Data Streams with Kafka Connect: An Introduction to Single Messa...
Transforming Data Streams with Kafka Connect: An Introduction to Single Messa...Transforming Data Streams with Kafka Connect: An Introduction to Single Messa...
Transforming Data Streams with Kafka Connect: An Introduction to Single Messa...HostedbyConfluent
 
Data Cloud, More than a CDP by Matt Robison
Data Cloud, More than a CDP by Matt RobisonData Cloud, More than a CDP by Matt Robison
Data Cloud, More than a CDP by Matt RobisonAnna Loughnan Colquhoun
 
Maximizing Board Effectiveness 2024 Webinar.pptx
Maximizing Board Effectiveness 2024 Webinar.pptxMaximizing Board Effectiveness 2024 Webinar.pptx
Maximizing Board Effectiveness 2024 Webinar.pptxOnBoard
 
Swan(sea) Song – personal research during my six years at Swansea ... and bey...
Swan(sea) Song – personal research during my six years at Swansea ... and bey...Swan(sea) Song – personal research during my six years at Swansea ... and bey...
Swan(sea) Song – personal research during my six years at Swansea ... and bey...Alan Dix
 
Breaking the Kubernetes Kill Chain: Host Path Mount
Breaking the Kubernetes Kill Chain: Host Path MountBreaking the Kubernetes Kill Chain: Host Path Mount
Breaking the Kubernetes Kill Chain: Host Path MountPuma Security, LLC
 
Handwritten Text Recognition for manuscripts and early printed texts
Handwritten Text Recognition for manuscripts and early printed textsHandwritten Text Recognition for manuscripts and early printed texts
Handwritten Text Recognition for manuscripts and early printed textsMaria Levchenko
 
08448380779 Call Girls In Friends Colony Women Seeking Men
08448380779 Call Girls In Friends Colony Women Seeking Men08448380779 Call Girls In Friends Colony Women Seeking Men
08448380779 Call Girls In Friends Colony Women Seeking MenDelhi Call girls
 
WhatsApp 9892124323 ✓Call Girls In Kalyan ( Mumbai ) secure service
WhatsApp 9892124323 ✓Call Girls In Kalyan ( Mumbai ) secure serviceWhatsApp 9892124323 ✓Call Girls In Kalyan ( Mumbai ) secure service
WhatsApp 9892124323 ✓Call Girls In Kalyan ( Mumbai ) secure servicePooja Nehwal
 
Google AI Hackathon: LLM based Evaluator for RAG
Google AI Hackathon: LLM based Evaluator for RAGGoogle AI Hackathon: LLM based Evaluator for RAG
Google AI Hackathon: LLM based Evaluator for RAGSujit Pal
 
Injustice - Developers Among Us (SciFiDevCon 2024)
Injustice - Developers Among Us (SciFiDevCon 2024)Injustice - Developers Among Us (SciFiDevCon 2024)
Injustice - Developers Among Us (SciFiDevCon 2024)Allon Mureinik
 
How to Troubleshoot Apps for the Modern Connected Worker
How to Troubleshoot Apps for the Modern Connected WorkerHow to Troubleshoot Apps for the Modern Connected Worker
How to Troubleshoot Apps for the Modern Connected WorkerThousandEyes
 
Strategies for Unlocking Knowledge Management in Microsoft 365 in the Copilot...
Strategies for Unlocking Knowledge Management in Microsoft 365 in the Copilot...Strategies for Unlocking Knowledge Management in Microsoft 365 in the Copilot...
Strategies for Unlocking Knowledge Management in Microsoft 365 in the Copilot...Drew Madelung
 
The Role of Taxonomy and Ontology in Semantic Layers - Heather Hedden.pdf
The Role of Taxonomy and Ontology in Semantic Layers - Heather Hedden.pdfThe Role of Taxonomy and Ontology in Semantic Layers - Heather Hedden.pdf
The Role of Taxonomy and Ontology in Semantic Layers - Heather Hedden.pdfEnterprise Knowledge
 
Histor y of HAM Radio presentation slide
Histor y of HAM Radio presentation slideHistor y of HAM Radio presentation slide
Histor y of HAM Radio presentation slidevu2urc
 
Boost PC performance: How more available memory can improve productivity
Boost PC performance: How more available memory can improve productivityBoost PC performance: How more available memory can improve productivity
Boost PC performance: How more available memory can improve productivityPrincipled Technologies
 
A Domino Admins Adventures (Engage 2024)
A Domino Admins Adventures (Engage 2024)A Domino Admins Adventures (Engage 2024)
A Domino Admins Adventures (Engage 2024)Gabriella Davis
 
04-2024-HHUG-Sales-and-Marketing-Alignment.pptx
04-2024-HHUG-Sales-and-Marketing-Alignment.pptx04-2024-HHUG-Sales-and-Marketing-Alignment.pptx
04-2024-HHUG-Sales-and-Marketing-Alignment.pptxHampshireHUG
 
Scaling API-first – The story of a global engineering organization
Scaling API-first – The story of a global engineering organizationScaling API-first – The story of a global engineering organization
Scaling API-first – The story of a global engineering organizationRadu Cotescu
 

Recently uploaded (20)

Neo4j - How KGs are shaping the future of Generative AI at AWS Summit London ...
Neo4j - How KGs are shaping the future of Generative AI at AWS Summit London ...Neo4j - How KGs are shaping the future of Generative AI at AWS Summit London ...
Neo4j - How KGs are shaping the future of Generative AI at AWS Summit London ...
 
How to convert PDF to text with Nanonets
How to convert PDF to text with NanonetsHow to convert PDF to text with Nanonets
How to convert PDF to text with Nanonets
 
Transforming Data Streams with Kafka Connect: An Introduction to Single Messa...
Transforming Data Streams with Kafka Connect: An Introduction to Single Messa...Transforming Data Streams with Kafka Connect: An Introduction to Single Messa...
Transforming Data Streams with Kafka Connect: An Introduction to Single Messa...
 
Data Cloud, More than a CDP by Matt Robison
Data Cloud, More than a CDP by Matt RobisonData Cloud, More than a CDP by Matt Robison
Data Cloud, More than a CDP by Matt Robison
 
Maximizing Board Effectiveness 2024 Webinar.pptx
Maximizing Board Effectiveness 2024 Webinar.pptxMaximizing Board Effectiveness 2024 Webinar.pptx
Maximizing Board Effectiveness 2024 Webinar.pptx
 
Swan(sea) Song – personal research during my six years at Swansea ... and bey...
Swan(sea) Song – personal research during my six years at Swansea ... and bey...Swan(sea) Song – personal research during my six years at Swansea ... and bey...
Swan(sea) Song – personal research during my six years at Swansea ... and bey...
 
Breaking the Kubernetes Kill Chain: Host Path Mount
Breaking the Kubernetes Kill Chain: Host Path MountBreaking the Kubernetes Kill Chain: Host Path Mount
Breaking the Kubernetes Kill Chain: Host Path Mount
 
Handwritten Text Recognition for manuscripts and early printed texts
Handwritten Text Recognition for manuscripts and early printed textsHandwritten Text Recognition for manuscripts and early printed texts
Handwritten Text Recognition for manuscripts and early printed texts
 
08448380779 Call Girls In Friends Colony Women Seeking Men
08448380779 Call Girls In Friends Colony Women Seeking Men08448380779 Call Girls In Friends Colony Women Seeking Men
08448380779 Call Girls In Friends Colony Women Seeking Men
 
WhatsApp 9892124323 ✓Call Girls In Kalyan ( Mumbai ) secure service
WhatsApp 9892124323 ✓Call Girls In Kalyan ( Mumbai ) secure serviceWhatsApp 9892124323 ✓Call Girls In Kalyan ( Mumbai ) secure service
WhatsApp 9892124323 ✓Call Girls In Kalyan ( Mumbai ) secure service
 
Google AI Hackathon: LLM based Evaluator for RAG
Google AI Hackathon: LLM based Evaluator for RAGGoogle AI Hackathon: LLM based Evaluator for RAG
Google AI Hackathon: LLM based Evaluator for RAG
 
Injustice - Developers Among Us (SciFiDevCon 2024)
Injustice - Developers Among Us (SciFiDevCon 2024)Injustice - Developers Among Us (SciFiDevCon 2024)
Injustice - Developers Among Us (SciFiDevCon 2024)
 
How to Troubleshoot Apps for the Modern Connected Worker
How to Troubleshoot Apps for the Modern Connected WorkerHow to Troubleshoot Apps for the Modern Connected Worker
How to Troubleshoot Apps for the Modern Connected Worker
 
Strategies for Unlocking Knowledge Management in Microsoft 365 in the Copilot...
Strategies for Unlocking Knowledge Management in Microsoft 365 in the Copilot...Strategies for Unlocking Knowledge Management in Microsoft 365 in the Copilot...
Strategies for Unlocking Knowledge Management in Microsoft 365 in the Copilot...
 
The Role of Taxonomy and Ontology in Semantic Layers - Heather Hedden.pdf
The Role of Taxonomy and Ontology in Semantic Layers - Heather Hedden.pdfThe Role of Taxonomy and Ontology in Semantic Layers - Heather Hedden.pdf
The Role of Taxonomy and Ontology in Semantic Layers - Heather Hedden.pdf
 
Histor y of HAM Radio presentation slide
Histor y of HAM Radio presentation slideHistor y of HAM Radio presentation slide
Histor y of HAM Radio presentation slide
 
Boost PC performance: How more available memory can improve productivity
Boost PC performance: How more available memory can improve productivityBoost PC performance: How more available memory can improve productivity
Boost PC performance: How more available memory can improve productivity
 
A Domino Admins Adventures (Engage 2024)
A Domino Admins Adventures (Engage 2024)A Domino Admins Adventures (Engage 2024)
A Domino Admins Adventures (Engage 2024)
 
04-2024-HHUG-Sales-and-Marketing-Alignment.pptx
04-2024-HHUG-Sales-and-Marketing-Alignment.pptx04-2024-HHUG-Sales-and-Marketing-Alignment.pptx
04-2024-HHUG-Sales-and-Marketing-Alignment.pptx
 
Scaling API-first – The story of a global engineering organization
Scaling API-first – The story of a global engineering organizationScaling API-first – The story of a global engineering organization
Scaling API-first – The story of a global engineering organization
 

Kp is ivara

  • 1. KEY PERFORMANCE INDICATORS Measuring and Managing the Maintenance Function November 2005 Written by: Al Weber Reliability Consultant, Ivara Ron Thomas Director of Reliability Practices, Dofasco IVARA CORPORATION 935 Sheldon Court, Burlington Ontario. Canada. L7L 5K6 Confidential information of Ivara Corporation. Ivara is a registered trademark of Ivara Corporation. Not to be copied, disclosed or electronically distributed without written permission from Ivara.
  • 2. Copyright © 2005 Ivara Corporation. All rights reserved. Information in this document is confidential. No part of this document may be reproduced, stored in a retrieval system or transmitted in any form or any means electronic or mechanical, including photocopying for any purpose other than as agreed without permission of Ivara Corporation. Ivara Corporation 935 Sheldon Court Burlington, Ontario Canada. L7L 5K6 Toll free: 1-877-746-3787 Tel: 905-632-8000 Fax: 905-632-5129 www.ivara.com Confidential information of Ivara Corporation. Ivara is a registered trademark of Ivara Corporation. Not to be copied, disclosed or electronically distributed without written permission from Ivara.
  • 3. Maintenance Key Performance Indicators Introduction “It is not possible to manage what you cannot control and you cannot control what you cannot measure!” (Peter Drucker) Performance measurement is a fundamental principle of management. The measurement of performance is important because it identifies current performance gaps between current and desired performance and provides indication of progress towards closing the gaps. Carefully selected key performance indicators identify precisely where to take action to improve performance. This paper deals with the identification of key performance indicators for the maintenance function, by first looking at the ways that maintenance performance metrics relate to manufacturing metrics. Since performance measurements for maintenance must include both results metrics and metrics for the process that produces the results, this document presents a representation for the business process for maintenance. The document then identifies typical business process and results metrics that can be used as key performance indicators for the maintenance function. customer service, operating costs, safety and environmental integrity. To achieve this performance there are three inputs to be managed. The first requirement is Design Practices. Design practices provide capable equipment "by design" (inherent capability), to meet the manufacturing performance requirements. The second requirement is Operating Practices that make use of the inherent capability of process equipment. The documentation of standard operating practices assures the consistent and correct operation of equipment to maximize performance. The third requirement is Maintenance Practices that maintain the inherent capability of the equipment. Deterioration begins to take place as soon as equipment is commissioned. In addition to normal wear and deterioration, other failures may also occur. This happens when equipment is pushed beyond the limitations of its design or operational errors occur. Degradation in equipment condition results in reduced equipment capability. Equipment downtime, quality problems or the potential for accidents and/or environmental excursions are the visible outcome. All of these can negatively impact operating cost. Physical Asset Management The purpose of most equipment in manufacturing is to support the production of product destined to downstream customers. Ultimately the focus is on meeting customer needs. This is illustrated in Figure 1. Customer expectations are normally defined in terms of product quality, on-time delivery and competitive pricing. By reviewing the composite requirements of all current customers and potential customers in those markets we wish to penetrate, the performance requirements of our physical assets can be defined. Manufacturing performance requirements can be associated with quality, availability, Figure 1: Managing manufacturing performance requirements to meet customer needs Manufacturing key performance indicators provide information on the current state of manufacturing. Asset capability, operating Confidential information of Ivara Corporation. Ivara is a registered trademark of Ivara Corporation. Not to be copied, disclosed or electronically distributed without written permission from Ivara. Page 3 of 16
  • 4. practices and the maintenance of asset condition all contribute to the ability to meet these performance requirements. Some typical key performance indicators for manufacturing include operating cost; asset availability, lost time injuries, number of environmental incidents, OEE and asset utilization. Consider asset utilization, as depicted in Figure 2. Asset utilization is a manufacturing level key performance indicator. It is a function of many variables. For example, asset utilization is impacted by both maintenance and non-maintenance related downtime. Non-maintenance related downtime may be attributed to lack of demand, an interruption in raw material supply or production scheduling delays beyond the control of the maintenance function. Asset utilization is also a function of operating rate, quality and yield losses, etc. In each of these areas maintenance may be a factor but it is not the only contributor. In order to maintain and improve performance each function in the organization must focus on the portion of the indicators that they influence. Similarly, other manufacturing level performance indicators are not only a function of maintenance. They are affected by causes beyond the control of the maintenance function. Asset capability, operating practices and the maintenance of asset condition all contribute to the ability to meet performance requirements. If a manufacturing level indicator is used to measure maintenance performance, improved maintenance may not result in a proportional improvement in the manufacturing metric. For instance, in the asset utilization example, cited above, the maintenance contributors may all be positive and yet the resulting asset utilization may not improve due to other causes. A key principle of performance management is to measure what you can manage. In order to maintain and improve manufacturing performance each function in the organization must focus on the portion of the indicators that they influence. Maintenance performance contributes to manufacturing performance. The key performance indicators for maintenance are children of the manufacturing key performance indicators. Figure 2: Asset Utilization is an example of a manufacturing level key performance indicator. Key performance indicators for maintenance are selected ensuring a direct correlation between the maintenance activity and the key performance indicator measuring it. When defining a key performance indicator for maintenance a good test of the metric validity is to seek an affirmative response to the question; “If the maintenance function does ‘everything right’, will the suggested metric always reflect a result proportional to the change; or are there other factors, external to maintenance, that could mask the improvement?” This paper focuses on defining key performance indicators for the maintenance function, not the maintenance organization. Confidential information of Ivara Corporation. Ivara is a registered trademark of Ivara Corporation. Not to be copied, disclosed or electronically distributed without written permission from Ivara. Page 4 of 16
  • 5. Figure 3: The Asset Reliability Process identifies what's required to manage the maintenance function. The maintenance function can involve other departments beyond the maintenance organization. Similarly, the maintenance department has added responsibilities beyond the maintenance function and, as such, will have additional key performance indicators to report. The key performance indicators for the maintenance organization may include key performance indicators for other areas of accountability such as health and safety performance, employee performance management, training and development, etc. The Asset Reliability Process The management of physical asset performance is integral to business success. What we manage are the business processes required to produce results. One of these business processes is responsible for the maintenance of physical asset reliability. The Asset Reliability Process is shown in Figure 3. It is an integral part of a much larger business process responsible for managing the total enterprise. A proactive Asset Reliability Process, represented by the seven (7) elements in the model aims to deliver the performance required by the enterprise to meet all of its corporate objectives. Each element within the maintenance process is in itself a subprocess. A brief description of each element follows: Business Focus, represented by the green box on the left, focuses the maintenance of physical asset reliability on the business goals of the company. The potential contribution of the asset base to these goals is evaluated. The largest contributors are recognized as critical assets and specific performance targets identified. Work Identification, as a process, produces technically based Asset Reliability Programs. Program activities identify and control failure modes impacting on the equipment's ability to perform the intended function at the required performance level. Activities are evaluated to judge if they are worth doing based on the consequences of failure. Confidential information of Ivara Corporation. Ivara is a registered trademark of Ivara Corporation. Not to be copied, disclosed or electronically distributed without written permission from Ivara. Page 5 of 16
  • 6. Planning develops procedures and work orders for these work activities. The procedures identify resource requirements, safety precautions and special work instructions required to execute the work. Scheduling evaluates the availability of all resources required for work "due" in a specified time frame. Often this work requires the equipment to be shut down. A review of production schedules is required. Resources are attached to a specific work schedule. The use of resources is balanced out. In the Execution process, trained, competent personnel carry out the required work. The Follow-up process responds to information collected in the execution process. Work order completion comments outline what was done and what was found. Actual time and manpower, to complete the job, is documented. Job status is updated as complete or incomplete. Corrective work requests, resulting from the analysis of inspection data, are created. Requests are made for changes to drawings and procedures. The process of Performance Analysis evaluates maintenance program effectiveness. Gaps between actual process performance and the required performance are identified. Historical maintenance data is compared to the current process performance. Maintenance activity costs are reviewed. Significant performance gaps are addressed by revisiting the Work Identification function. Each element is important to provide an effective maintenance strategy. Omitting any element will result in poor equipment performance, increased maintenance costs or both. For example, Work Identification systematically identifies the Right Work to be performed at the Right Time. Without proper Work Identification, maintenance resources may be wasted. Unnecessary or incorrect work will be planned. Once executed, this work may not achieve the desired performance results, despite significant maintenance costs. Without Planning the correct and efficient execution of the work is left to chance. The Planned Maintenance Process is a cycle. Maintenance work is targeted to achieve required asset performance. Its effectiveness is reviewed and improvement opportunities identified. This guarantees continuous improvement in process performance impacted by Maintenance. Within the Planned Maintenance Process two internal loops exist. Planning, Scheduling, Execution and Follow Up make up the first loop. Once maintenance activities are initially identified, an asset maintenance program, based on current knowledge and requirements, is initiated. The selected maintenance activities will be enacted upon at the designed frequency and maintenance tolerance limits. The process is self-sustaining. The second loop consists of the Work Identification and Performance Analysis elements. This is the continuous improvement loop. Actual asset performance is monitored relative to the required performance (driven by business needs). Performance gaps are identified. The ‘cause’ of these gaps is established and corrective action recommended. Performance Metrics for the Maintenance Function The Asset Reliability Process represents the collection of ‘all’ tasks required to support the maintenance function. The process is a supply chain. If a step in the process is skipped, or performed at a substandard level, the process creates defects known as failures. The output of a healthy reliability process is optimal asset reliability at optimal cost. Asset Reliability Process measures are leading indicators. They monitor if the tasks are being performed that will ‘lead to results’. For example a leading process indicator would monitor if the planning function was taking place. If people are Confidential information of Ivara Corporation. Ivara is a registered trademark of Ivara Corporation. Not to be copied, disclosed or electronically distributed without written permission from Ivara. Page 6 of 16
  • 7. doing all the right things then the results will follow. The leading ‘process’ indicators are more immediate than results measures. Result measures monitor the products of the Asset Reliability Process. Result measures include maintenance cost (as a contributor to total operating cost), asset downtime due to planned and unplanned maintenance (as a contributor to availability) and number of failures on assets (the measure of reliability: this can then be translated into mean time between failures). Results measures lag. Failure is a good example. Typically the same piece of equipment doesn’t fail day after day. Take a pump for example. Say the pump fails on average once every 8 months. If we improve its reliability by 50% it will now fail every 12 months. You have to wait at least 12 months to see the improvement. Key performance indicators for the maintenance function need to include both leading (maintenance process) measures and lagging (result) measures. This paper focuses on identifying both leading and lagging measures of maintenance performance. Collectively, these measurements are the key performance indicators for the maintenance function. Reliability Process Key Performance Indicators – Leading Measures The maintenance process is made up of elements. All elements are required to complete the supply chain. Key performance indicators of the maintenance process are process assurance measures. They answer the question ‘how do I know that this maintenance process element is being performed well?’ The day-to-day execution of maintenance is addressed through the seven elements of the Reliability Process; Business Focus, Work Identification, Work Planning, Work Scheduling, Work Execution, Follow-up and Performance Analysis. Key performance indicators for each element are recommended. It should be noted that variations of these metrics may be defined or additional performance metrics may be used. The metrics presented here provide a clear indication if the requirements of each element are being satisfied and, if not, what action should be taken to correct the lack of maintenance process adherence. Work Identification The function of work identification is to identify the ‘right work at the right time. 1. Work Requests Initiating a work request is one method of identifying work. Once a work request is submitted it must be reviewed, validated and approved before it becomes an actual work order ready to be planned. If the work request process is performing well, the validation and approval/rejection of work requests should occur promptly. A suggested measure for the work request process is: ♦ The percentage of work requests remaining in “Request” status for less than 5 days, over a specified time period (for example the last 30 days). The world class maintenance expectation is that most work (>80%) requests would be reviewed and validated within a maximum of 5 days. Work requests rely on the random identification of problems or potential problems and bringing them to the attention of maintenance to address them. In a world class organization, work identification is not left to chance. 2. Proactive Work The ‘Asset Maintenance Program’ is designed to identify potential failure conditions, changes in state of hidden functions and known age related failure causes. The development of the Asset Maintenance Program defines the routine maintenance tasks that must be executed to achieve the performance levels required to meet business requirements. If the ‘Asset Maintenance Program’ is effective, it will successfully identify and address most maintenance preventable causes of failure. Confidential information of Ivara Corporation. Ivara is a registered trademark of Ivara Corporation. Not to be copied, disclosed or electronically distributed without written permission from Ivara. Page 7 of 16
  • 8. If the ‘Work Identification’ function is working well, the majority of work performed by maintenance would consist of executing the Asset Maintenance Program (AMP) tasks and the corrective work originating from it. ♦ The key performance indicator for the work identification element is: ♦ The percentage of available man-hours used for proactive work (AMP + AMP initiated corrective work) over a specified time period. The world class maintenance target for proactive work is 75 to 80%. Recognizing that 5 -10% of available manhours should be attributed to improvement work (non-maintenance) this would leave approximately 10% - 15% reactive work. Work Planning The primary function of the Work Planning element of the maintenance process is to prepare the work to achieve maximum efficiency in execution. 5. Quality of Planning These key performance indicators for planning do not reflect the quality of the planning being done. A critical aspect of planning is estimating resources. The quality of planning can be measured by monitoring the accuracy of estimating. Labor and material resources are the dominant resources specified on a work order. The accuracy of estimating labor can be measured by: ♦ 3. Amount of Planned Work In general terms, planning defines how to do the job and identifies all the required resources and any special requirements to execute the work. A properly planned work order would include all this information. Maximizing maintenance efficiency requires a high percentage of planned work. A measure of whether planning is taking place is: ♦ The percentage of all work orders, over a specified time period, with all the planning fields completed (ex. Labor assignments, task durations, work priority, required by date, etc). The world class expectation is that >95% of all jobs should be planned. 4. Responsiveness of Planning Another key performance indicator for planning is the time it takes a work order to be planned. A suggested measure of this is: The percentage of work orders in ‘planning status’ for less than 5 days, over a specified time period. A world class performance level of at least 80% of all work orders processed in 5 days or less should be possible. Some work orders will require more time to plan but attention must be paid to 'late finish or required by date'. The percentage of work orders with man-hour estimates within 10% of actual over the specified time period. Estimating accuracy of greater than 90% would be the expected level of world class maintenance performance. A second metric of planning quality, addressing material estimates, would be: ♦ The percentage of planned, scheduled and assigned work orders, where execution is delayed due to the need for materials (spare parts) over the specified time period. The world class maintenance expectation is that less than 2% of all work assigned will have a material deficiency (due to planning).Note: this assumes the job should not have been scheduled if the materials were not available. Therefore, the problem is that the work order did not account for all the required materials. Work Scheduling Good planning is a prerequisite to scheduling. The primary function of scheduling is to coordinate the availability of Confidential information of Ivara Corporation. Ivara is a registered trademark of Ivara Corporation. Not to be copied, disclosed or electronically distributed without written permission from Ivara. Page 8 of 16
  • 9. the asset(s) to be maintained with all the required resources; labor, material and services creating a schedule to execute ‘the right work at the right time’. The schedule is a contract between operations and maintenance. The ‘right work at the right time’ implies that this work must be executed within the specified time period to achieve the desired level of performance. Failure to execute within the schedule period will increase the risk of failure. With good work identification, planning and scheduling in place, the weekly maintenance schedule should be produced several days in advance of the beginning of the schedule period. There should be confidence that this schedule reflects the work that will be completed through the schedule period. 6. Quality of Scheduling A key performance scheduling function is: ♦ for the The percentage of work orders, over the specified time period, that have a scheduled date earlier or equal to the ‘late finish or required by date’. A world class maintenance target of >95% should be expected in order to ensure the majority of the work orders are completed before their 'late finish or required-by date.' A second measure scheduling is: ♦ indicator of the quality ♦ The percentage of scheduled available man-hours to total available man-hours over the specified time period. A world class target of >80% of man-hours should be applied to scheduled work. It is not desirable to schedule 100% of available man-hours within a schedule period, because we recognize that additional work will arise after the schedule has been cast. This includes both emergency work and other schedule write-ins that must be accommodated during the schedule period. Work Execution Work execution begins with the assignment of work to the people responsible for executing it and ends when the individuals charged with responsibility for execution provide feedback on the completed work. 7. Schedule Compliance With a high quality of work identification, planning and scheduling, maintenance resources should execute according to the plan and schedule. Therefore, a key performance indicator of execution is schedule compliance. Schedule compliance is defined as: ♦ of The percentage of work orders assigned “Delay” status due to unavailability of manpower, equipment, space or services over the specified time period. Volume of Scheduled Work The scheduling of properly planned work is also important to maximize maintenance efficiency. We would anticipate that a high percentage of the available maintenance man-hours would be committed to a schedule. A second scheduling key performance indicator measures: The percentage of work orders completed during the schedule period before the late finish or required by date. World class maintenance should achieve >90% schedule compliance during execution. 8. Quality of Work Execution Work execution quality is measured by: ♦ The percentage of rework. World class levels of maintenance rework are less than 3%. 9. Work Order Completion The purpose of identifying maintenance process key performance indicators is to help manage the maintenance process. The ability to successfully monitor and manage the process and measure the results of the process is highly dependent on gathering Confidential information of Ivara Corporation. Ivara is a registered trademark of Ivara Corporation. Not to be copied, disclosed or electronically distributed without written permission from Ivara. Page 9 of 16
  • 10. correct information during work execution. The vehicle for collecting this information is the work order. Work orders should account for ‘all’ work performed on assets. This is necessary to gather accurate maintenance cost and history data, enabling the management of the physical asset through its life cycle. A returned work order should indicate the status of the job (complete, incomplete), the actual labor and material consumed, an indication of what was done and/or what was found and recommendations for additional work. In addition, information about process and equipment downtime and an indication of whether the maintenance conducted was in response to a failure should be provided. The idea that the job is not done until the work order is completed and returned is a significant challenge to many organizations. For this reason it is also important to have a key performance indicator on work order completion. This metric should look at: ♦ The percentage of work orders turned in with all the data fields completed. World class maintenance organizations achieve 95% compliance. should be reviewed and closed within 3 days. Performance Analysis The performance analysis element of the maintenance process evaluates maintenance effectiveness by focusing on key performance indicators of maintenance results. Gaps between the actual and required performance of the maintained asset are identified. Significant performance gaps are addressed by initiating work identification improvement actions to close the performance gap. 11. Presence of Performance Analysis One indication that performance analysis is being executed is the existence of the maintenance result metrics described under the next section of this paper entitled key performance indicators of maintenance effectiveness (result measures). 12. Quality of Performance Analysis From a maintenance process perspective it is important that these results are driving action. Therefore, a key performance indicator for performance analysis is a measure of: Follow-up ♦ In the Follow-up element of the maintenance process, actions are initiated to address the information identified during execution. Some key follow-up tasks include reviewing work order comments and closing out completed work orders, initiating corrective work and initiating part and procedural updates as required. ♦ The number of reliability improvement actions initiated through performance analysis during the specified period. No absolute number is correct but no number suggests inaction. A second measure is the number of asset reliability actions resolved over the last month. In other words, a measure of how successful the organization is in performance gap closure. 10. Work Order Closure Timely follow-up and closure of completed work orders is essential to maintenance success. A key performance indicator for follow-up is: ♦ The percentage of work orders closed within a maximum of 3 days, over the specified time period. The expectation is that >95% of all completed work orders Key Performance Indicators of Maintenance Effectiveness (Result Measures) The product of maintenance is reliability. A reliable asset is an asset that functions at the level of performance that satisfies the needs of the user. Reliability is assessed by measuring failure. Confidential information of Ivara Corporation. Ivara is a registered trademark of Ivara Corporation. Not to be copied, disclosed or electronically distributed without written permission from Ivara. Page 10 of 16
  • 11. Failures The primary function of maintenance is to reduce or eliminate the consequences of physical asset failures. The definition of functional failure is anytime that asset performance falls below its required performance. Therefore a key performance indicator for maintenance effectiveness is some measurement of failure on the asset(s). If the maintenance function is effective, failures on critical assets and thus their consequences should be reduced or eliminated. Failure consequence impacts manufacturing level key performance indicators. Failure classification by consequence identifies the contribution of maintenance function to manufacturing level performance. Failure consequences are classified into the following categories: 1. Hidden Consequence – there is no direct consequence of a single point failure other than exposure to the increased risk of a multiple failure (a second failure has to occur to experience a consequence). 2. Safety Consequence – a single point failure results in a loss of function or other damage which could injure or kill someone. 3. Environmental Consequence –a single point failure results in a loss of function or other damage which breaches any known environmental standard or regulation; 4. Operational Consequence – a single point failure has a direct adverse effect on operational capability (output, product quality, customer service or operating costs in addition to the direct cost of repair). 5. Non-Operational Consequence – a single point failure involving only the cost of repair. Therefore, it is important to track: ♦ The number and frequency of asset failures by area of consequence. There is no universal standard for this metric because of the diversity of industries and even plants within industry segments. It is however reasonable to expect a downward trend and to set reduction targets based on current performance levels and business needs. Maintenance Costs Maintenance costs are another direct measure of maintenance performance. Maintenance costs are impacted by both maintenance effectiveness and the efficiency with which maintenance is performed. Maintenance maximizes its effectiveness by ensuring that it performs “The Right Work at the Right Time”. Proactive maintenance means intervening before the failure event occurs. The impact of proactive maintenance is not only to minimize the safety, environmental and operational consequences of failure but also to reduce the cost of maintenance by reducing secondary damage. For example, if the potential failure of a pump bearing was detected proactively, the catastrophic failure of the bearing could be prevented. The catastrophic failure of the pump bearing would likely result in damage to the casing, wear rings, impeller, mechanical seals, etc. The corrective repair would require an extensive pump rebuild. Utilizing a proactive task such as vibration monitoring to detect the bearing deterioration permits the scheduled replacement of the bearing prior to the occurrence of secondary damage. Less secondary damage means that it takes less time to repair (labor savings) and consumes fewer parts (material savings). The overall effect is the repair costs much less. Maintenance costs are also impacted by increasing the efficiency of maintenance. These efficiency gains are achieved through improved planning and scheduling of “the right work at the right time”. Published data suggests that companies with estimated wrench times of 25% to 30% can increase Confidential information of Ivara Corporation. Ivara is a registered trademark of Ivara Corporation. Not to be copied, disclosed or electronically distributed without written permission from Ivara. Page 11 of 16
  • 12. wrench time to between 40% and 60% through better planning and scheduling. There are several useful maintenance cost related measures: ♦ ♦ ♦ ♦ ♦ Maintenance Cost: The target maintenance cost depends on the asset and its operating context (how the asset is applied and used). Maintenance Cost / Unit Output: The target maintenance cost depends on the asset and its operating context (how the asset is applied and used). Maintenance Cost / Replacement Asset Value of Plant and Equipment: This metric is a useful benchmark at a plant and corporate level. The world class benchmark is between 2% and 3%. Total Maintenance Cost / Total Manufacturing Cost: This metric is a useful benchmark at a plant and corporate level. The world class benchmark is <10% to 15%. Total Maintenance Cost /Total Sales: This metric is a useful benchmark at a plant and corporate level. The world class benchmark is between 6% and 8%. Maintenance Related Downtime The maintenance function’s impact on asset availability is through minimizing downtime attributed to maintenance. This includes both scheduled and unscheduled maintenance related downtime. A key objective of proactive maintenance is to identify potential failures with sufficient leadtime to plan and schedule the corrective work before actual failure occurs. If the maintenance function is successful unscheduled maintenance related downtime will be reduced. It is equally important to measure scheduled downtime. The work identification element of the maintenance process strives to eliminate unnecessary scheduled maintenance by focusing on only performing the ‘right work at right time’. Through more formal work identification and enhanced planning and scheduling shutdown overruns should be minimized. Useful key performance indicators associated with asset downtime attributable to maintenance are: ♦ ♦ ♦ Unscheduled downtime (hours) Scheduled downtime (hours) Shutdown overrun (hours) Note: It is useful to distinguish between ‘equipment down’ where a specific piece of equipment is unavailable and ‘process down’ where production has stopped. The Importance of the Work Order Implementation of the suggested key performance indicators for the maintenance function requires a reliable source of data on asset failures, maintenance costs and downtime. Any time maintenance is performed on an asset a record should be kept. The vehicle for collecting this data is the maintenance work order. Whenever maintenance is performed against an asset, work order completion data should include the following information: ♦ Identification of the asset at the level in the asset hierarchy where the work was performed. ♦ Date, time and duration of the maintenance event. ♦ An indication if failure has occurred: yes or no (no if proactive) ♦ When failure has occurred, identification of the failure consequence: {hidden, safety, environment, operational (product quality, throughput, customer service, operating costs) or nonoperational involving only the cost of repair only} ♦ actual costs (labor, materials, services, etc) ♦ process downtime (loss of production) ♦ asset downtime (equipment out of service but process still able to produce) Queries in your computerized maintenance management system can then be developed Confidential information of Ivara Corporation. Ivara is a registered trademark of Ivara Corporation. Not to be copied, disclosed or electronically distributed without written permission from Ivara. Page 12 of 16
  • 13. to track and report key performance indicators for asset failure, maintenance costs and downtime. Reporting and Use of Key Performance Indicators Maintenance and reliability business process metrics (leading indicators) provide a clear indication of compliance to the maintenance business process. They indicate where to take specific action because of a gap in the way maintenance is being performed. This gap in the execution of the maintenance process will ‘eventually’ lead to asset failure(s). The consequence of these failures translates into poor manufacturing performance. These key performance indicators should be aligned with defined roles and responsibilities for the maintenance function against the assets for which they apply. For example, a planner responsible for ‘Area A’ would be responsible for the planning function key performance indicators for the ‘Area A’ assets. The manager responsible for ‘Area A’ assets would monitor all process and result metrics for Area A. Each metric should roll up the asset hierarchy, in alignment with individual responsibility for the assets. Management action is directed at improving compliance with the requirements of Work Identification, Planning, Scheduling, Execution and Followup. In this way, the process is managed leading to world class results. This logic is repeated at each level of management in the organization. At the plant and/or corporate level, management is exercising accountability for plant-wide maintenance metrics, both process and results. Confidential information of Ivara Corporation. Ivara is a registered trademark of Ivara Corporation. Not to be copied, disclosed or electronically distributed without written permission from Ivara. Page 13 of 16
  • 14. Appendix 1: Summary of Maintenance Key Performance Indicators Type of Measure 1 2 3 4 5 6 7 8 9 10 Result Lagging Result Lagging Result Lagging Result Lagging Result Lagging Result Lagging Result Lagging Result Lagging Result Lagging Result Lagging Measuring Cost Cost Cost Key Performance Indicator Maintenance Cost Maintenance Cost / Replacement Asset Value of Plant and Equipment Maintenance Cost / Manufacturing Cost World Class Target Level Context specific 2 - 3% < 10 – 15% Cost Maintenance Cost / Unit Output Context specific Cost Maintenance Cost / Total Sales 6 - 8% Failures Mean Time Between Failure (MTBF) Context specific Failures Failure Frequency Context specific Downtime Downtime Downtime Unscheduled Maintenance Related Downtime (hours) Scheduled Maintenance Related Downtime (hours) Maintenance Related Shutdown Overrun (hours) 11 Process Leading Work Identification Percentage of work requests remaining in “Request” status for less than 5 days, over the specified time period. 12 Process Leading Work Identification Percentage of available man-hours used for proactive work (AMP + AMP initiated corrective work) over a specified time period. 13 Process Leading Work Identification 14 Process Leading Work Planning 15 Process Leading Work Planning Percentage of work orders, over the specified time period, with all planning fields completed. 16 Process, Leading Work Planning Percentage of Work Orders assigned “Rework” status (Due to a need for additional Planning) over the last month. 17 Process, Leading Work Planning Percentage of Work Orders in “New” or “Planning” status less than 5 days, over the last month. 18 Process, Leading Work Scheduling 19 Process, Leading Work Scheduling 20 Process, Leading Work Scheduling Percentage of available man-hours used on modifications over the specified time period. Percentage of work orders with manhour estimates within 10% of actual over the specified time period. Percentage of work orders, over the specified time period, having a scheduled date earlier or equal to the late finish or required by date. Percentage of scheduled available man-hours to total available man-hours over the specified time period. Percentage of Work Orders assigned “Delay” status due to unavailability of manpower, equipment, space or services over the specified time period. Context specific Context specific Context specific 80% of all work requests should be processed in 5 days or less. Some work requests will require more time to review but attention must be paid to 'late finish date' or required by date. Target for proactive work is 75 to 80%. Recognizing 5 -10% of available man-hours attributed to redesign or modification (improvement work) this would leave approximately 10% 15% reactive. Expect a level of 5 to 10% of manhours spent on modification work. Estimating accuracy of greater than 90% would be the expected level of performance. 95% + should be expected. Expect a high level of compliance for these fields to enable the scheduling function to work. This level should not exceed 2 to 3%. 80% of all work orders should be possible to process in 5 days or less. Some work orders will require more time to plan but attention must be paid to 'late finish date'. 95%+ should be expected in order to ensure the majority of the work orders are completed before their 'late finish date.' Target 80% of man-hours applied to scheduled work. This number should not exceed 3 to 5%. Confidential information of Ivara Corporation. Ivara is a registered trademark of Ivara Corporation. Not to be copied, disclosed or electronically distributed without written permission from Ivara. Page 14 of 16
  • 15. Type of Measure Measuring Key Performance Indicator World Class Target Level 21 Process, Leading Work Execution Percentage of Work Orders completed during the schedule period before the late finish or required by date. Percentage of maintenance work orders requiring rework. Percentage of work orders with all data fields completed over the specified time period. Percentage of work orders closed within 3 days, over the specified time period. Schedule compliance of 90%+ should be achieved. 22 Process, Leading Work Execution 23 Process, Leading Work Execution 24 Process, Leading Work Follow-up 25 Process, Leading Performance Analysis Number of asset reliability improvement actions initiated by the performance analysis function, over the specified time period. 26 Process, Leading Performance Analysis Number of equipment reliability improvement actions resolved, over the specified time period. (Did we achieve performance gap closure) Rework should be less than 3%. Should achieve 95%+. Expectation is that work orders are completed properly. Should achieve 95%+. Expectation is that work orders are reviewed and closed promptly. No number is correct but level of relative activity is important. No actions being initiated when lots of performance gaps exist is inappropriate. This is a measure of project success. Confidential information of Ivara Corporation. Ivara is a registered trademark of Ivara Corporation. Not to be copied, disclosed or electronically distributed without written permission from Ivara. Page 15 of 16
  • 16. Appendix 2: Example of How Maintenance KPI’s Are Used Maintenance Process Key Performance Indicators Maintenance Results (Lagging) Key Performance Indicators Maintenance Benchmarks - Maintenance Cost / Unit Output - % Maintenance Cost / Replacement Asset Value - % Total Maintenance Cost / Total Manufacturing Cost - % Total Maintenance Cost / Total Sales Note: Key performance indicators are summarized and reported for all assets at the level of organizational responsibility . Work Identification Work Planning - % proactive work - % planned work - % improvement work - % work requests in request status < x days - % work orders with labor estimates within 10% of actuals - % work orders requiring rework due to planning - % work orders in planning status < x days Work Scheduling - % work orders with a scheduled date less than or equal to 'required by' date. - % of scheduled available man-hours to total available man-hours - % work orders assigned 'delay' status due to the unavailability of manpower, materials, equipment, space or services - Number of functional failures 1) Total 2) Sub-total by Failure Consequence Hidden Safety Environmental Operational Quality Output Customer Service Operating Cost Non-Operational (only cost of repair) - Maintenance related downtime 1) Unscheduled downtime (hours) 2) Scheduled downtime (hours) 3) Shutdown overruns (hours) - Maintenance cost 1) Total maintenance cost Work Execution - % work orders completed during the schedule period (schedule compliance) - % rework Follow-up - % work orders closed within x days - % of work orders with alll work order completion data fields completed Performance Analysis - trend number of asset reliability improvement actions initiated - track number of asset reliability improvement actions resolved Maintenance Process (Leading) Key Performance Indicators Confidential information of Ivara Corporation. Ivara is a registered trademark of Ivara Corporation. Not to be copied, disclosed or electronically distributed without written permission from Ivara. Page 16 of 16