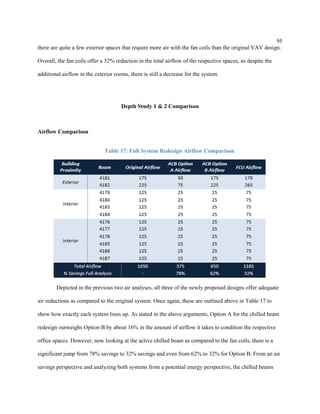
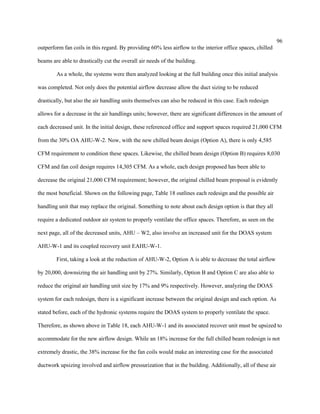
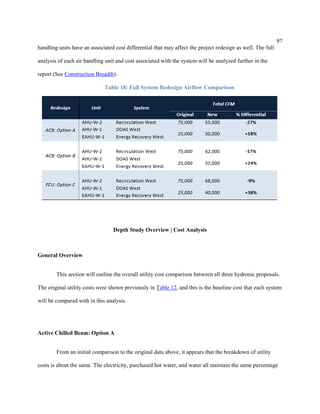
The document analyzes the mechanical systems of the Northeast Education Building, including the original air handling system design and proposing alternatives like active chilled beams and fan coils, in order to improve energy efficiency. It also studies potential daylighting benefits through photocell implementation. The analysis compares the capital costs and energy savings of the different redesign options.
![65
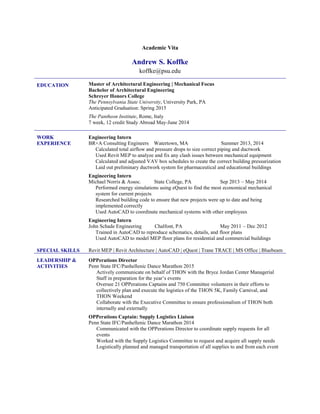
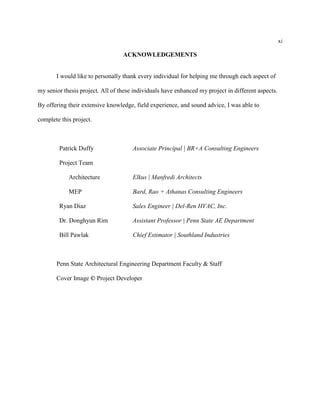
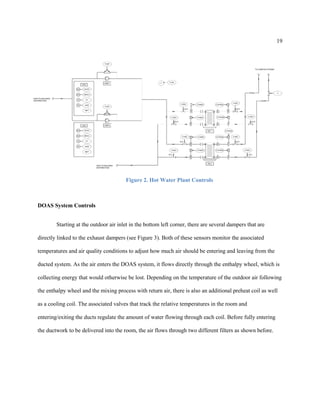
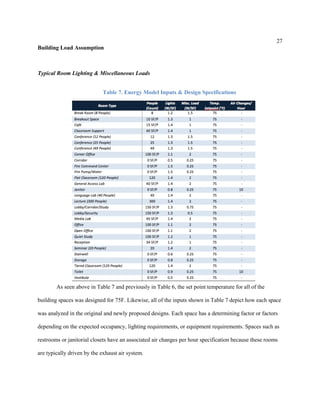
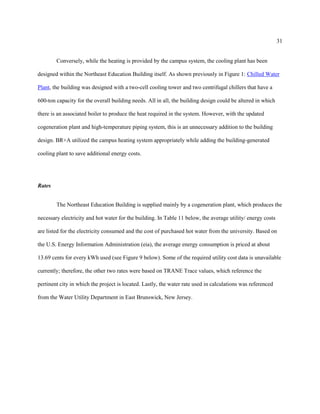
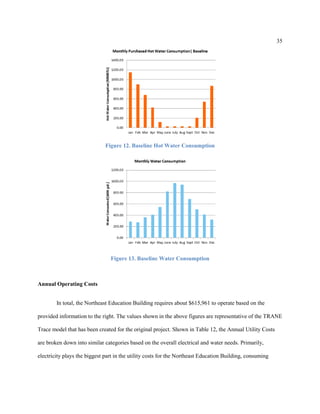
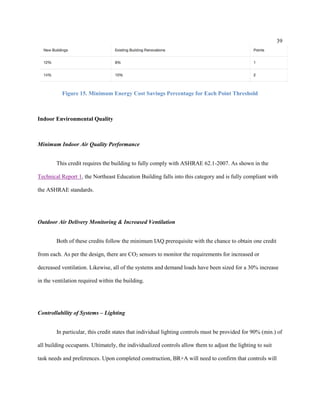
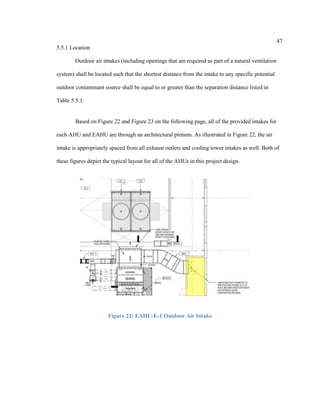
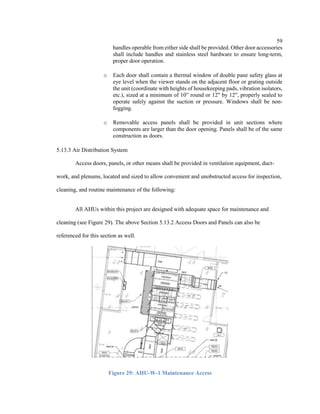
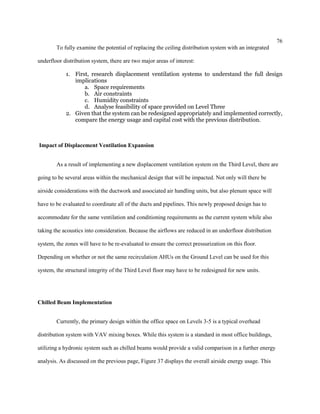
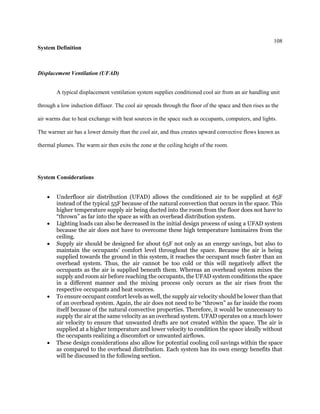
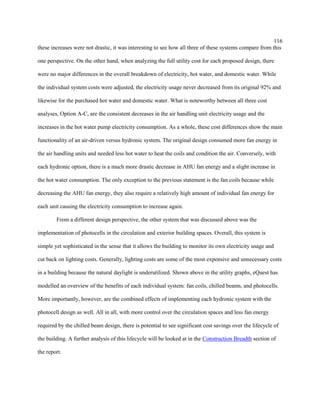
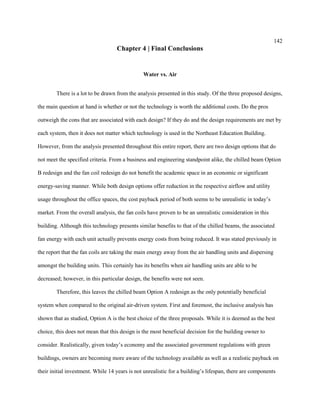
under the seating. Likewise, a dedicated outdoor air system has been provided, AHU-W-1 and AHU-E-1,
to supply all of the Seminar, Lecture Hall, and Classroom spaces.
Respective Calculations
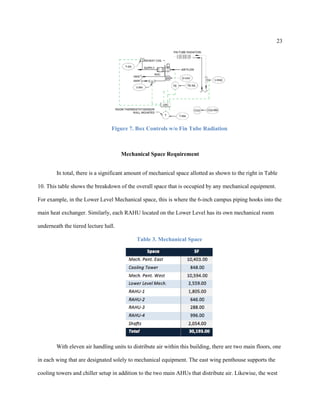
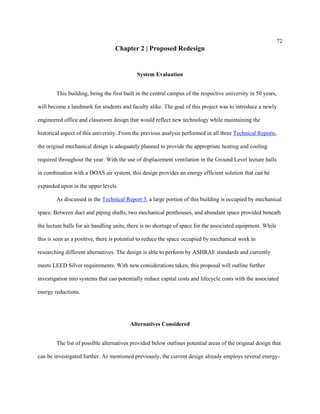
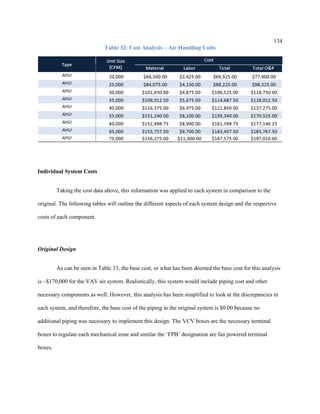
Breathing Zone Outdoor Airflow
Vbz = Rp · Pz + Ra · Az
Where:
Vbz = the breathing zone outdoor airflow
Az = zone floor area (net occupiable) [ft.]
Ra = Outdoor airflow rate required per unit area per unit area from ASHRAE
Standards 62.1 Table 6.1 [CFM/ft2
]
Pz = Zone population [persons] Pz
Rp = Outdoor airflow rate required per unit area per person from ASHRAE
Standards 62.1 Table 6.1 [CFM/person]
Zone Outdoor Airflow (VOZ)
VOZ= Vbz/Ez
Zone Air Distribution Effectiveness (Ez) from ASHRAE 62.1 Table 6.2
Ez=1.0](https://image.slidesharecdn.com/813e8a98-cb68-49ad-8987-74a4b9856144-150520014650-lva1-app6892/85/Koffke_Thesis-1-66-320.jpg)
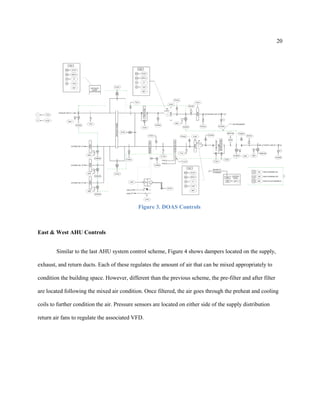
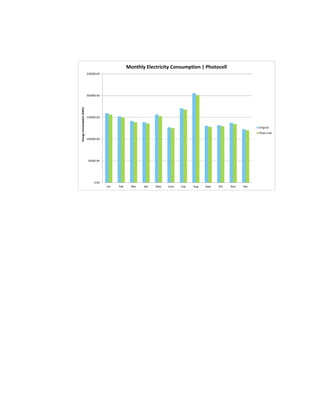
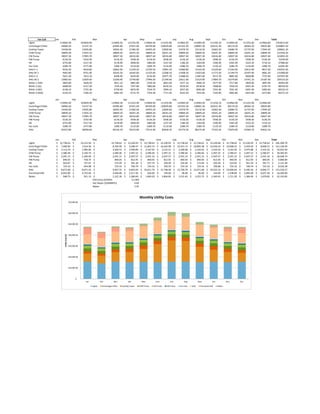
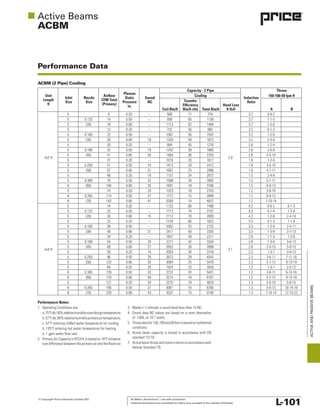
![77
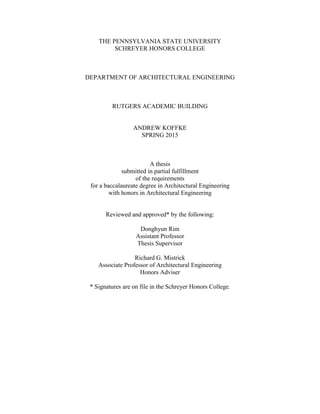
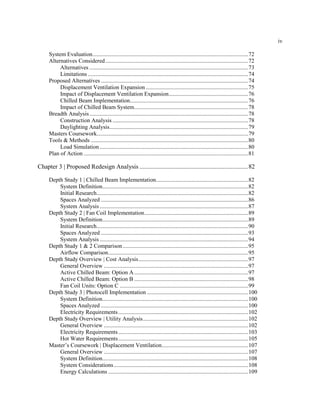
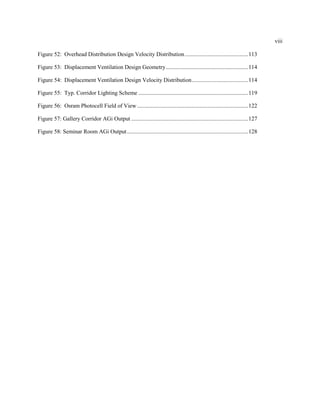
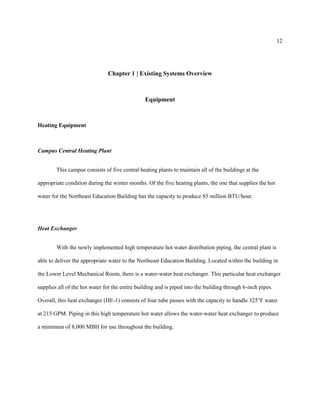
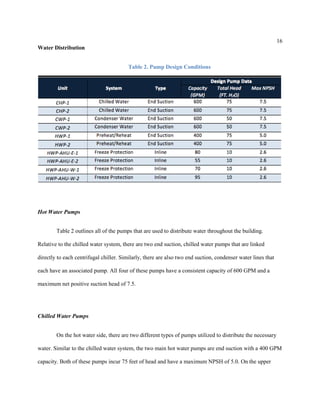
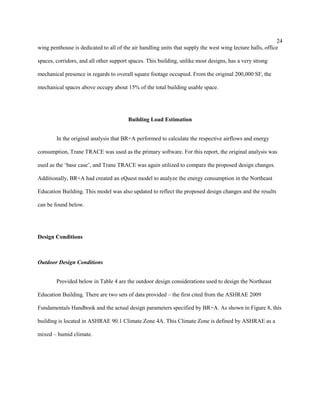
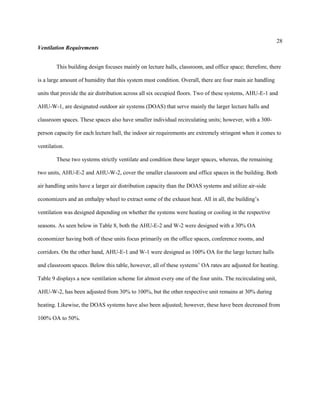
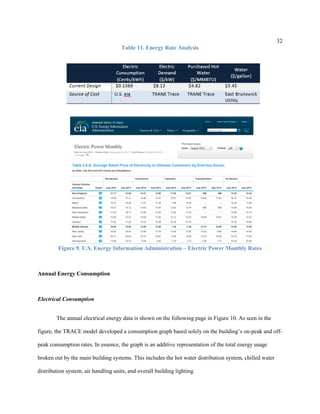
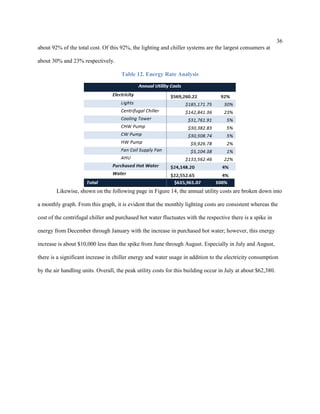
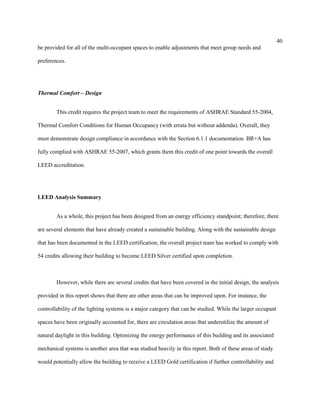
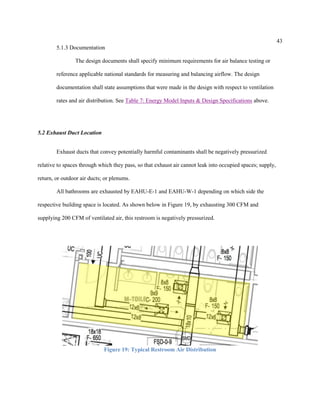
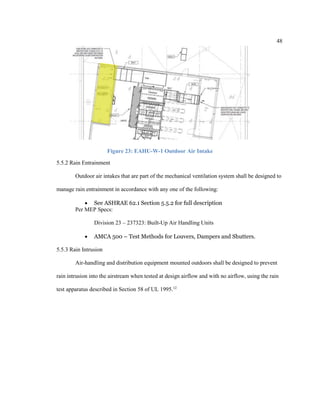
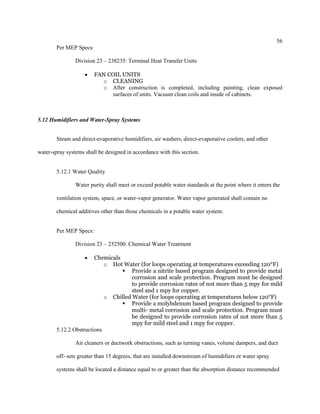
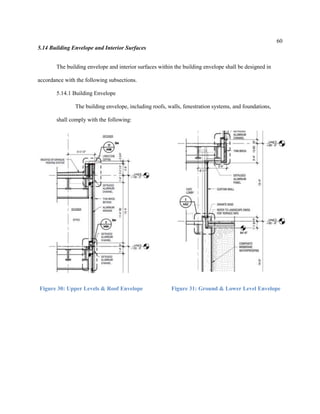
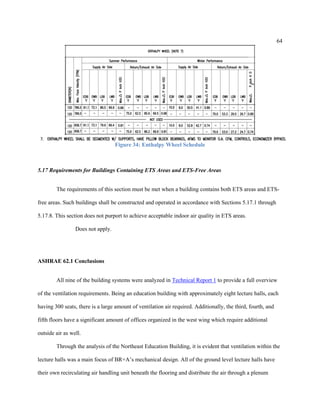
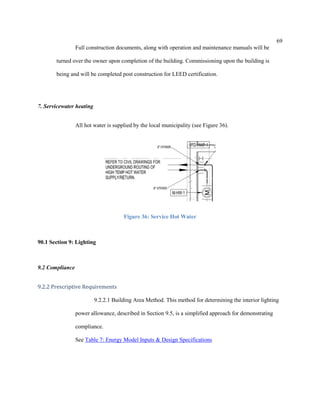
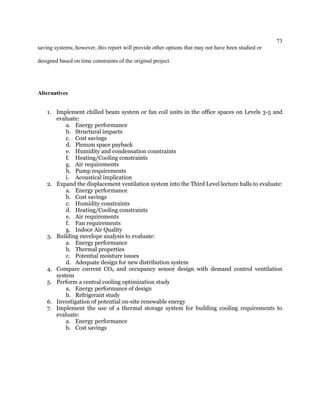
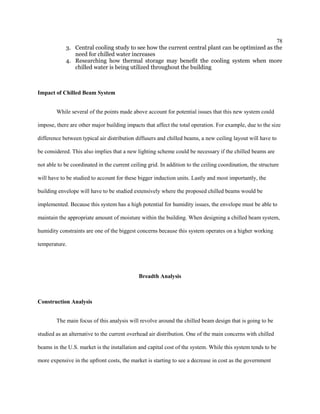
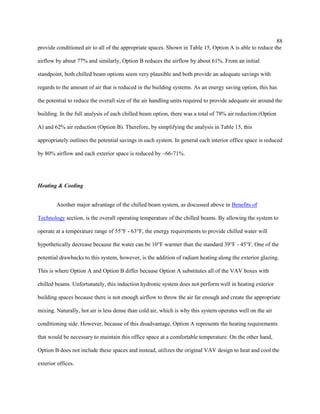
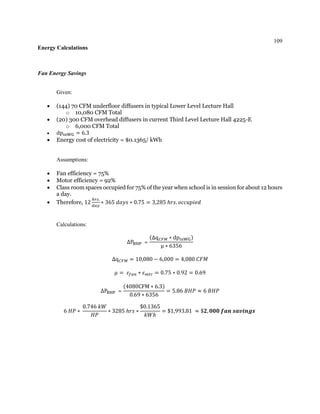
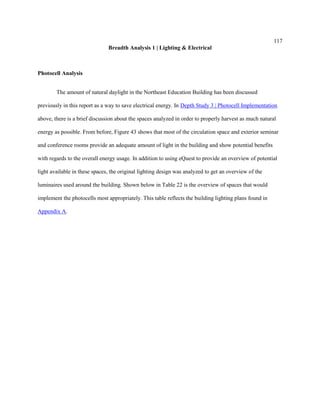
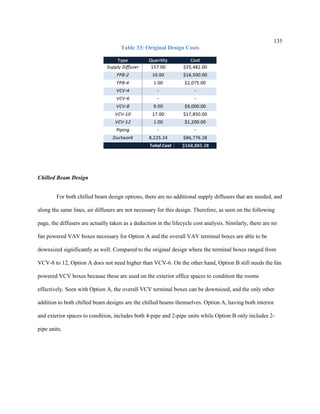
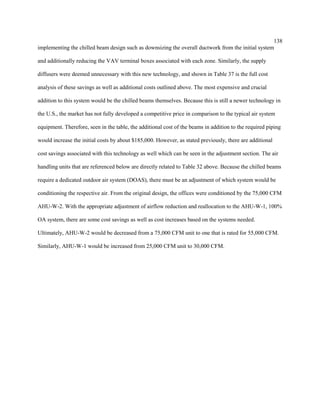
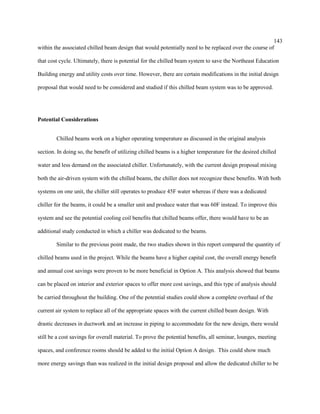
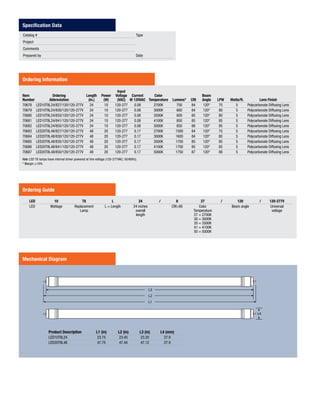
chart shows that 12% of the electricity being used in the building is directly related to the air being
distributed to offices and support spaces as well.
Figure 38: HVAC System Annual Energy Usage
Through previous research that has been conducted, Figure 38 shows that the overall space
cooling needs are decreased with a chilled beam system. As compared to the current VAV system, this
could provide potential energy savings and paybacks through waterside economization. In a journal
article written by Tredinnick [1], he recommends using the DOAS evaporator return water to service a
secondary chilled water loop used as the chilled beam supply water. This waterside economization would
help to minimize the total pumping requirements and chiller electricity requirements as well.
Additionally, by implementing a chilled beam system, this would provide an opportunity to
reduce the amount of ductwork within the plenum space. This new system would allow for smaller ducts
to be routed appropriately throughout the offices while still maintaining the cooling and heating
requirements. Other considerations that would be analysed alongside a chilled beam design include:
1. An acoustical analysis of the hydronic system as compared to the current air driven
system
2. Envelope study to prove that the current design is adequate in maintaining the
appropriate humidity levels within the building](https://image.slidesharecdn.com/813e8a98-cb68-49ad-8987-74a4b9856144-150520014650-lva1-app6892/85/Koffke_Thesis-1-78-320.jpg)


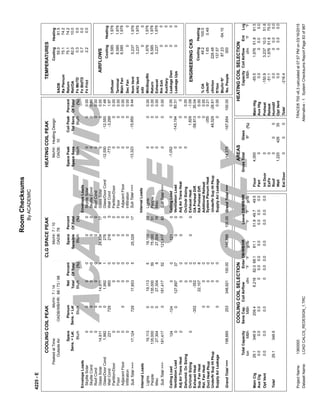
![82
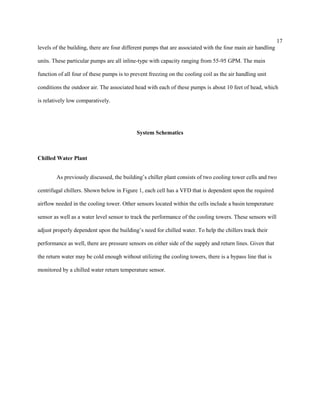
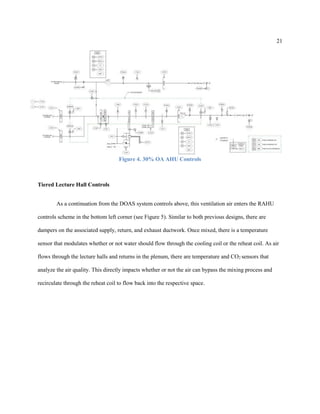
Chapter 3 | Proposed Redesign Analysis
Depth Study 1 | Chilled Beam Implementation
System Definition
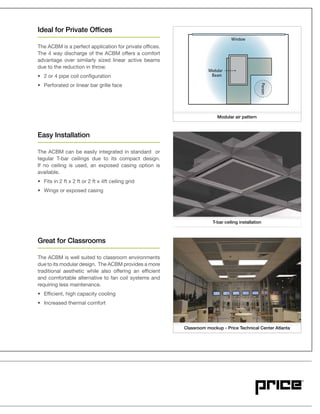
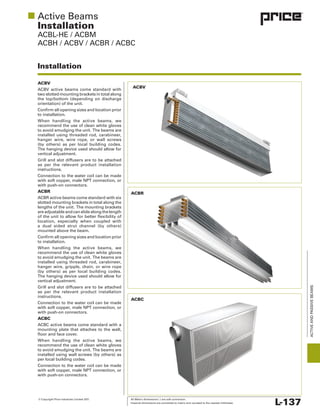
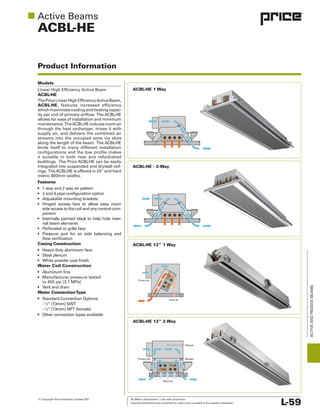
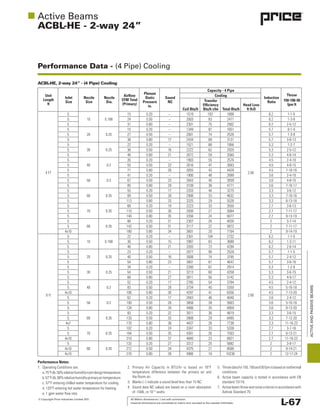
Active Chilled Beams (ACB)
Similar to the fan coils explained above, these units are also decoupled from the standard
ductwork design found in most office buildings in the U.S. While most of the technology and
methodology is similar in these designs, chilled beams operate based on natural air induction as opposed
to fan energy in the fan coils units. Active chilled beams are linked to a 100% dedicated outdoor air
system (DOAS) to account for the humidity levels produced in the respective spaces. However, the main
draw in using this technology is the use of higher cooling water temperatures. Unlike the conventional
supply-return water differential found in FCUs, there is no need for a condensate drain pan or return air
filters because this cooling process does not involve dehumidification or condensation.
Initial Research
The technology used in chilled beams has been around since the late 1930s when Carrier
introduced a high-pressure perimeter induction air system suggested by Tredinnick [1]. Most of the
current technology that has been developed follows this original idea by inducing warm, recirculated,
room air with high-velocity, cold air. According to Tredinnick [1], the first use of a chilled beam radiating
system was installed at the Volvo plant in Gothenburg, Sweden in the late 1960s. Since this first
installation, the technology has transformed from a radiating system into a convective system used
frequently throughout Europe and Australia. For the past 15 years, chilled beams have been the most](https://image.slidesharecdn.com/813e8a98-cb68-49ad-8987-74a4b9856144-150520014650-lva1-app6892/85/Koffke_Thesis-1-83-320.jpg)
![83
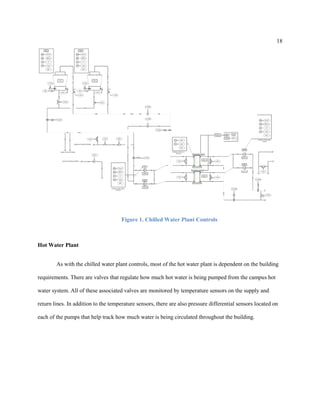
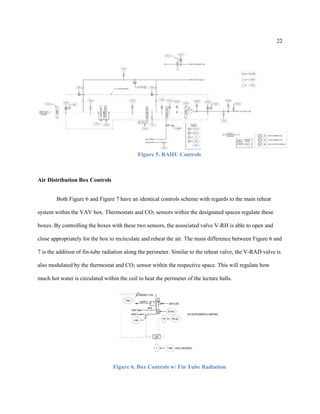
prominent within the European building industry just as air driven systems have been in the U.S. As the
push for ‘green technology’ becomes more widely recognized in the U.S., the transformation has begun
from older techniques into newer ideas and designs such as chilled beams.
Provided by ASHRAE [2], there was a case study conducted in which chilled beams were studied
at Astra Zeneca located in Boston, Massachusetts. With a new technology, it is often difficult to find
pertinent research or practical examples of buildings in the U.S. utilizing the chilled beam system. Astra
Zeneca is an international, research-based pharmaceutical company that is European owned. Prior to
building in the U.S., they had used the chilled beam system and wanted to bring the technology to their
U.S. buildings as well. Since 2000, Astra Zeneca has installed chilled beams in five buildings to serve
offices, laboratories, a cafeteria, and an atrium with south facing glass. Through this study and research of
the installed equipment, it was found that none of the buildings have had condensation issues. Due to the
wide success and ease of use that this system has provided, ASHRAE [2] affirms that Astra Zeneca plans
to build and install another chilled beam system in their newest building design. Their energy model,
based on the performance of the previously studied buildings, shows a $100,000 savings over a
conventional VAV system on a multimillion-dollar project.
Energy Savings
Given today’s industry focus on the energy consumed by buildings, the most pertinent benefit of
implementing the chilled beam system is the associated energy savings potential. Often times, chilled
beams require another specialty system known as a dedicated outdoor air system (DOAS) to manage the
building humidity levels. While this can be seen as a drawback, having to design for an additional system,
the combination of these two technologies meets the requirements of ASHRAE Standard 62.1. This
standard governs the ventilation requirements within commercial buildings, and with the two systems
working together, Roth [3] emphasizes that the required ventilation is actually decreased due to the](https://image.slidesharecdn.com/813e8a98-cb68-49ad-8987-74a4b9856144-150520014650-lva1-app6892/85/Koffke_Thesis-1-84-320.jpg)
![84
precision of the DOAS system in delivering the required ventilation air. In conjunction with the benefit
above, by utilizing these two systems together, the sensible cooling load is decoupled from the ventilation
air delivery. Ultimately, by separating the two systems, the building’s fan energy designed to supply the
appropriate ventilation air can be drastically reduced. Alexander [4] also reiterates this point by saying
that there are perpetual fan energy savings by using chilled beams as compared to VAV and other types of
all-air systems.
Continuing with the associated energy savings of chilled beams, the decrease in required
ventilation airflow also decreases the amount of outdoor air that needs to be conditioned (heated or cooled
appropriately) within the building systems. With less air to condition, the building’s chiller and boiler
systems also see a significant decrease in the associated energy used. Likewise, it is shown by Roth [3]
that chilled beams also operate on a higher chilled water temperature than conventional air conditioning
systems. The average operating temperatures range from 55°F - 63°F compared to the standard 39°F -
45°F chilled water requirement. For building chilled water systems, this is a significant benefit to
implementing a chilled beam cooling system. By adding a dedicated chiller for the chilled beam piping,
this system will see a lower temperature lift because it does not have to cool the water to such extreme
temperatures. Therefore, with a higher operating temperature, the associated chiller should operate at 15%
to 20% higher efficiency than a conventional system according to Roth [3]. In addition to these savings,
the associated DOAS system will also provide the appropriate temperature return water to service the
secondary chilled water loop. Demonstrated by Alexander [4], this recirculation, better known as water-
side economization, of the DOAS return water helps to minimize the total pumping requirements.
Building Limitations
Since chilled beams have trickled into the U.S. market, there have been some limitations
presented by the technology, pertaining mostly to the locations and types of buildings in which they can](https://image.slidesharecdn.com/813e8a98-cb68-49ad-8987-74a4b9856144-150520014650-lva1-app6892/85/Koffke_Thesis-1-85-320.jpg)
![85
be installed. Chilled beams, like all mechanical systems, have their restrictions in which they function the
most efficiently and provide the comfort desired by the building occupants. Therefore, chilled beams have
been used the most repeatedly in commercial office buildings, educational buildings, and some
laboratories with high sensible loads. While this presents a large majority of the building projects in the
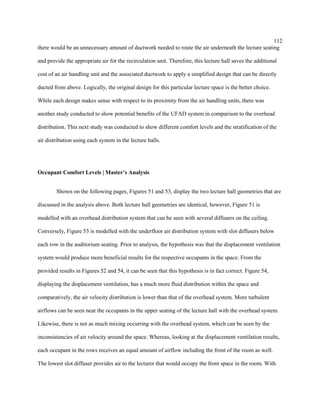
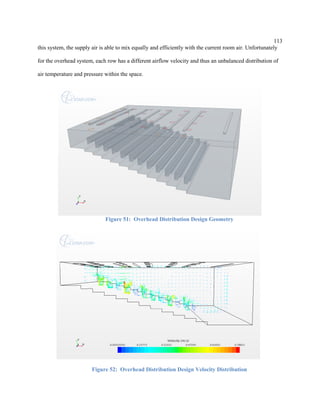
U.S. industry, the technology cannot be used within spaces with high latent loads. Due to the warmer
chilled water used in the system, Tredinnick [1] declares that chilled beams cannot be exposed to humid
conditions or large quantities of unconditioned outside air. These particular spaces and building types
include but are not limited to kitchens, pools, locker rooms, and gymnasiums. Similarly, Roth [3] explains
that the HVAC system must be carefully designed so that high latent loads do not form condensation on
the chilled water supply pipes and cooling coils. In essence, this condensation formed would cause a
raining effect within the building and ruin the interior design elements.
Another limiting factor in the design process is the specific height of the ceiling provided within
the building space. Chilled beams are rated for approximately 14-foot ceilings due to the characteristics of
induced room airflow. Because of the mixing process of conditioned, recirculated air with ventilated air,
there are limitations to which the high density, cold air can reach the floor and appropriately condition the
space. Alexander [4] argues that research and current designs have proven that 14 feet is the maximum
height chilled beams should be designed for to obtain the maximum cooling capabilities provided by this
technology. Additionally, there are certain limitations on specific building types such as hospitals and
certain laboratories. Due to high restrictions on air quality and conditioning within these spaces, chilled
beams are not a plausible option because air is not permitted to be recirculated, but rather directly
exhausted from the building.](https://image.slidesharecdn.com/813e8a98-cb68-49ad-8987-74a4b9856144-150520014650-lva1-app6892/85/Koffke_Thesis-1-86-320.jpg)
![90
Initial Research
Comparison of Fan Coils & Active Chilled Beams
The two main mechanical design schemes that are being studied in this report are fan coil units
and active chilled beams. While fan coils have been a U.S. building standard in conjunction with VAV
terminal boxes, chilled beams have started to trickle into the market through major U.K. owners and
designers. Both systems operate on a similar hydronic scheme, providing equal advantages to plenum
design and saving on building space; however, each system works on different physical principles making
each design advantageous in different aspects. Through research of articles in major mechanical
engineering journals such as ASHRAE and ASME, there have been several authors that outline the future
of each technology.
To start, both fan coil units and active chilled beams have different working temperatures that
allow each system to operate in a specific way. Fan coils are designed based on typical U.S. building
water temperatures. Therefore, the standard chiller cools the water to 39°F - 45°F and the fan coil runs on
these temperatures to cool the associated space. Conversely, the chilled beam system is designed on a
different principle where the operating temperatures are 55°F - 63°F. While fan coils have the ability to
operate on a similar temperature differential, The Chilled Beams & Ceilings Association [5] cautions that
the maximum sensible chilled water temperature should only be raised to around 50°F. Anything above
this temperature set point would involve dehumidifying the air at the air-handling unit, which would add
cost to the overall system.
Another major component of the technical design involved in mechanical systems is the fan
requirements to move the air in the appropriate manner. One of the major differences in these systems is
the use of a fan at each individual space or a central fan at the air handling unit. Fan coil units, as the
name suggests, have a built-in fan that moves the air about the space. Utilizing a fan per space in this
manner has different consequences from a technical perspective. Ultimately, this allows each unit to](https://image.slidesharecdn.com/813e8a98-cb68-49ad-8987-74a4b9856144-150520014650-lva1-app6892/85/Koffke_Thesis-1-91-320.jpg)
![91
perform in a flexible manner because not only can this system circulate the air, but also can dehumidify
the air within the space. On the other hand, active chilled beams operate on a higher working temperature
so that the system does not condensate and create unwanted moisture within the building plenum.
Therefore, with higher working temperatures, the chilled beam system must be designed in conjunction
with a DOAS system that can actively dehumidify the space as well. This involves a separate unit to pull
outdoor air into the building and ventilate each space with the appropriate conditioned air.
The use of an individualized fan also allows the fan coil units to respond fairly quickly in a
sudden temperature change within the building space. Because chilled beams recirculate air based on
induction properties and rely mostly on the hydronic component of the system, there is slower response
time than the fan coil units. According to Holland [6], chilled beams effectively move 30-40% more air
around the space for the same cooling load as compared to fan coils. He explains that this essentially
limits the cooling capacity of a chilled beam, whereas a fan coil unit can be connected to a more superior
air distribution device that moves the air in a more effective manner. On the other hand, having a fan in
each space also causes unwanted and unnecessary noise that is often associated with older mechanical
systems. Unlike the chilled beam system, a virtually silent system because of the low-velocity air
distribution and induced air recirculation, the fan coils must have a sound attenuator to operate in certain
spaces. The fans may be selected to run at an appropriate background noise level (BNL) for classroom
and office spaces; however, this also requires a higher upkeep and more frequent maintenance. With any
added debris in the system, the increased pressure on the fan will cause a louder, less efficient
performance. On the contrary, Alexander [4] shows that in a properly designed ACB project, the coil
surfaces will not condense and the fins will remain dry. Therefore, maintenance vacuuming can be as
infrequent as once every three to five years.
From the information provided on the technical side, there is evidence in favor of each system
respectively. However, system energy usage and overall building consumption seem to be the driving
factor in today’s mechanical designs. While fan coil units have individualized fans in each space,](https://image.slidesharecdn.com/813e8a98-cb68-49ad-8987-74a4b9856144-150520014650-lva1-app6892/85/Koffke_Thesis-1-92-320.jpg)
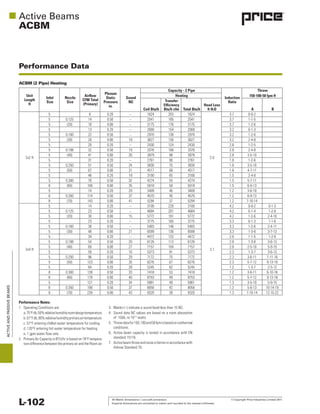
![92
providing advantages as described above, the active chilled beam system requires a centralized DOAS
unit to provide the adequate ventilation air. Argued by Alexander [4], by decoupling the ventilation load
from the individual space loads, there are perpetual fan energy savings as compared to VAV and other
types of all-air systems.
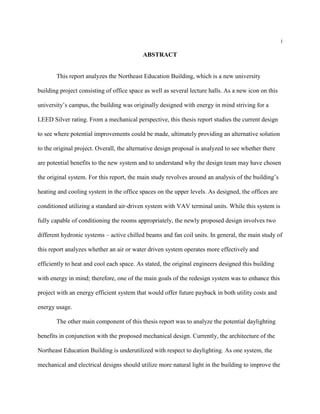
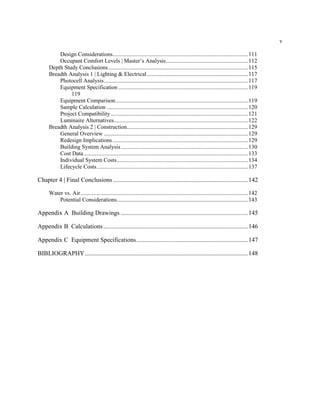
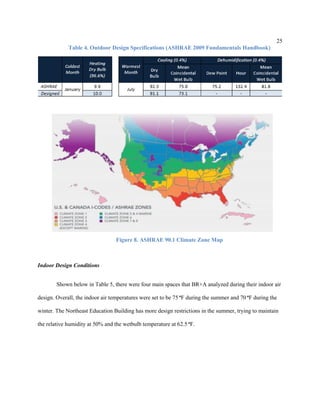
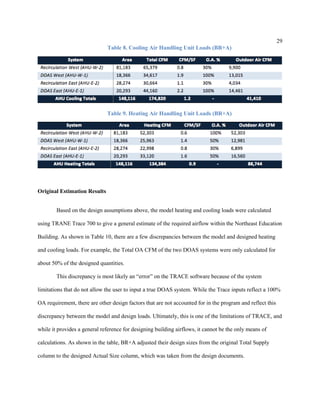
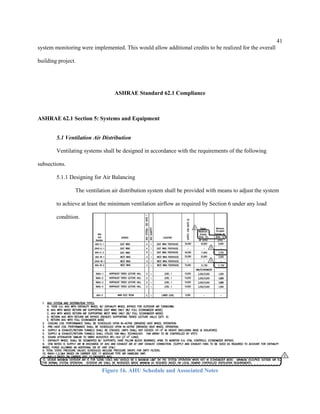
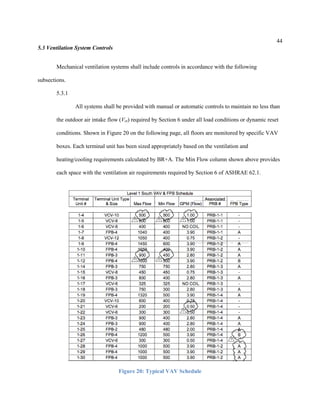
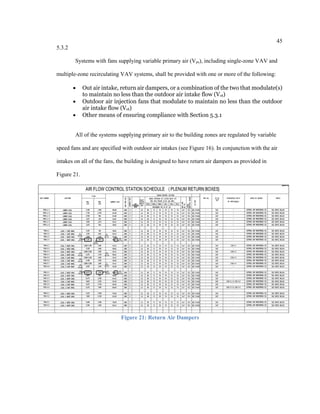
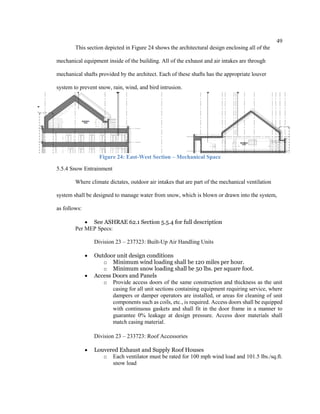
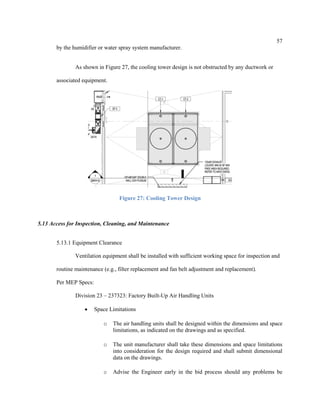
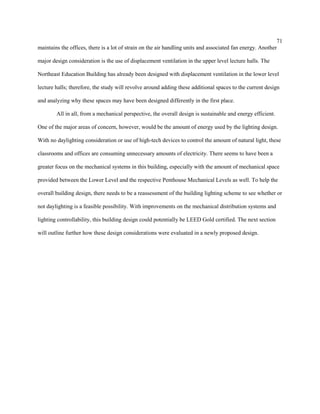
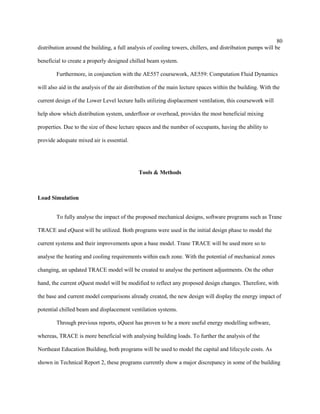
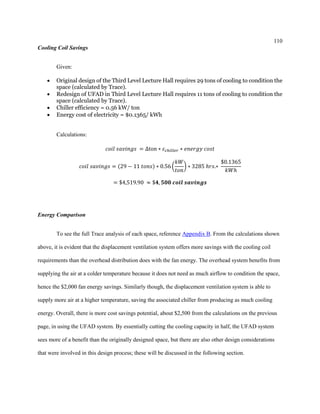
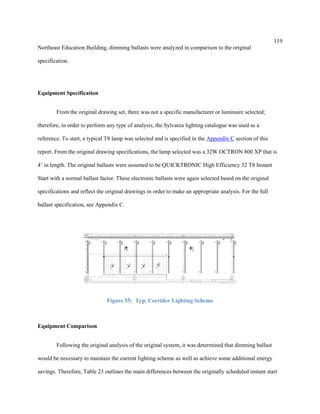
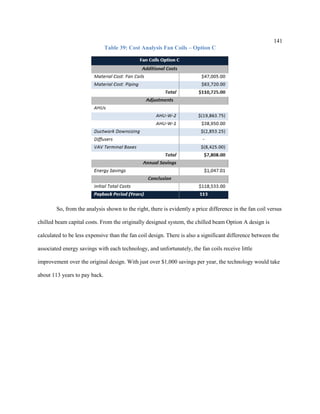
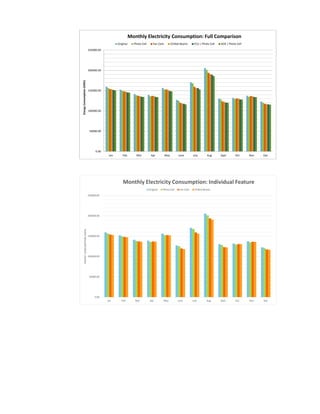
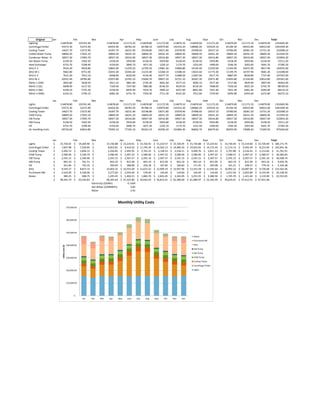
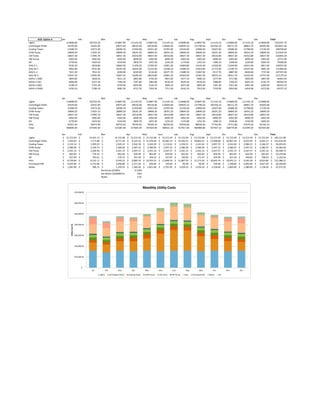
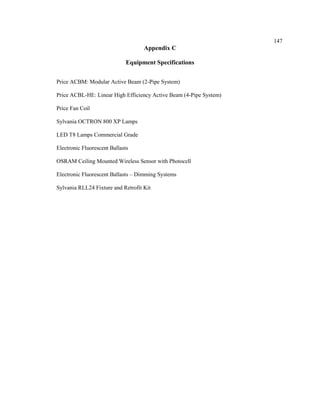
Figure 41: Annual Cooling Needs (MWh/year)
In Figure 41, provided by Ventura [7], he shows that while each system has its different cooling
requirements based on the technical aspects of design, the total MWh/year is practically identical (see
previous page). Therefore, as described previously, it is not necessarily the total cooling needed in the
building, but more so how the system operates and utilizes the associated energy.
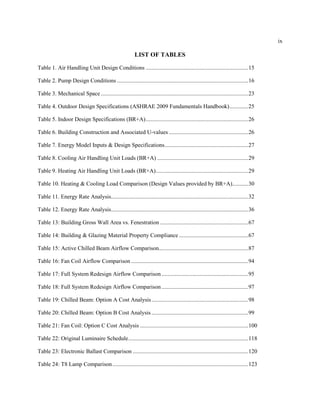
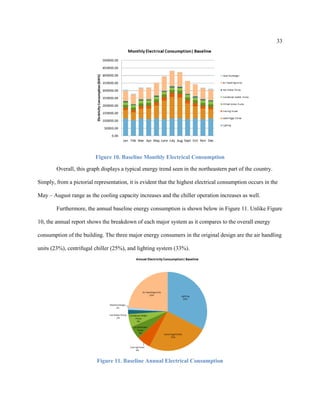
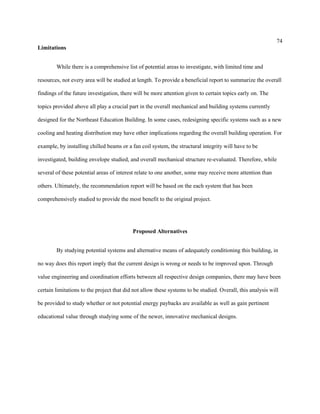
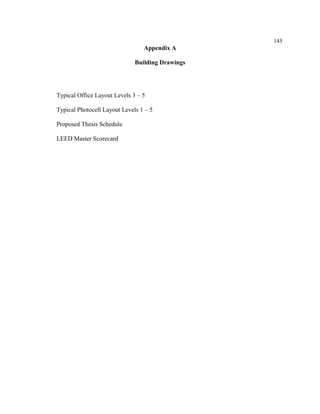
Figure 42: Electrical Annual Consumption (MWh/year)
As argued by Alexander [4], Ventura [7] also offers a similar argument that is shown in Figure
42. This graph easily depicts how most of the associated components of each system are almost identical
MWh/y
MWh/y](https://image.slidesharecdn.com/813e8a98-cb68-49ad-8987-74a4b9856144-150520014650-lva1-app6892/85/Koffke_Thesis-1-93-320.jpg)
![93
in electrical energy usage – all except for the terminal unit fans. Ventura [7] states that the chilled beams
help to reduce ventilation energy consumption by ~30%, and the absence of motors in the ACB design
contributes significantly to its decline. Overall, there is approximately a relative difference of 18.5% in
overall electrical consumption.
As demonstrated by the above figures and associated information, energy consumption and
payback potential is extremely significant in mechanical design. Both systems offer equal cooling
requirements; however, it is the way in which the systems consume energy that differentiates chilled
beams and fan coil units. While 18.5% electrical consumption is not ground-breaking, a projected life
cycle cost would outline a substantial difference in each system.
Spaces Analyzed
Different than the previous analysis of the chilled beam redesign, the proposed fan coil redesign
only reflects the spaces in that of Figures 40 and 41, Option A. The reason the fan coils were not split into
two scenarios like the chilled beams is because of how this system works differently than the active
chilled beams. While both hydronic systems, the fan coils have individualized fans in each unit as
described above. This allows the system to operate similarly whether the unit is serving an interior or
exterior space because it has the ability to throw the cold or hot air to condition the space. In that respect,
there would be no real advantage to creating two space analyses because there is no additional equipment
required like the radiant paneling for active chilled beams in exterior spaces.](https://image.slidesharecdn.com/813e8a98-cb68-49ad-8987-74a4b9856144-150520014650-lva1-app6892/85/Koffke_Thesis-1-94-320.jpg)


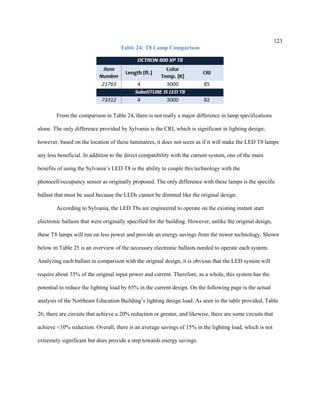
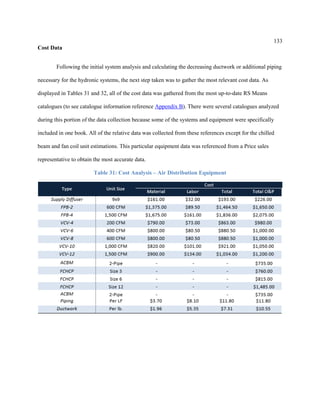
![121
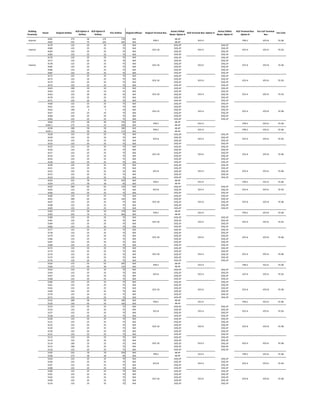
Use single lamp ballast to perform the calculation. The input wattage will be based on
dimming ballast values for the part load performance (30/8W) and the instant start ballast
for constant full load performance (28W).
Calculations:
6 Hours (full load lighting)
6 Hours (5% lighting load)
6ℎ𝑟𝑠 ∗ 30𝑊 + 6ℎ𝑟𝑠 ∗ 8𝑊 = 228 [𝑊 − ℎ𝑟𝑠]
12 ℎ𝑟𝑠 ∗ 28𝑊 = 336 [𝑊 − ℎ𝑟𝑠]
1 − (
228
336
) = 𝟑𝟐. 𝟏𝟓% 𝒓𝒆𝒅𝒖𝒄𝒕𝒊𝒐𝒏
Project Compatibility
While not the most technical calculation, this example shows that even with a basic assumption of
full load and 5% part load throughout the average day, there is potential to save 32.15% on the daily
wattage needed to power the luminaires. In that respect, applying the photocells and dimming ballasts
would be a beneficial step towards saving electricity on an annual basis. Overall, the ballasts are
compatible seeing that this analysis uses both Sylvania specified equipment. As of now, another potential
concern would be the placement of each photocell based on the proximity of light available through the
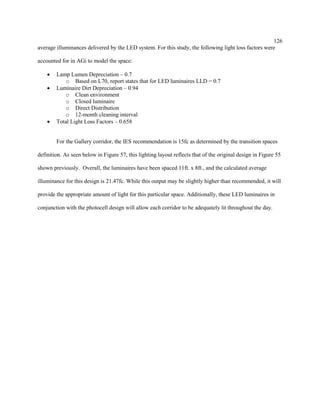
exterior glazing and adapting to the current ceiling plan.
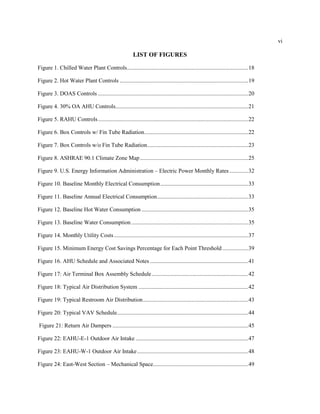
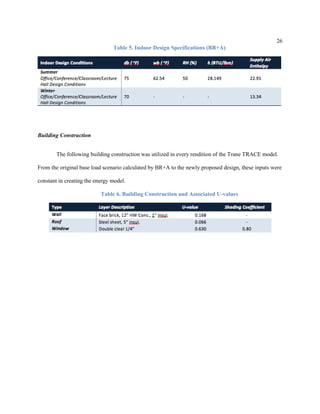
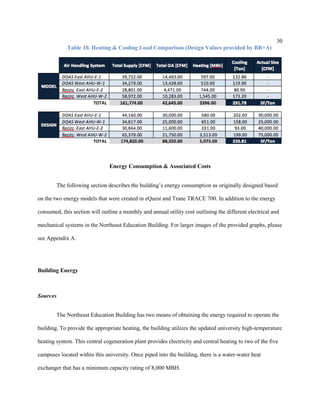
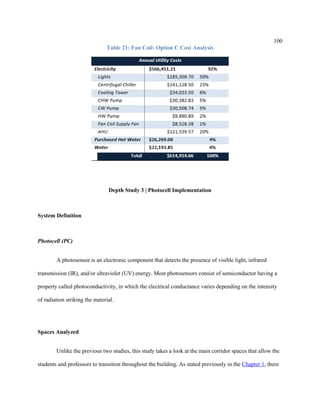
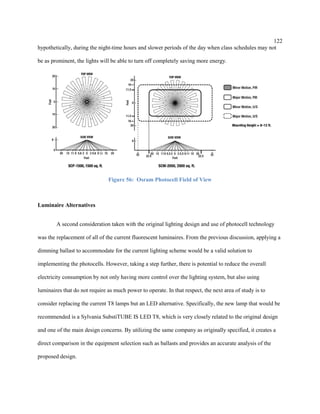
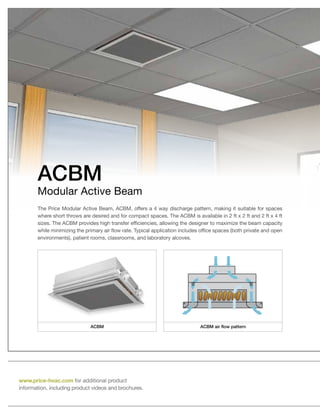
Fortunately, with the specified OSRAM ENCELIUM Ceiling-Mounted Occupancy Sensors
specified in Appendix C, there is a wide range of sensors that can be installed in different size spaces. For
example, displayed below in Figure 56, there are two examples of sensor ranges – 1,500 and 2,000 sq. ft.
The image displayed on the right provides a good explanation of the different capabilities available with
these specific occupancy/photocell sensors. Not only will these specific sensors have the ability read the
available light in the area, but also they are able to detect motion in and out of the space. So](https://image.slidesharecdn.com/813e8a98-cb68-49ad-8987-74a4b9856144-150520014650-lva1-app6892/85/Koffke_Thesis-1-122-320.jpg)
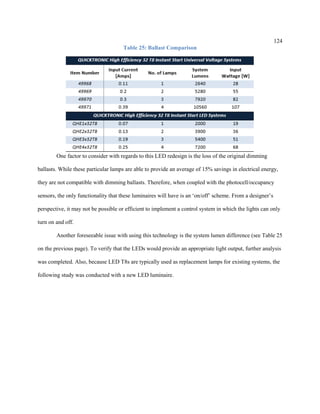
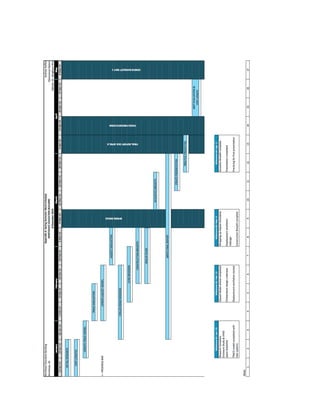
![N O R T H E A S T | U N I T E D S T A T E S
buildinginfo.
electricalsystem.
mechanicalsystem.
lightingdesign. structuralsystem.
architecture.
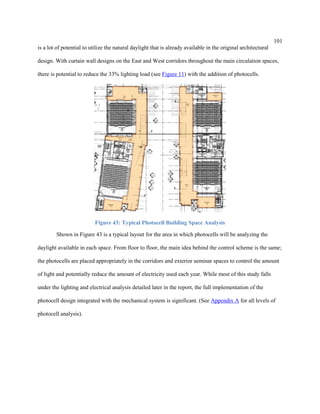
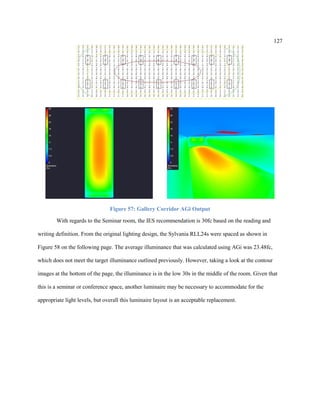
Southeast View Overall Project Rendering Southwest View
Occupancy: Office | Classroom | Lecture Hall
Size: 200,000 SF
Height: 6 Floors above grade
Project Team: Elkus | Manfredi Architects, Thornton
Tomasetti, BR+A, Convergent Technologies Design
Group, Inc., Joseph Jingoli & Son, Inc., Hargreaves
Associates, PS&S
Schedule: June 2014 (construction begins)
August 2016 (construction ends)
Cost: $75 Million
Delivery Method: Design - Build
Heating: Campus high temperature, hot water is piped directly
into a high pressure water-water heat exchanger which
distributes hot water to fin tube radiation, unit heaters,
and eight air handling units.
Chiller: A chiller plant is located within the penthouse consisting
of two cooling towers and a centrifugal chiller. This
system serves 600 tons of chilled water to nine air
handling units.
Energy: There are four air handling units that incorporate an
enthalpy wheel into the building’s distribution system. A
DOAS is used to efficiently ventilate the main lecture halls
within the building.
Service: Two primary feeders, both 3#500 [5KV each]
Main Distribution: Two main campus feeders supply the
building's electricity. These feeders are brought
directly into the main electrical substation and
emergency substation. The 2,500KVA transformer
and 5KV emergency station distribute power to
eight distibution panels, all of which are 3 phase,
480/277V. These panels supply all of the building's
receptacles and lighting in the classroom and office
spaces.
Main Design: The design of this project resembles classic,
academic architecture with a new spin on the flow
and functionality of the design space. With brick and
limestone facades on the opposing faces of the east
and west wings, the new Education Building will
complement the surrounding buildings that have
defined this institution for over 200 years. On the
interior faces of each wing, a more modern, glazing
system has been chosen in conjunction with the
limestone accents.
Overall System: From floor to floor, there is a consistent
steel framing system that supports a concrete slab
with metal decking. Steel cross bracing is used on
the exterior of the building as well as underneath all
of the mechanical equipment in the penthouse.
Lecture Halls: A lighting consultant designed all of the
lecture halls to be lit from above by recessed 4’ and
8’ linear fixtures. Each hall is equipped with a multi-
scene lighting control station near the podium and a
4-button controller near the entrances.
contact: koffke@psu.edu
website: http://akoffke.wix.com/northeasteducation
advised by: Dr. Rim
A N D R E W K O F F K E M E C H A N I C A L
All images courtesy of Elkus|Manfredi Architects](https://image.slidesharecdn.com/813e8a98-cb68-49ad-8987-74a4b9856144-150520014650-lva1-app6892/85/Koffke_Thesis-1-155-320.jpg)
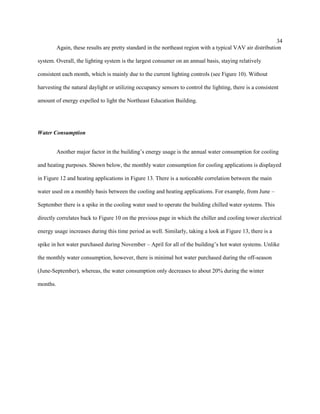
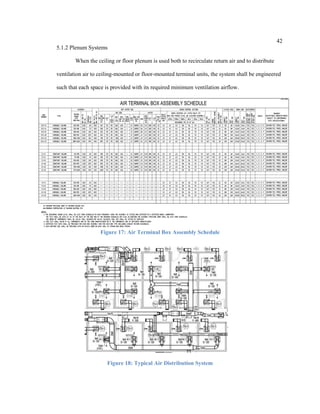
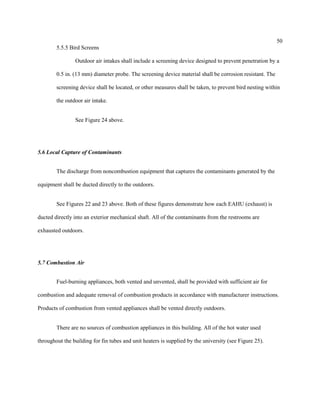
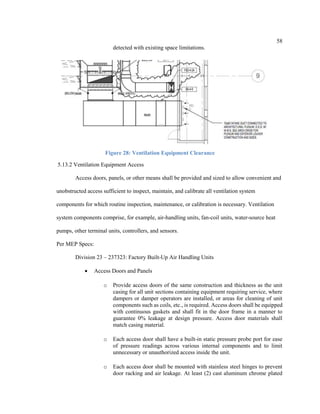
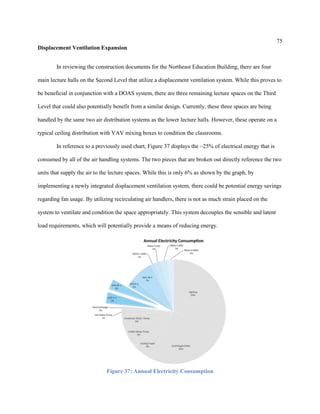
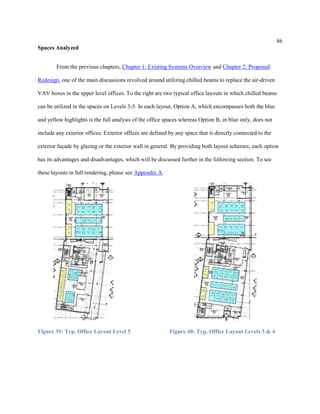
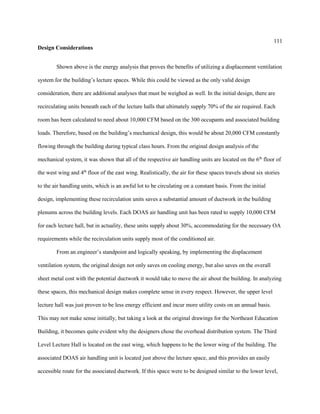
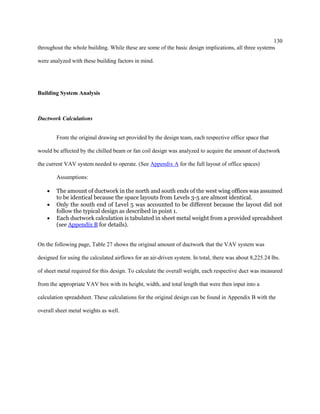
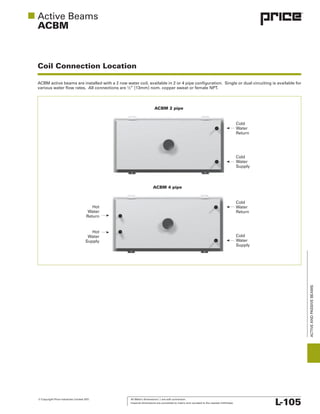
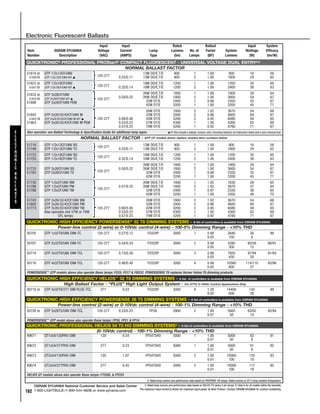
![MaterialLaborTotalTotalO&P
SupplyDiffuser9x9161.00$32.00$193.00$226.00$233713.10Mechanical20150530
FPB-2600CFM1,375.00$89.50$1,464.50$1,650.00$233616.10Mechanical20155830FanPoweredVAV
FPB-41,500CFM1,675.00$161.00$1,836.00$2,075.00$233616.10Mechanical20155870FanPoweredVAV
VCV-4200CFM790.00$73.00$863.00$980.00$233616.10Mechanical20155610VAV
VCV-6400CFM800.00$80.50$880.50$1,000.00$233616.10Mechanical20155620VAV
VCV-8600CFM800.00$80.50$880.50$1,000.00$233616.10Mechanical20155630VAV
VCV-101,000CFM820.00$101.00$921.00$1,050.00$233616.10Mechanical20155650VAV
VCV-121,500CFM900.00$134.00$1,034.00$1,200.00$233616.10Mechanical20155670VAV
PipingperLF3.70$8.10$11.80$11.80$D2090810Assemblies201518401/2",3/4",1"
Ductworkperlb1.96$5.35$7.31$10.55$233113.13Facilities201510605,000+lbs.
ABCL-HE4-Pipe---910.00$NAPriceNA4PipeACB
ACBM2-Pipe---735.00$NAPriceNA2PipeACB
FCHCPSize3---760.00$NAPriceNAFanCoils
FCHCPSize6---815.00$NAPriceNAFanCoils
FCHCPSize12---1,485.00$NAPriceNAFanCoils
CatalogNumberNotes
MaterialLaborTotalTotalO&P
AHU20,00066,500.00$3,425.00$69,925.00$77,900.00$237413.10Mechanical20152120
AHU25,00084,075.00$4,150.00$88,225.00$98,325.00$237413.10Mechanical20152140
AHU30,000101,650.00$4,875.00$106,525.00$118,750.00$237413.10Mechanical20152180
AHU35,000109,012.50$5,675.00$114,687.50$128,012.50$237413.10Mechanical20152181
AHU40,000116,375.00$6,475.00$122,850.00$137,275.00$237413.10Mechanical20152200
AHU55,000151,240.00$8,100.00$159,340.00$170,525.00$237413.10Mechanical20152210
AHU60,000152,498.75$8,900.00$161,398.75$177,146.25$237413.10Mechanical20152215
AHU65,000153,757.50$9,700.00$163,457.50$183,767.50$237413.10Mechanical20152217
AHU75,000156,275.00$11,300.00$167,575.00$197,010.00$237433.10Mechanical20152220
NotesTypeUnitSize
Cost
RSMeansSectionCatalogNumber
RSMeans
Manufacturer
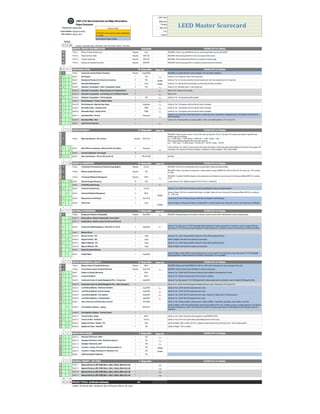
CostAnalysis:AirDistributionEquipment
CostAnalysis:AirHandlingUnits
RSMeansSection
Cost
TypeUnitSize[CFM]RSMeans](https://image.slidesharecdn.com/813e8a98-cb68-49ad-8987-74a4b9856144-150520014650-lva1-app6892/85/Koffke_Thesis-1-159-320.jpg)
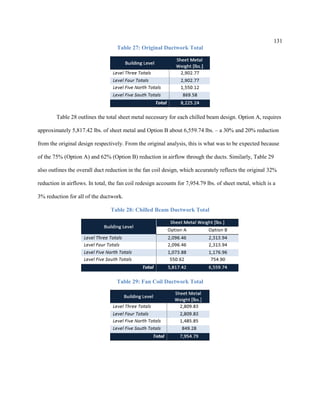
![Terminal Box Duct Width Duct Height Duct Length Sheet Metal Weight (lbs./LF) Total Weight (lbs.) Notes
3-5 12 6 12 3.42 41.04 Exterior
12 6 14 3.42 47.88
3-11 12 6 18 3.42 61.56 Exterior
3-6 12 6 14 3.42 47.88
12 6 20 3.42 68.4
3-9 12 6 21 3.42 71.82
12 6 45 3.42 153.9
3-10 12 6 35 3.42 119.7
12 6 16 3.42 54.72
3-13 12 6 18 3.42 61.56
12 6 27 3.42 92.34
3-12 12 6 22 3.42 75.24
12 6 52 3.42 177.84
3-15 12 6 18 3.42 61.56 Exterior
12 6 6 3.42 20.52
3-28 12 6 22 3.42 75.24 Exterior
12 6 8 3.42 27.36
3-20 12 6 18 3.42 61.56
12 6 20 3.42 68.4
3-19 12 6 18 3.42 61.56
12 6 41 3.42 140.22
3-22 12 6 33 3.42 112.86
12 6 23 3.42 78.66
3-25 12 6 15 3.42 51.3
12 6 24 3.42 82.08
3-23 12 6 10 3.42 34.2
12 6 43 3.42 147.06
Weight Including Ext. Weight Excluding Ext.
2,096.46 2,313.94
5-18 12 6 17 3.42 58.14
12 6 13 3.42 44.46
12 6 27 3.42 92.34
5-23 12 6 40 3.42 136.8 Exterior
12 6 18 3.42 61.56
12 6 12 3.42 41.04
5-22 12 6 16 3.42 54.72
12 6 18 3.42 61.56
Weight Including Ext. Weight Excluding Ext.
550.62 754.90
Including Ext. Excluding Ext.
2,096.46 2,313.94
2,096.46 2,313.94
1,073.88 1,176.96
550.62 754.90
5,817.42 6,559.74Total
Level Three Take OffsNorthSouth
Level Three Totals
Level Five South Take Offs
Level Five South Totals
Building Level
Level Three Totals
Level Four Totals
Level Five North Totals
Level Five South Totals
Sheet Metal Weight [lbs]](https://image.slidesharecdn.com/813e8a98-cb68-49ad-8987-74a4b9856144-150520014650-lva1-app6892/85/Koffke_Thesis-1-160-320.jpg)
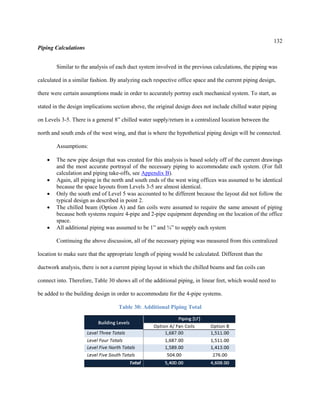
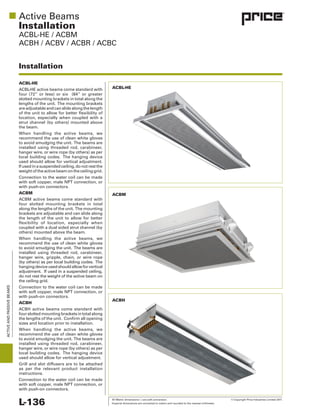
![Pipe Size Pipe Length Notes
1" 275 Main Run to 8" CHS/R
636 Interior Beams - 2 Pipe
3/4" 600 Interior Beams - 2 Pipe
176 Exterior Beams - 4 Pipe
Pipe Size Pipe Length Notes
1" 80 Interior Beams - 2 Pipe
3/4" 98 Interior Beams - 2 Pipe
228 Exterior Beams - 4 Pipe
Option A/ Fan Coils Option B
1,687.00 1,511.00
1,687.00 1,511.00
1,589.00 1,413.00
504.00 276.00
5,400.00 4,608.00
Piping [LF]
Building Levels
Level Five South Totals
Total
Level Three Take Offs
Level Five South Take Offs
Level Three Totals
Level Four Totals
Level Five North Totals](https://image.slidesharecdn.com/813e8a98-cb68-49ad-8987-74a4b9856144-150520014650-lva1-app6892/85/Koffke_Thesis-1-161-320.jpg)
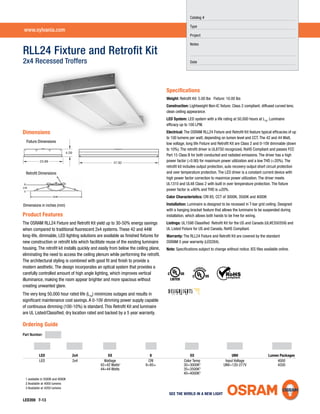
![Level
OriginalCircuit
Load[W]
No.ofLampsQuantityInputPower[W]
OriginalLuminaire
Load[W]
RedesignLum.
Load[W]
ΔLoad[W]
RedesignCircuit
Load[W]
AveragePower
Savings
OriginalLuminaire
Current[A]
RedesignLum.
Current[A]
ΔCurrent[A]
RedesignCircuit
Current[A]
4106810706803903.92.51.4
21365536190.20.130.07
700283644028815254822%1.61.040.56
223611072380.40.260.14
25362751809510.650.35
45685353401951.951.250.7
400283644028815224838%1.61.040.56
24004216822471428819158134%8.195.252.94
16002836440288152144810%1.61.040.56
2436220144760.80.520.28
213367154682472.61.690.91
47687494762732.731.750.98
150025362751809514056%10.650.35
16002836440288152144810%1.61.040.56
1400263633021611412868%1.20.780.42
27363852521331.40.910.49
2436220144760.80.520.28
2336165108570.60.390.21
1919252171810.990.630.36
4106810706803903.92.51.4
25362751809510.650.35
1400263633021611412868%1.20.780.42
10002436220144769248%0.80.520.28
1800263633021611416866%1.20.780.42
240023361651085723432%0.60.390.21
2000283644028815218488%1.61.040.56
15%TotalAverageSavings
1
2
3
4
5
1991
2300
2000
1700
147.68
149.3
148.81
17%
16%
30%
12%
9%
21%
147.97
148.25
146.5
146.92
148.81
1672
1404
1491
1462
1815
1600
2400
2000](https://image.slidesharecdn.com/813e8a98-cb68-49ad-8987-74a4b9856144-150520014650-lva1-app6892/85/Koffke_Thesis-1-164-320.jpg)


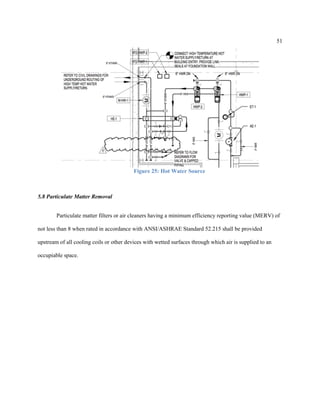
![OF REV
ALL METRIC DIMENSIONS ( ) ARE SOFT CONVERTED. IMPERIAL DIMENSIONS ARE CONVERTED TO METRIC AND ROUNDED TO THE NEAREST MILLIMETER.
SHEET
SolidEdge
1 1 J
FAN COIL
2011/10/31
243642
PROJECT:
ENGINEER:
CUSTOMER:
SUBMITTAL DATE: SPEC. SYMBOL:
© Copyright PRICE INDUSTRIES 2011
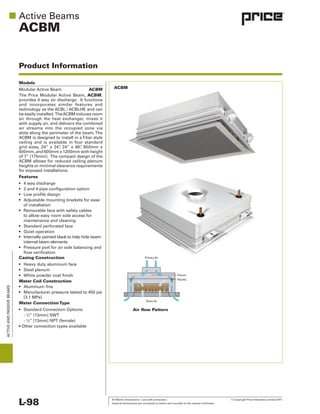
Submittal Sheet
HORIZONTAL CONCEALED
WITH PLENUM
FC - H - C - P
A
SIZE 02-12
DRAIN PAN
SLOPED
TOWARD
DRAIN
FITTING
PIPE
SYSTEM C in.(mm) D in.(mm) E in.(mm)
1 OR 2 ROW
2 PIPE 16.2 (412) 20 (508) 24.6 (625)
3 OR 4 ROW
2 PIPE 21.2 (539) 25 (635) 29.6(752)
4 PIPE 24.8 (630) 28.6 (726) 33.2 (843)
FC-PSC3 CONTROLS
ENCLOSURE
!
PIC-FC CONTROLS
ENCLOSURE
!
STANDARD CONSTRUCTION:
• 20ga. GALVANIZED STEEL CASING
• GALVANIZED HARDWARE
• COOLING COIL EQUIPPED WITH
GALVANIZED STEEL DRAIN PAN EXTERNALLY
INSULATED WITH FOAM
• 3/4" NPT DRAIN CONNECTION
• PSC ELECTRIC MOTORS WITH 3 SPEEDS
• COILS - 1/2" O.D. COPPER TUBES, ALUMINUM
SINE WAVE FINS, 5/8" OD CONNECTIONS
• 1" THICK THROWAWAY FILTER WITH FIBERGLASS
MESH MEDIA
• INTERNAL INSULATION - FIBERGLASS 1/2" (13mm)
THICK
OPTIONS:
! STAINLESS STEEL INSULATED DRAIN PAN
! SECONDARY DRAIN
! DISCONNECT SWITCH
! MOTOR FUSE
!115V 50-60Hz/1PH MOTOR WITH 3 SPEED
!208-240V/50-60Hz/1PH MOTOR WITH 3 SPEED
! 277V/60Hz/1PH MOTOR WITH 3 SPEED
! HANGER BRACKETS
! THERMOSTAT - SHIPPED LOOSE
! FF50 (FIBERFREE), LINER 1/2" THICK
! FB FOIL FACED FIBERGLASS LINER 5/8" THICK
! AUXILARY DRAIN PAN
! MOTOR QUICK CONN. WIRE HARNESS
! 2 PIPE SYSTEM
! 1 - ROW ! 2 - ROW ! 3 - ROW ! 4 - ROW
! 4 PIPE SYSTEM
! W/ PREHEAT (HEATING/COOLING)
! 1/3 - ROW ! 2/3 - ROW ! 1/4 - ROW ! 2/4 - ROW
! W/ REHEAT (COOLING/HEATING)
! 3/1 - ROW ! 3/2 - ROW ! 4/1 - ROW !4/2 - ROW
C
8.0
202
C
D E
10.6
270
CFM l/s 115V 208/240V 277V
02 200 94 16.0 (406) 28.1 (714) 1 1/30 0.7 0.5 0.5
03 300 142 25.0 (635) 37.4 (950) 1 1/30 0.7 0.5 0.5
06 600 283 30.0 (762) 42.1 (1069) 2 1/10 1.8 0.7 0.64
08 800 378 40.0 (1016) 52.1 (1323) 2 1/10 1.8 0.7 0.64
10 1000 472 50.0 (1270) 62.1 (1577) 3 1/10, 1/30 2.5 1.2 1.14
12 1200 566 60.0 (1524) 71.8 (1824) 4 1/10, 1/10 3.28 1.4 1.28
TOTAL AMPS
SIZE
NOMINAL A
in. (mm)
B
in. (mm)
# OF
BLOWERS MOTORS (HP)
NOTE:
TOTAL UNIT AMPS SHOWN
ARE BASED ON MOTOR
SPECIFICATIONS. ACTUAL
PERFORMANCE WILL VARY
WITH THE APPLICATION
8
[202]
A
AIR
FLOW
AUXILARY DRAIN PANOPTIONAL
B
13.8
352
RH CONFIGURATION
SHOWN
HANDING
DETERMINED BY
LOOKING AT INLET](https://image.slidesharecdn.com/813e8a98-cb68-49ad-8987-74a4b9856144-150520014650-lva1-app6892/85/Koffke_Thesis-1-196-320.jpg)
![OF REV
ALL METRIC DIMENSIONS ( ) ARE SOFT CONVERTED. IMPERIAL DIMENSIONS ARE CONVERTED TO METRIC AND ROUNDED TO THE NEAREST MILLIMETER.
SHEET
SolidEdge
1 1 J
FAN COIL
2011/10/31
246798
PROJECT:
ENGINEER:
CUSTOMER:
SUBMITTAL DATE: SPEC. SYMBOL:
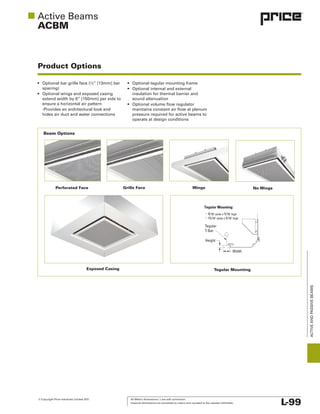
Submittal Sheet
© Copyright PRICE INDUSTRIES 2011
10.6
269
8.0
202
A
HORIZONTAL CONCEALED
W/OUT PLENUM
FC - H - C - B
STANDARD CONSTRUCTION:
• 20ga. GALVANIZED STEEL CASING
• GALVANIZED HARDWARE
• COOLING COIL EQUIPPED WITH
GALVANIZED STEEL DRAIN PAN EXTERNALLY
INSULATED WITH FOAM
• 3/4" NPT DRAIN CONNECTION
• PSC ELECTRIC MOTORS WITH 3 SPEEDS
• COILS - 1/2" O.D. COPPER TUBES,
ALUMINUM SINE WAVE FINS, 5/8" OD
CONNECTIONS
SIZE 02-12
DRAIN PAN
SLOPED
TOWARD
DRAIN
FITTING
OPTIONS:
! STAINLESS STEEL INSULATED DRAIN PAN
! SECONDARY DRAIN
! DISCONNECT SWITCH
! MOTOR FUSE
! THERMOSTAT - SHIPPED LOOSE
! 115V/50-60Hz/1PH MOTOR WITH 3 SPEEDS
! 208-240V/50-60Hz/1PH MOTOR WITH 3 SPEEDS
! 277V/60Hz/1PH MOTOR WITH 3 SPEEDS
! HANGER BRACKETS
! AUXILARY DRAIN PAN
! MOTOR QUICK CONN. WIRE HARNESS
! 2 PIPE SYSTEM
! 1 - ROW ! 2 - ROW ! 3 - ROW ! 4 - ROW
! 4 PIPE SYSTEM
! W/ PREHEAT (HEATING/COOLING)
! 1/3 - ROW ! 2/3 - ROW ! 1/4 - ROW ! 2/4 - ROW
! W/ REHEAT (COOLING/HEATING)
! 3/1 - ROW ! 3/2 - ROW ! 4/1 - ROW !4/2 - ROW
FC-PSC3 CONTROLS
ENCLOSURE
!
PIC-FC CONTROLS
ENCLOSURE
!
D E
C
C C
PIPE SYSTEM C in.(mm) D in.(mm) E in.(mm)
1 OR 2 ROW
2 PIPE 13.9 (353) 20 (508) 24.4 (620)
3 OR 4 ROW
2 PIPE 18.9 (480) 25 (635) 29.4 (747)
4 PIPE 22.5 (571) 28.6 (726) 33 (838)
CFM l/s 115V 208/240V 277V
02 200 94 16.0 (406) 28.1 (714) 1 1/30 0.7 0.5 0.5
03 300 142 25.0 (635) 37.4 (950) 1 1/30 0.7 0.5 0.5
06 600 283 30.0 (762) 42.1 (1069) 2 1/10 1.8 0.7 0.64
08 800 378 40.0 (1016) 52.1 (1323) 2 1/10 1.8 0.7 0.64
10 1000 472 50.0 (1270) 62.1 (1577) 3 1/10, 1/30 2.5 1.2 1.14
12 1200 566 60.0 (1524) 71.8 (1824) 4 1/10, 1/10 3.28 1.4 1.28
TOTAL AMPS
SIZE
NOMINAL A
in. (mm)
B
in. (mm)
# OF
BLOWERS MOTORS (HP)
NOTE:
TOTAL UNIT AMPS SHOWN
ARE BASED ON MOTOR
SPECIFICATIONS. ACTUAL
PERFORMANCE WILL
VARY WITH THE
APPLICATION
8
[202]
A
AUXILARY DRAIN PANOPTIONAL
B
13.8
352
RH CONFIGURATION
SHOWN
HANDING
DETERMINED BY
LOOKING AT INLET](https://image.slidesharecdn.com/813e8a98-cb68-49ad-8987-74a4b9856144-150520014650-lva1-app6892/85/Koffke_Thesis-1-197-320.jpg)

![148
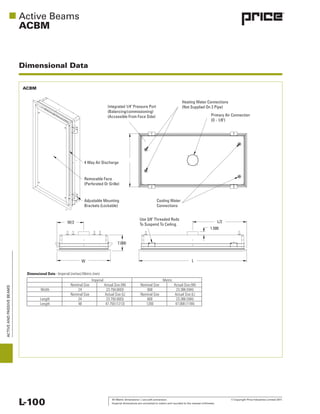
BIBLIOGRAPHY
[1] Tredinnick, S., 2009, “Chilled Beams: Not your everyday weapon against heat,” Inside
Insights: International District Energy Assocation, pp. 77-79.
[2] Pope, K. and Leffingwell, J., n.d., “Chilled Beams: The new system of choice?,” ASHRAE
Journal, pp. 26-27.
[3] Roth, K. 2007, “Emerging Technologies: Chilled Beam Cooling,” ASHRAE Journal, pp. 84-
86.
[4] Alexander, D. 2008, “Design Considerations For Active Chilled Beams,” ASHRAE Journal,
pp. 50-59.
[5] Jackson, A., 2013, “Tas Study Takes a Close Look at Chilled Beams,” Modern Building
Services, pp. 1-4.
[6] Holland, M., 2010, “Chilled Beams Versus Fan Coils,” Building Services & Environmental
Engineer, p. 30.
[7] Ventura, F. 2013, “Comparative study of HVAC systems in hospitals: chilled beams and fan
coils,” REHVA Journal, pp. 19-22.](https://image.slidesharecdn.com/813e8a98-cb68-49ad-8987-74a4b9856144-150520014650-lva1-app6892/85/Koffke_Thesis-1-211-320.jpg)