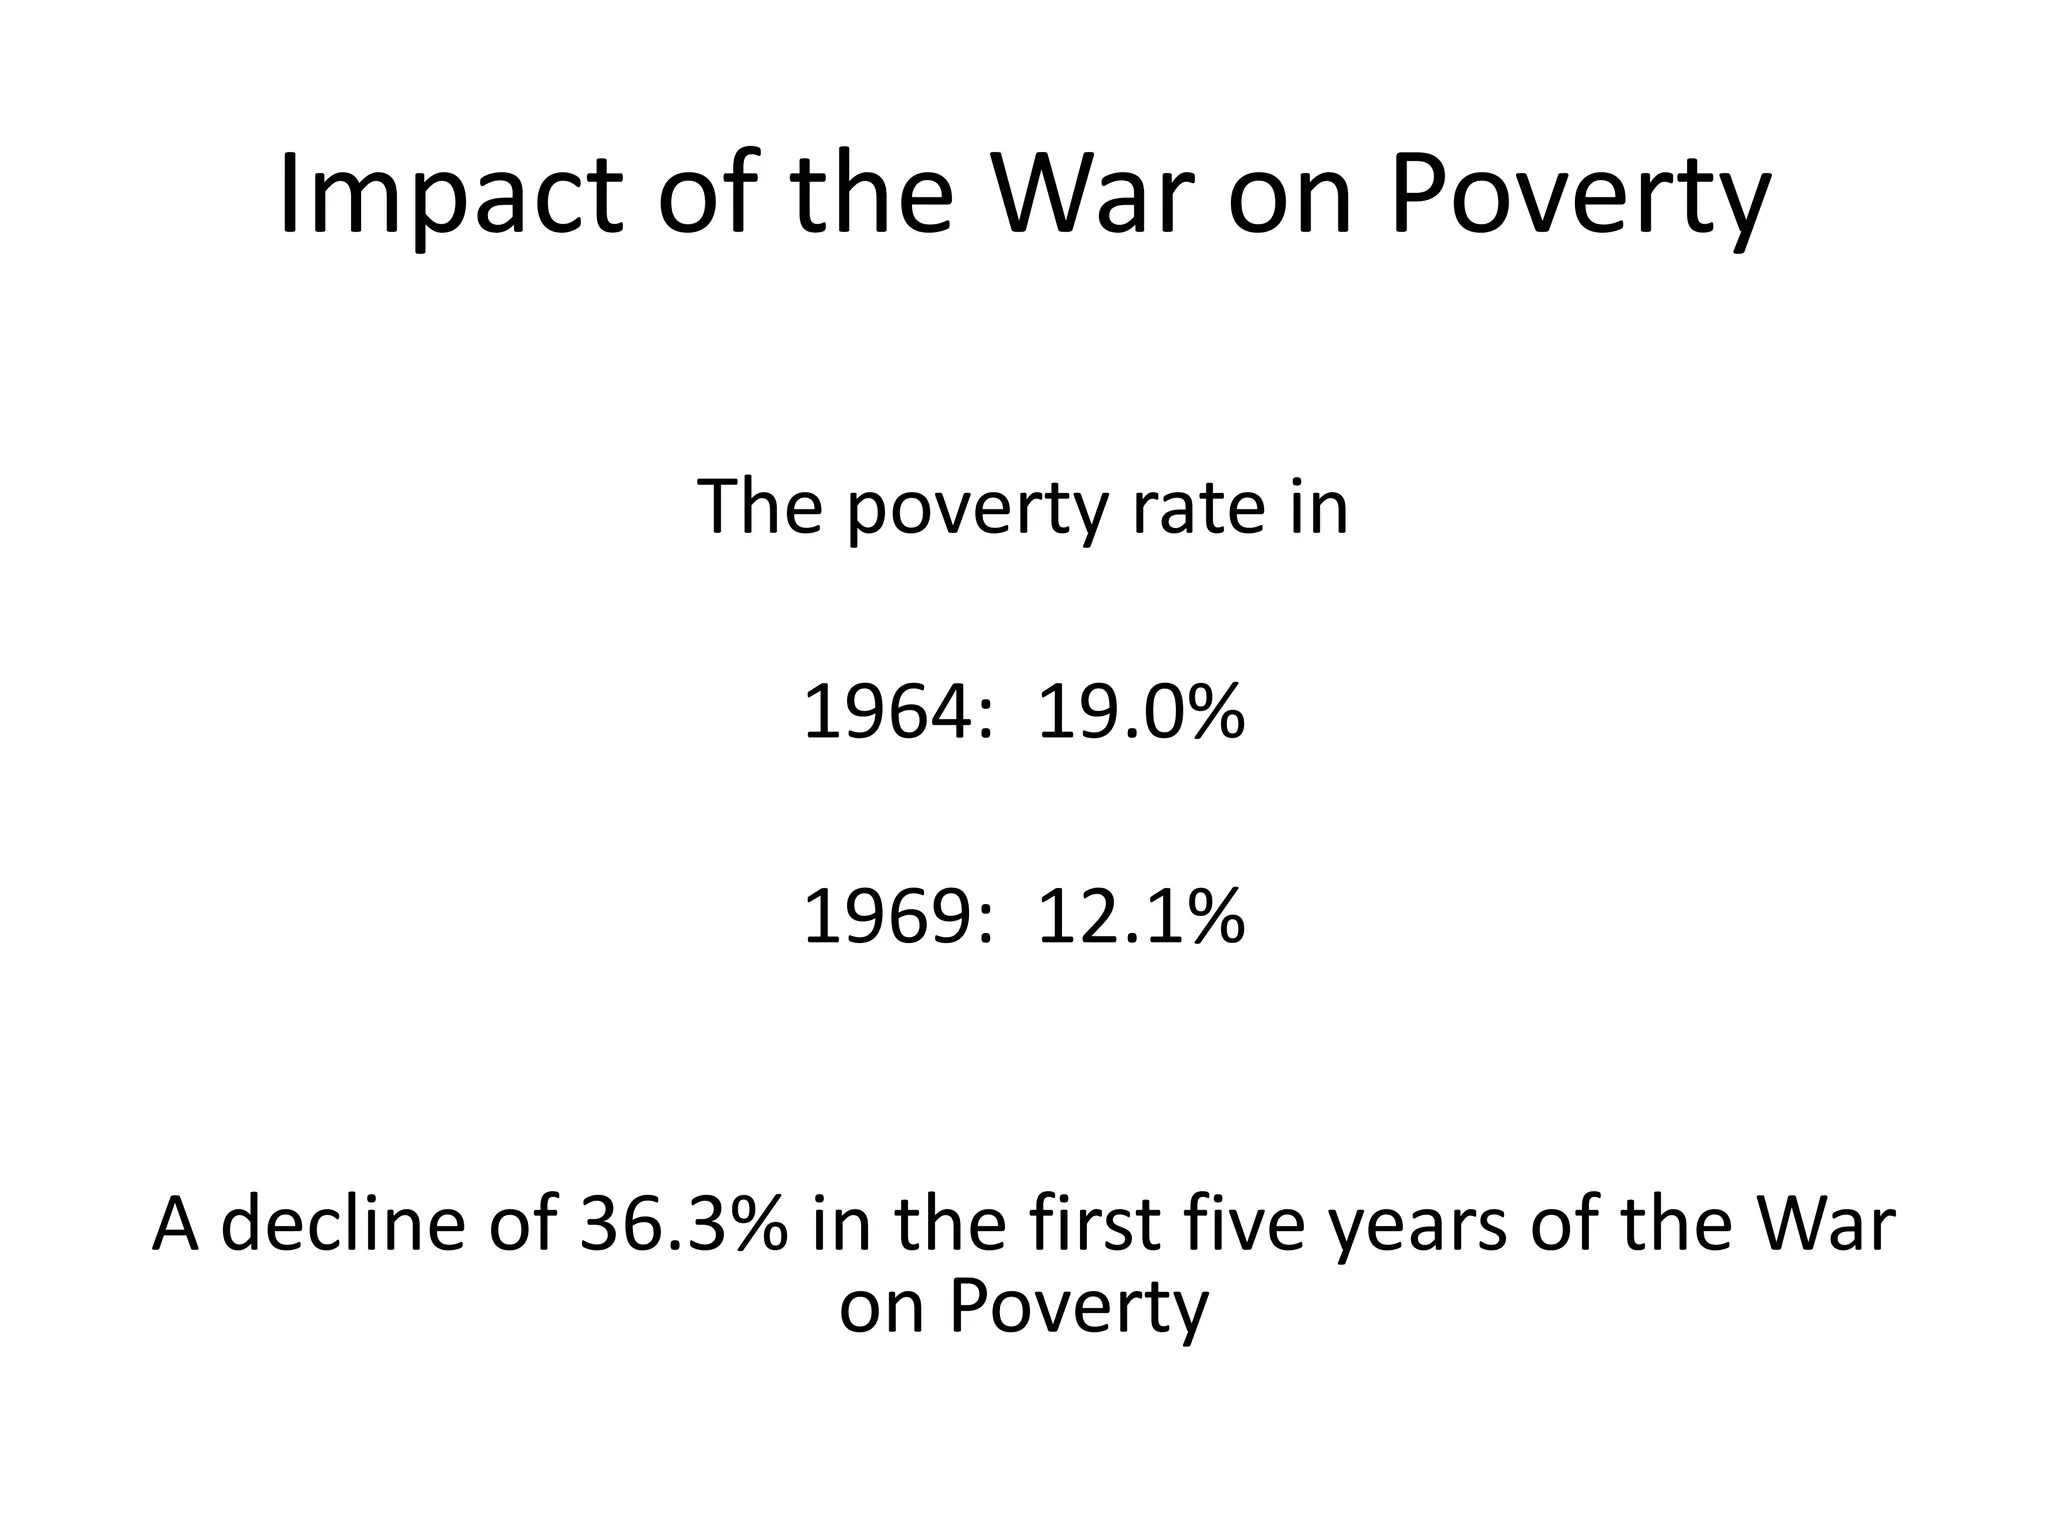
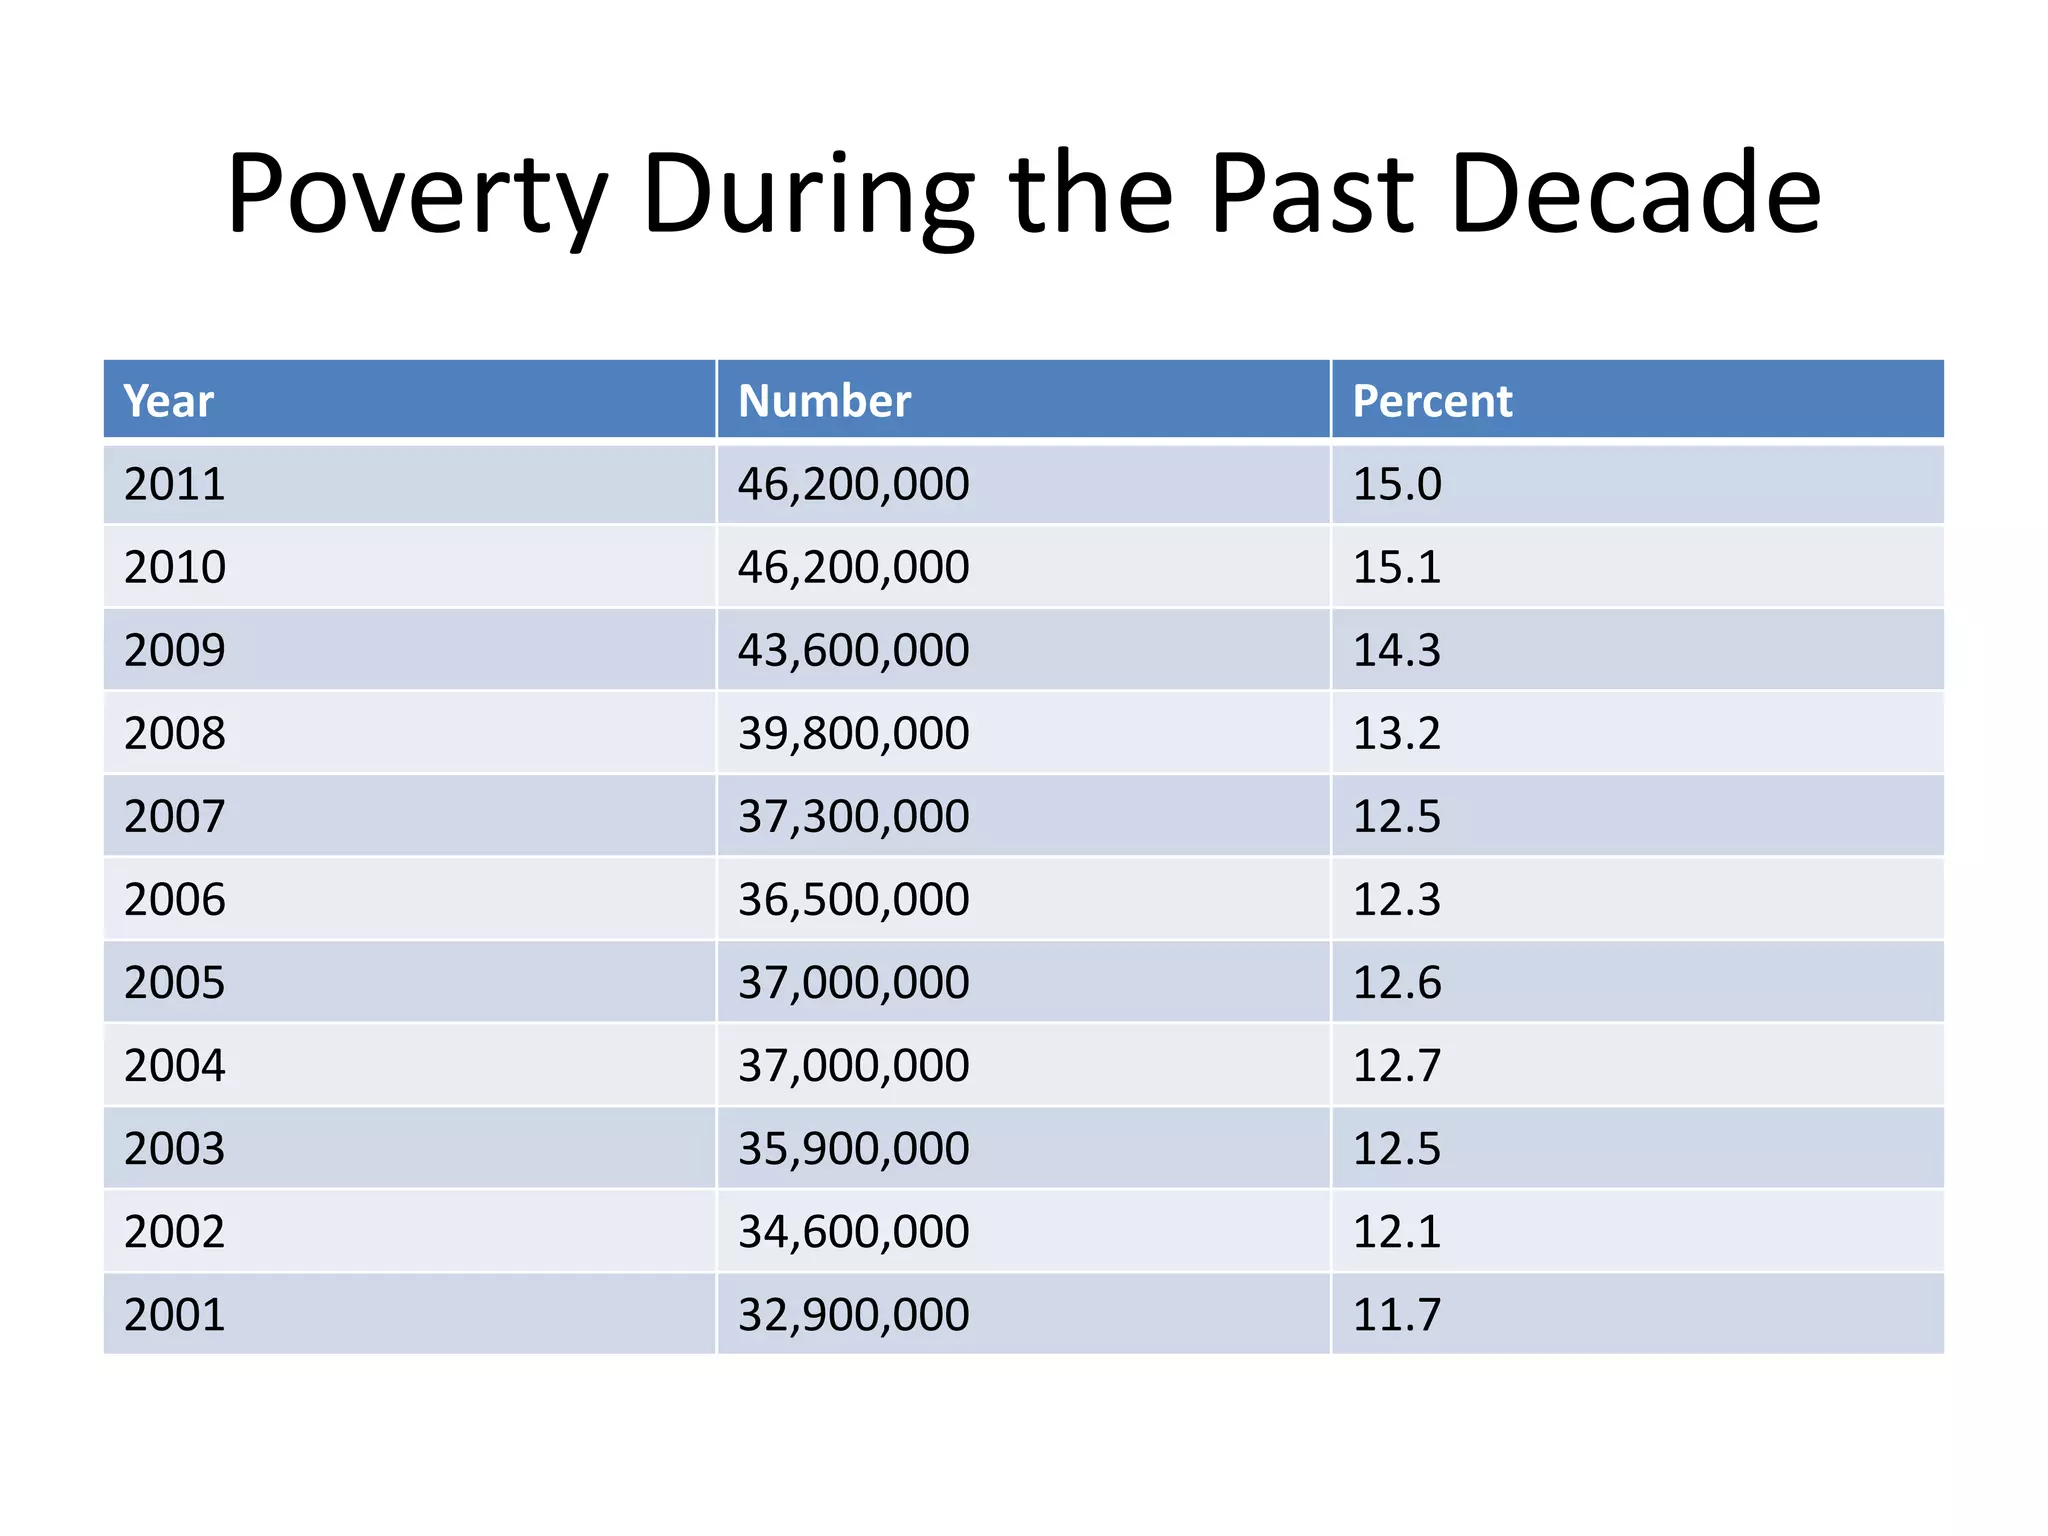
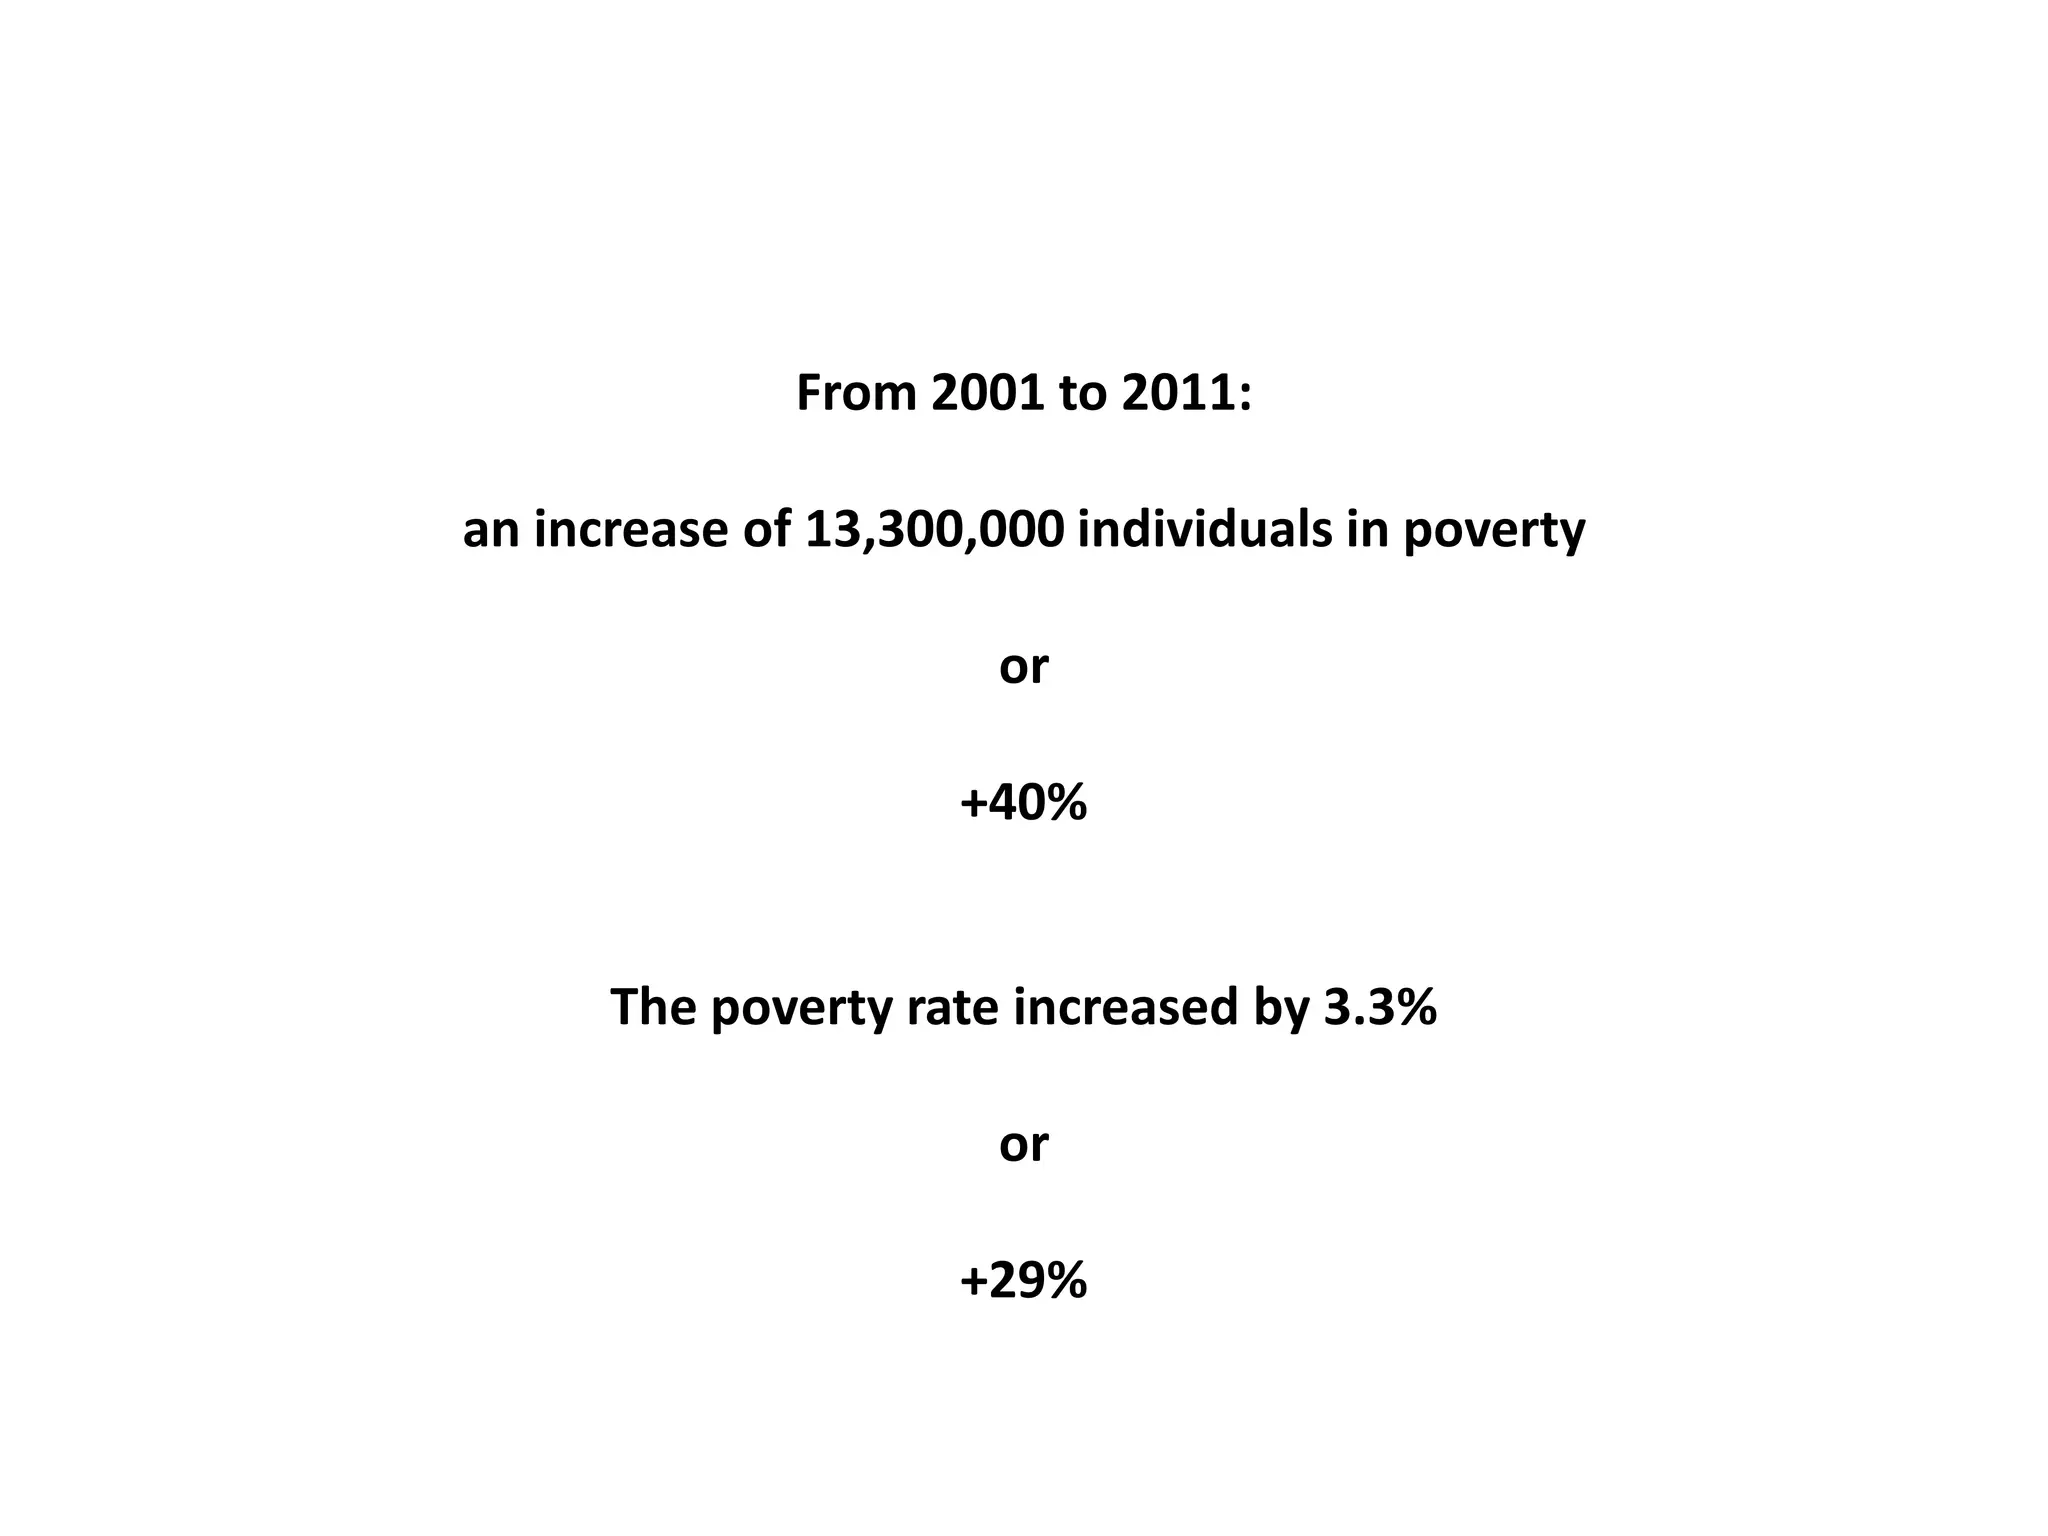
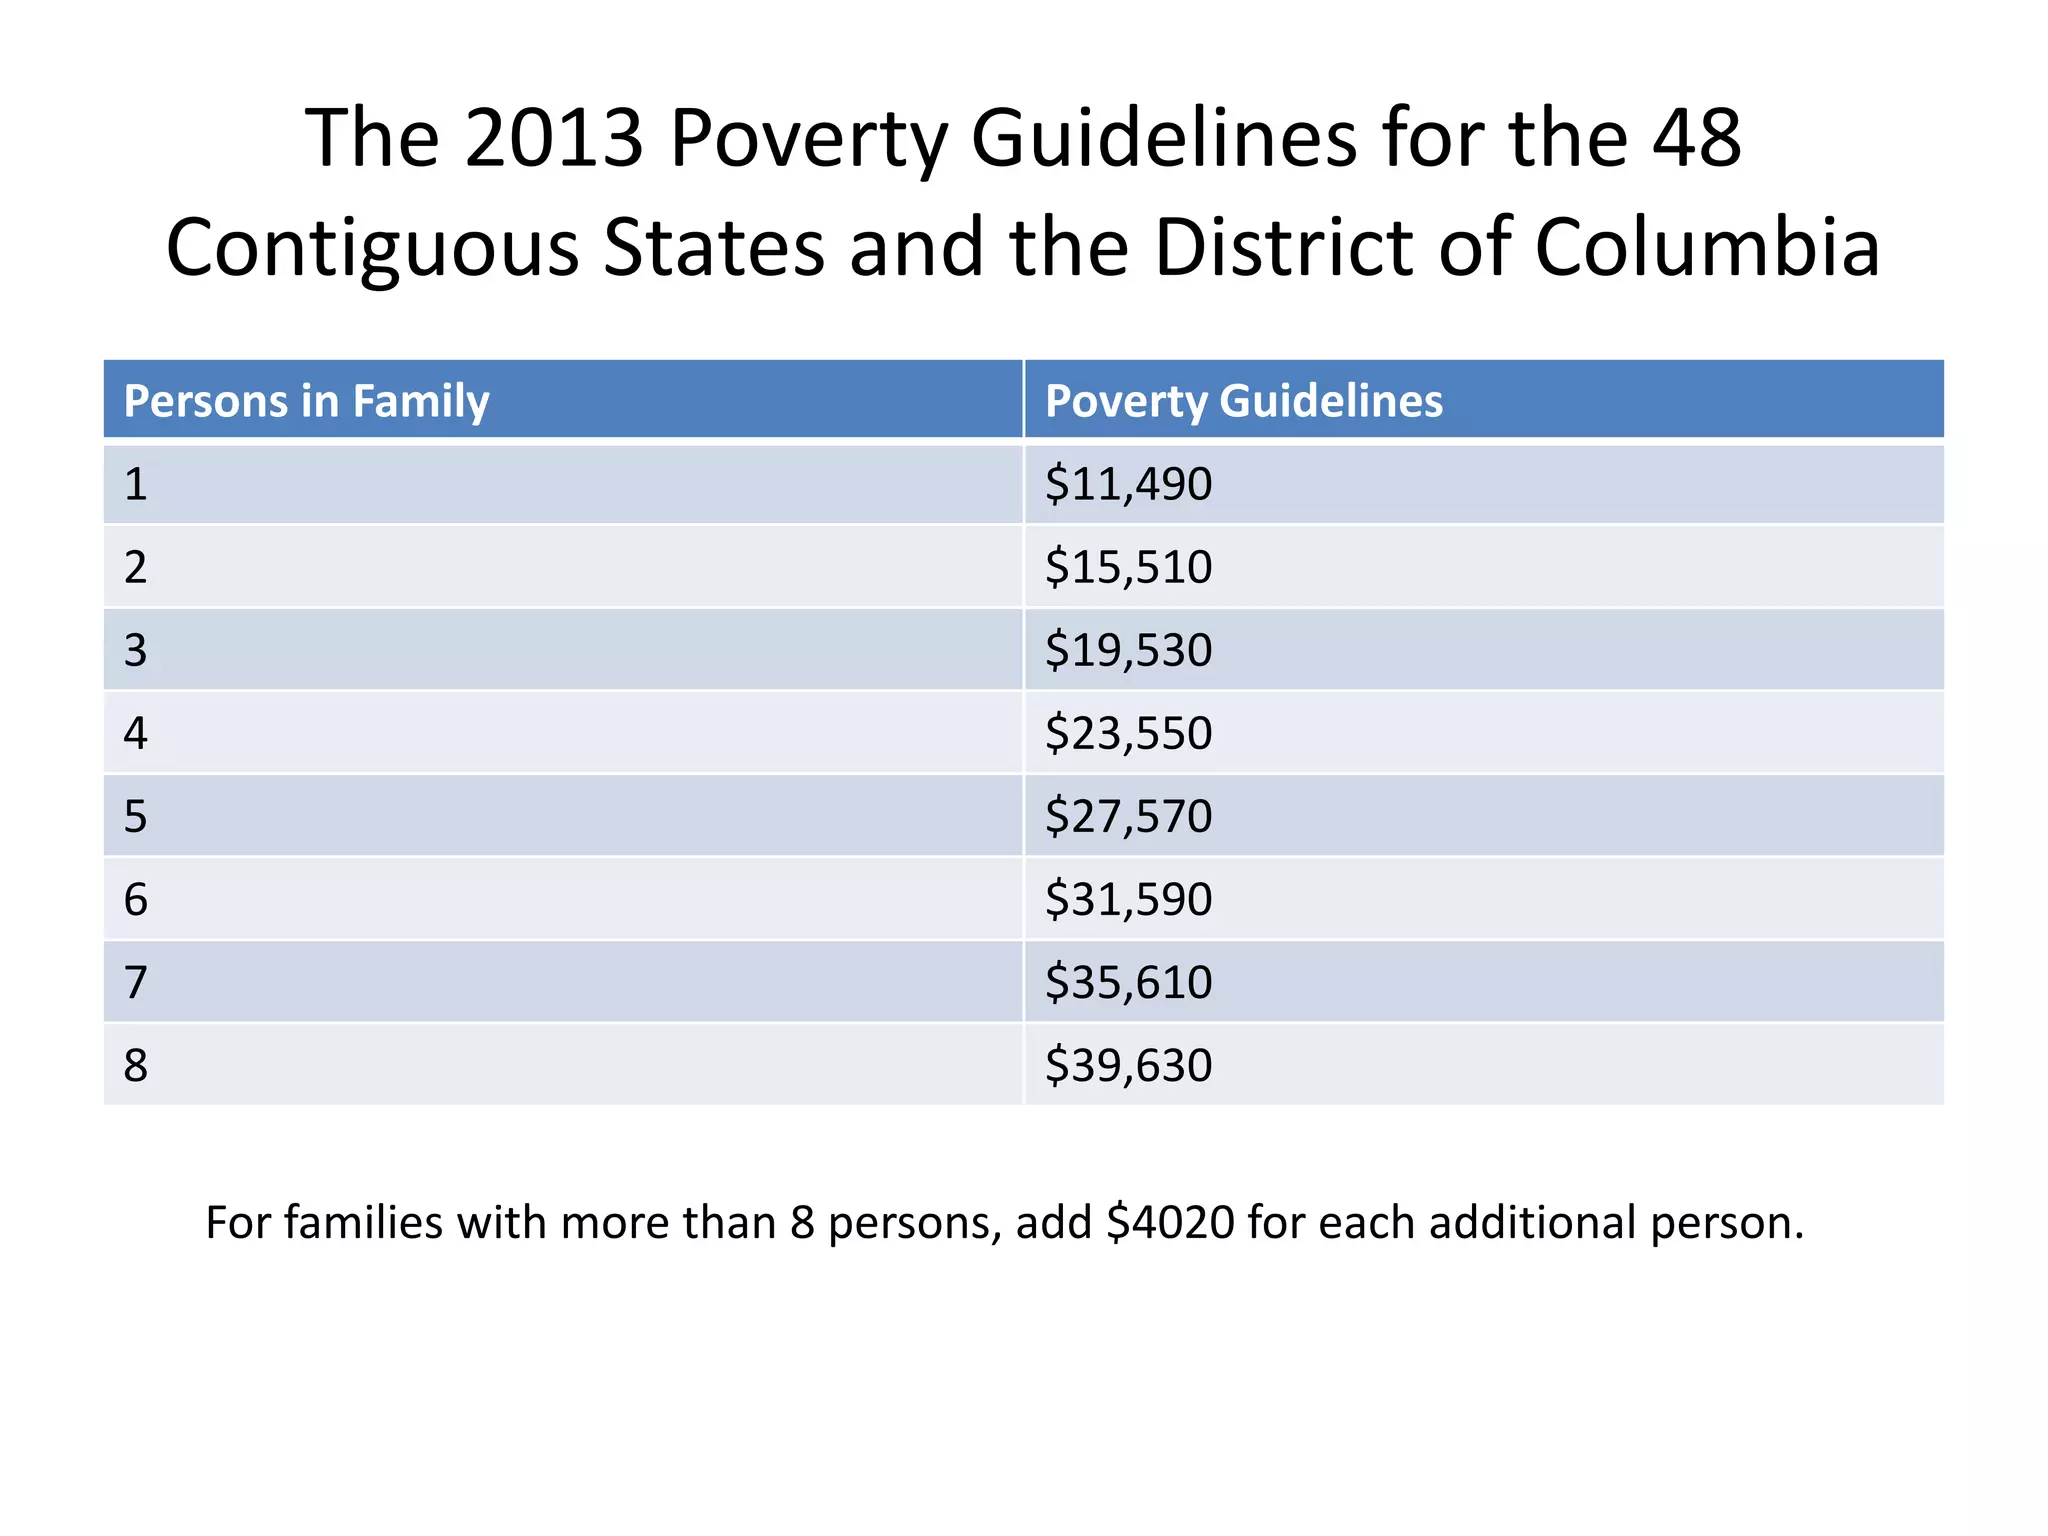
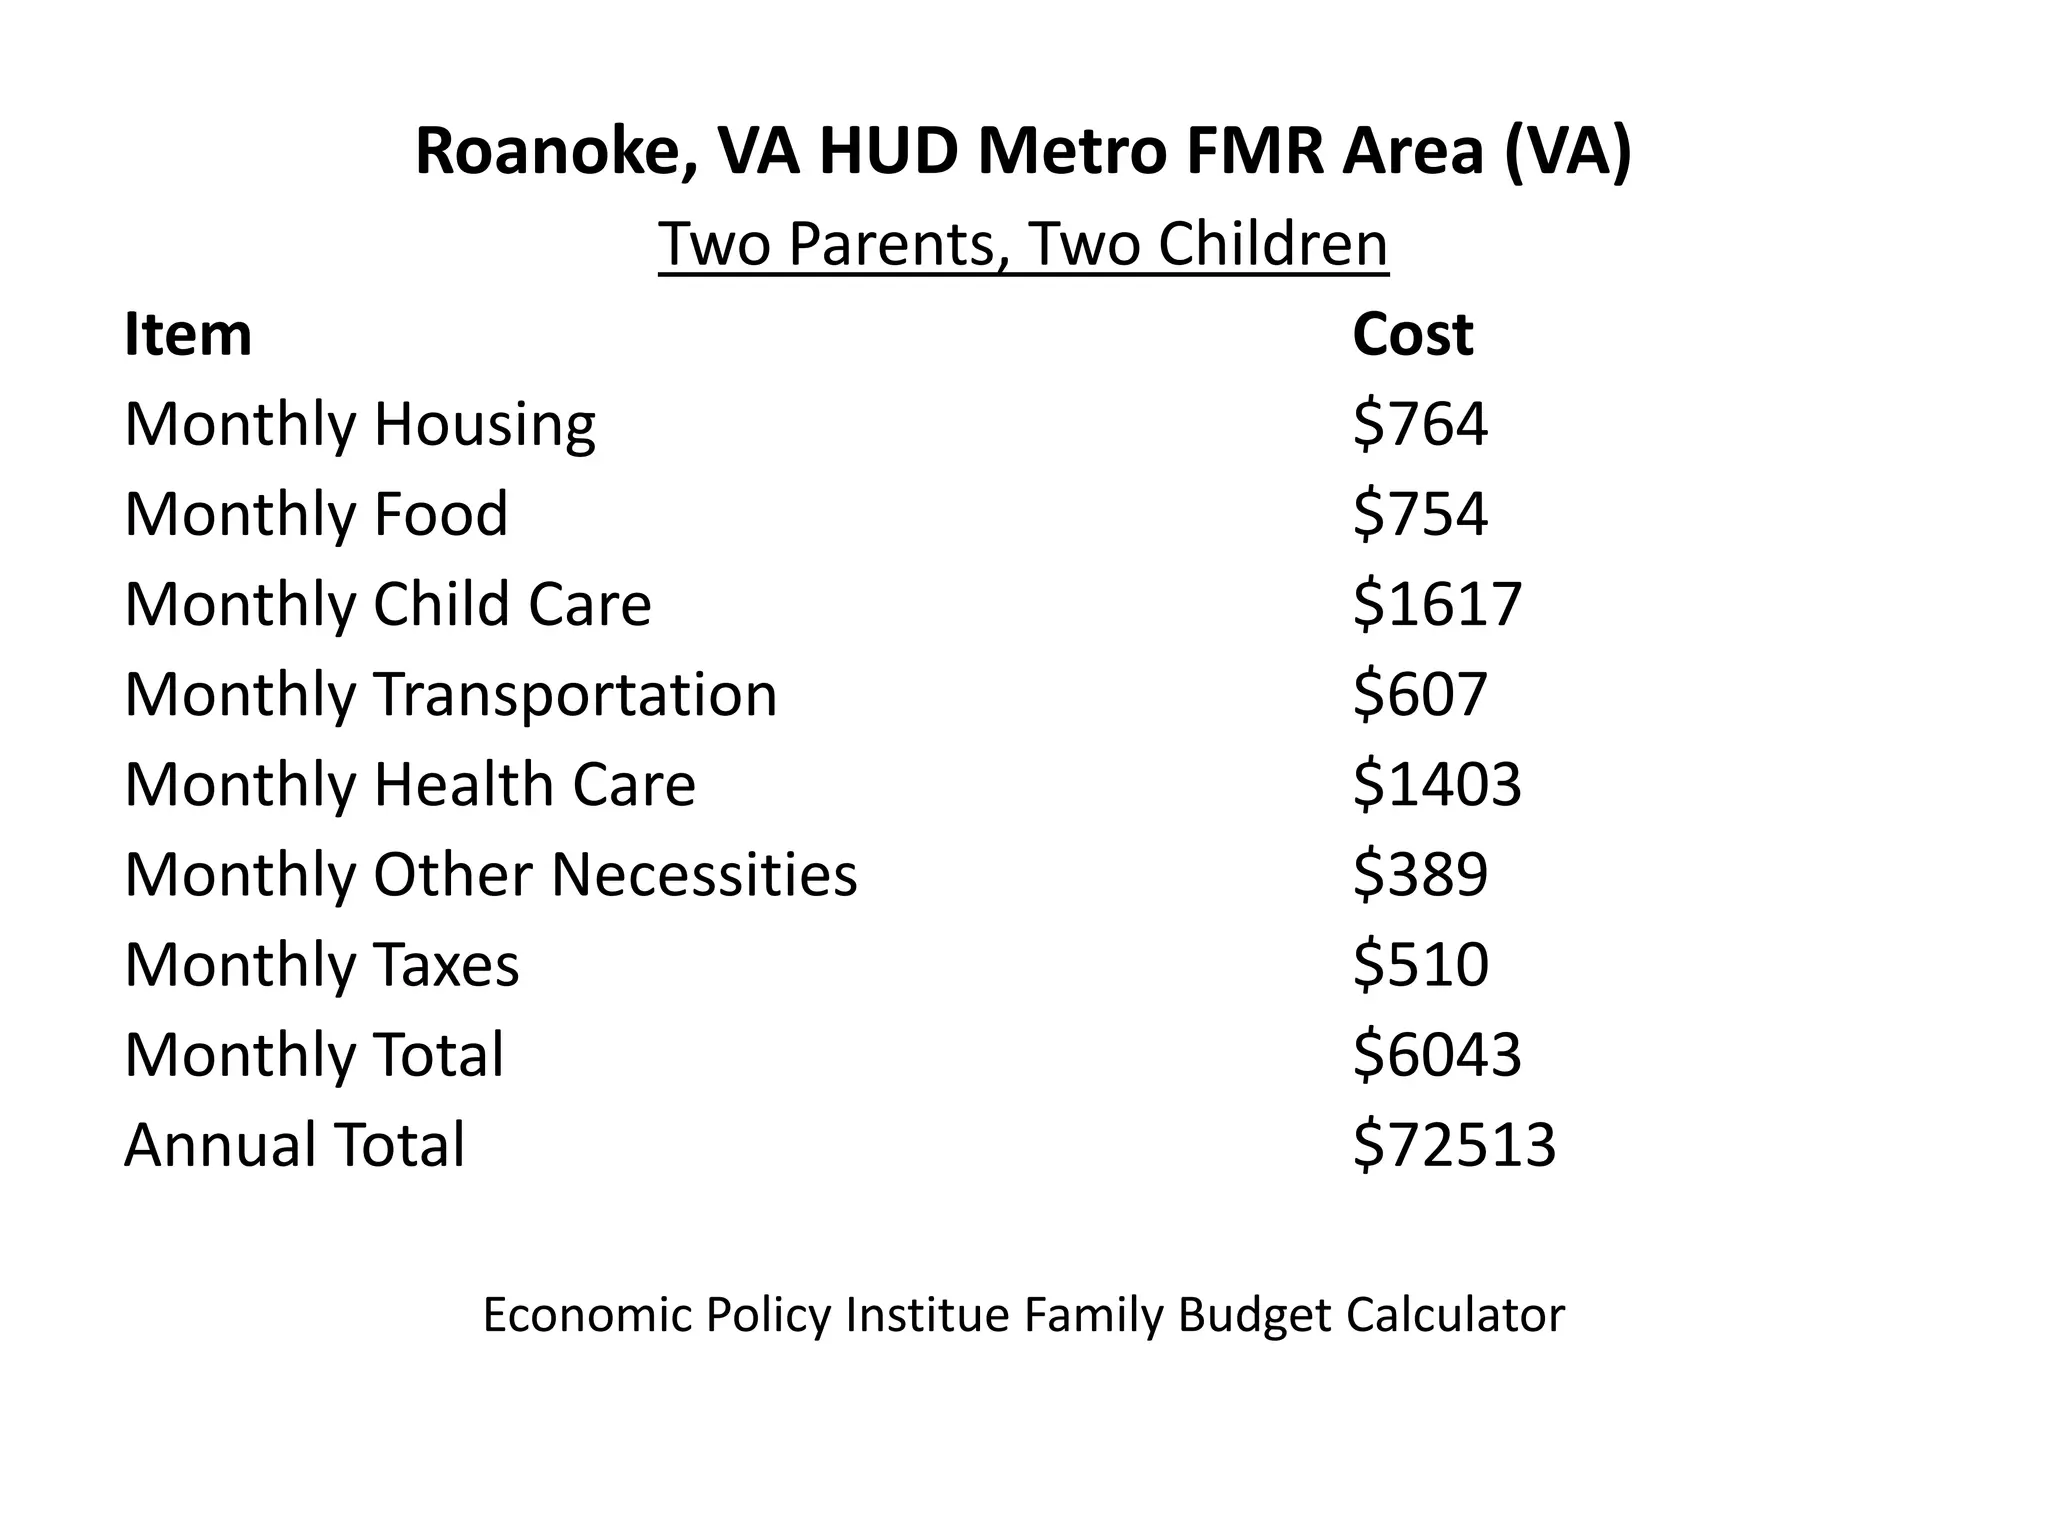
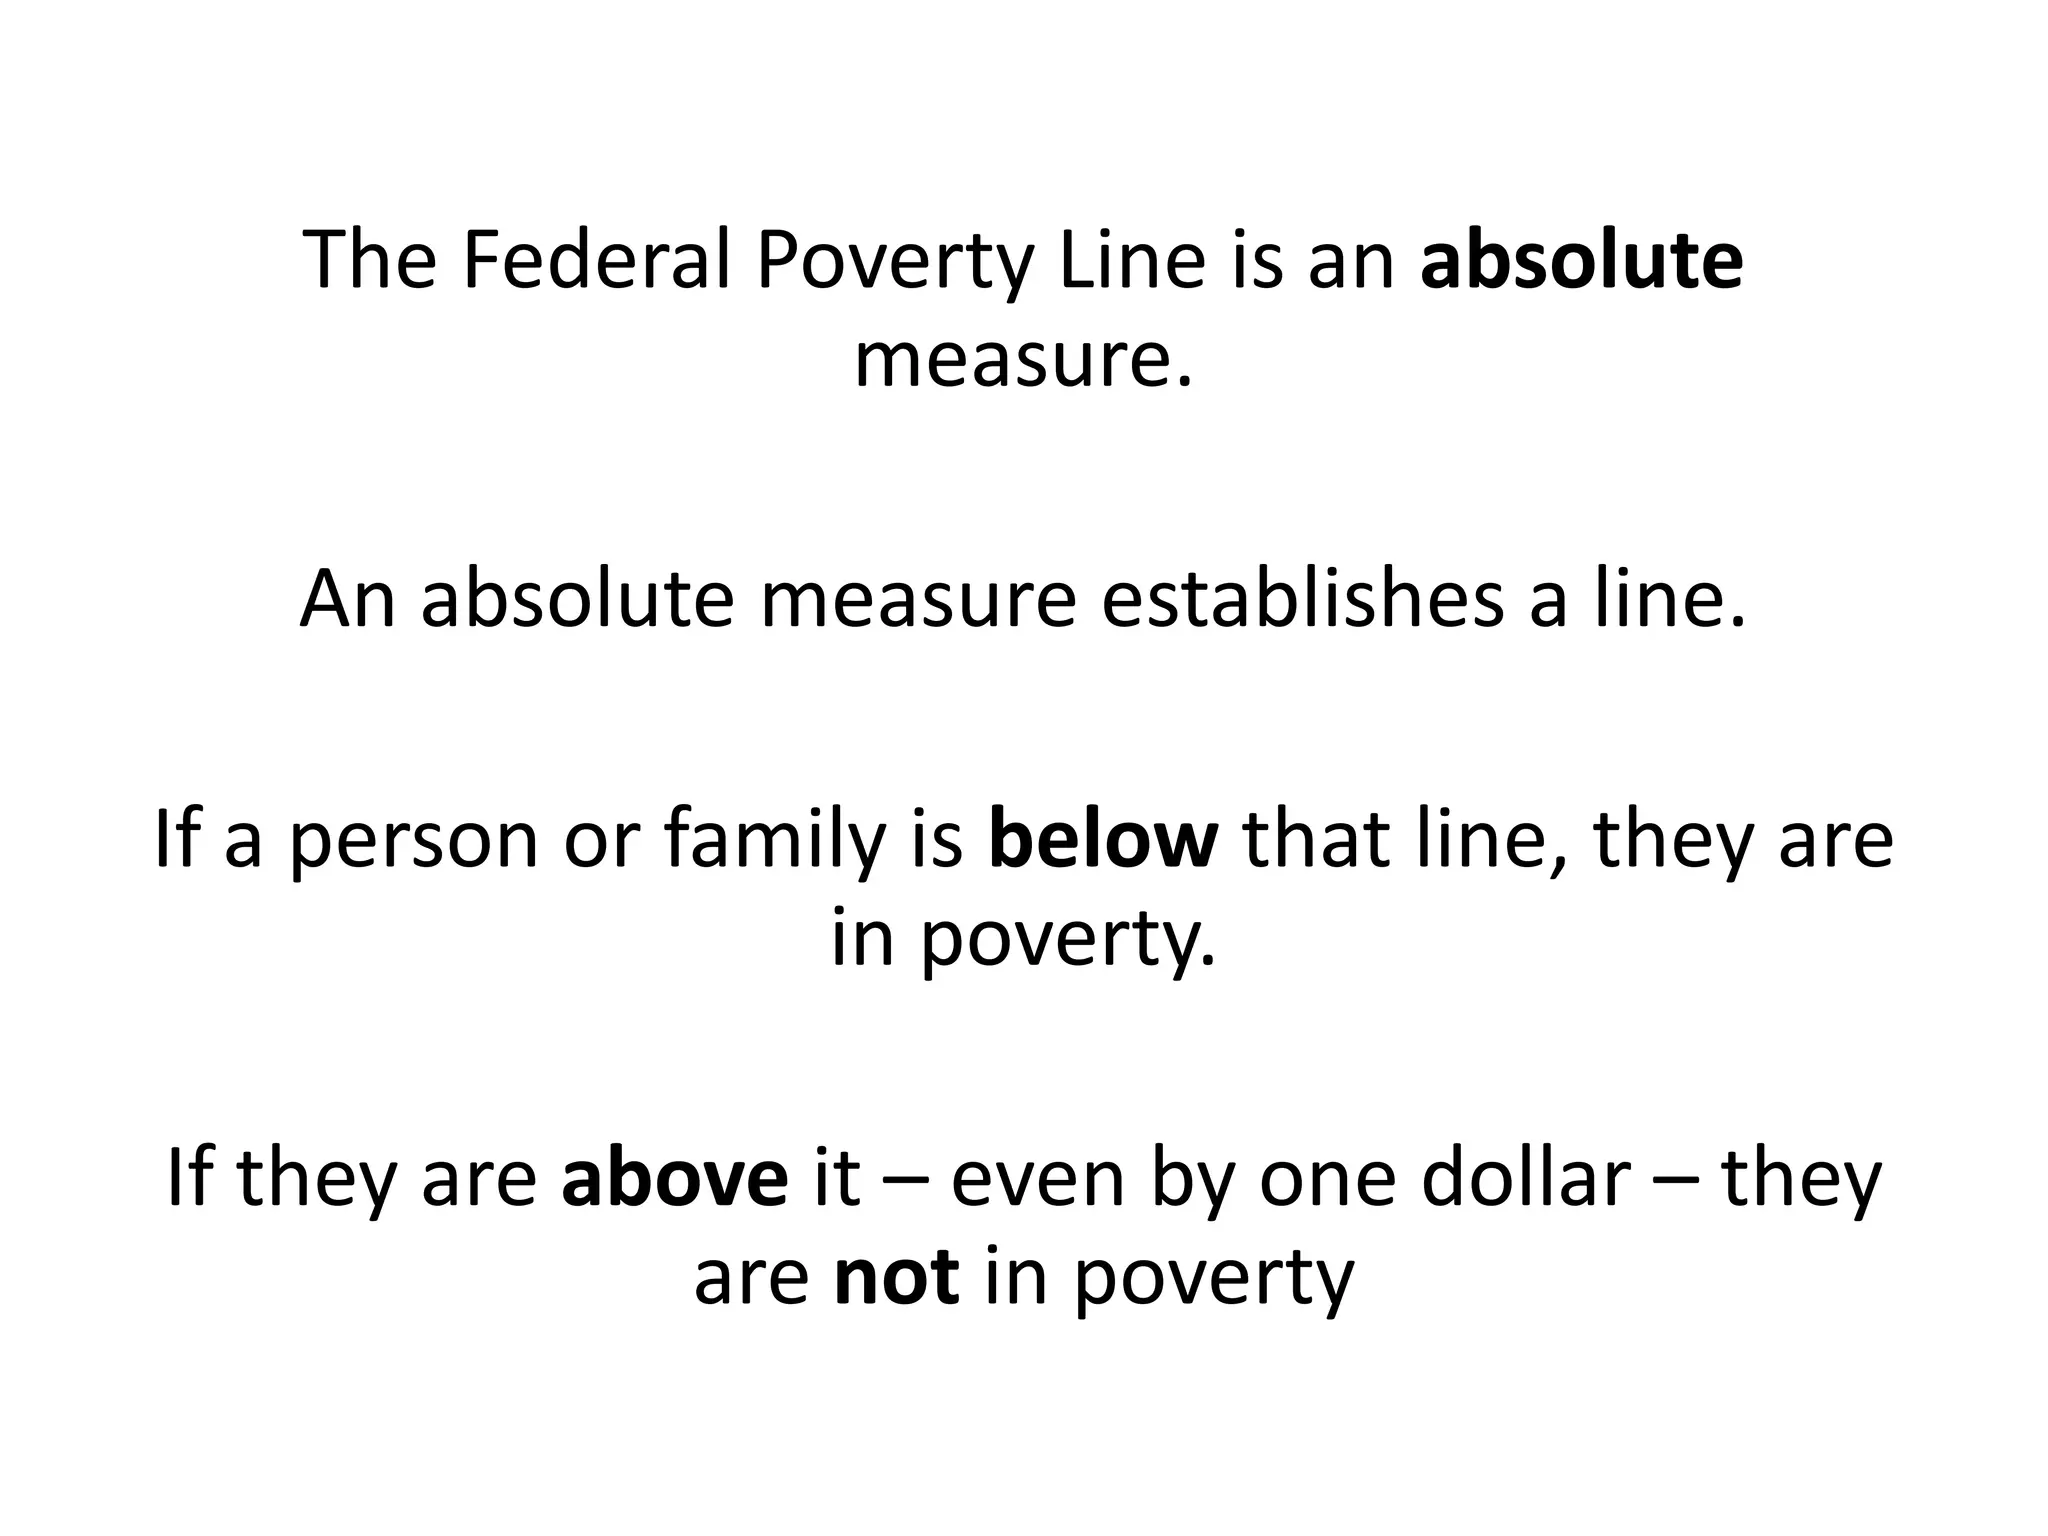
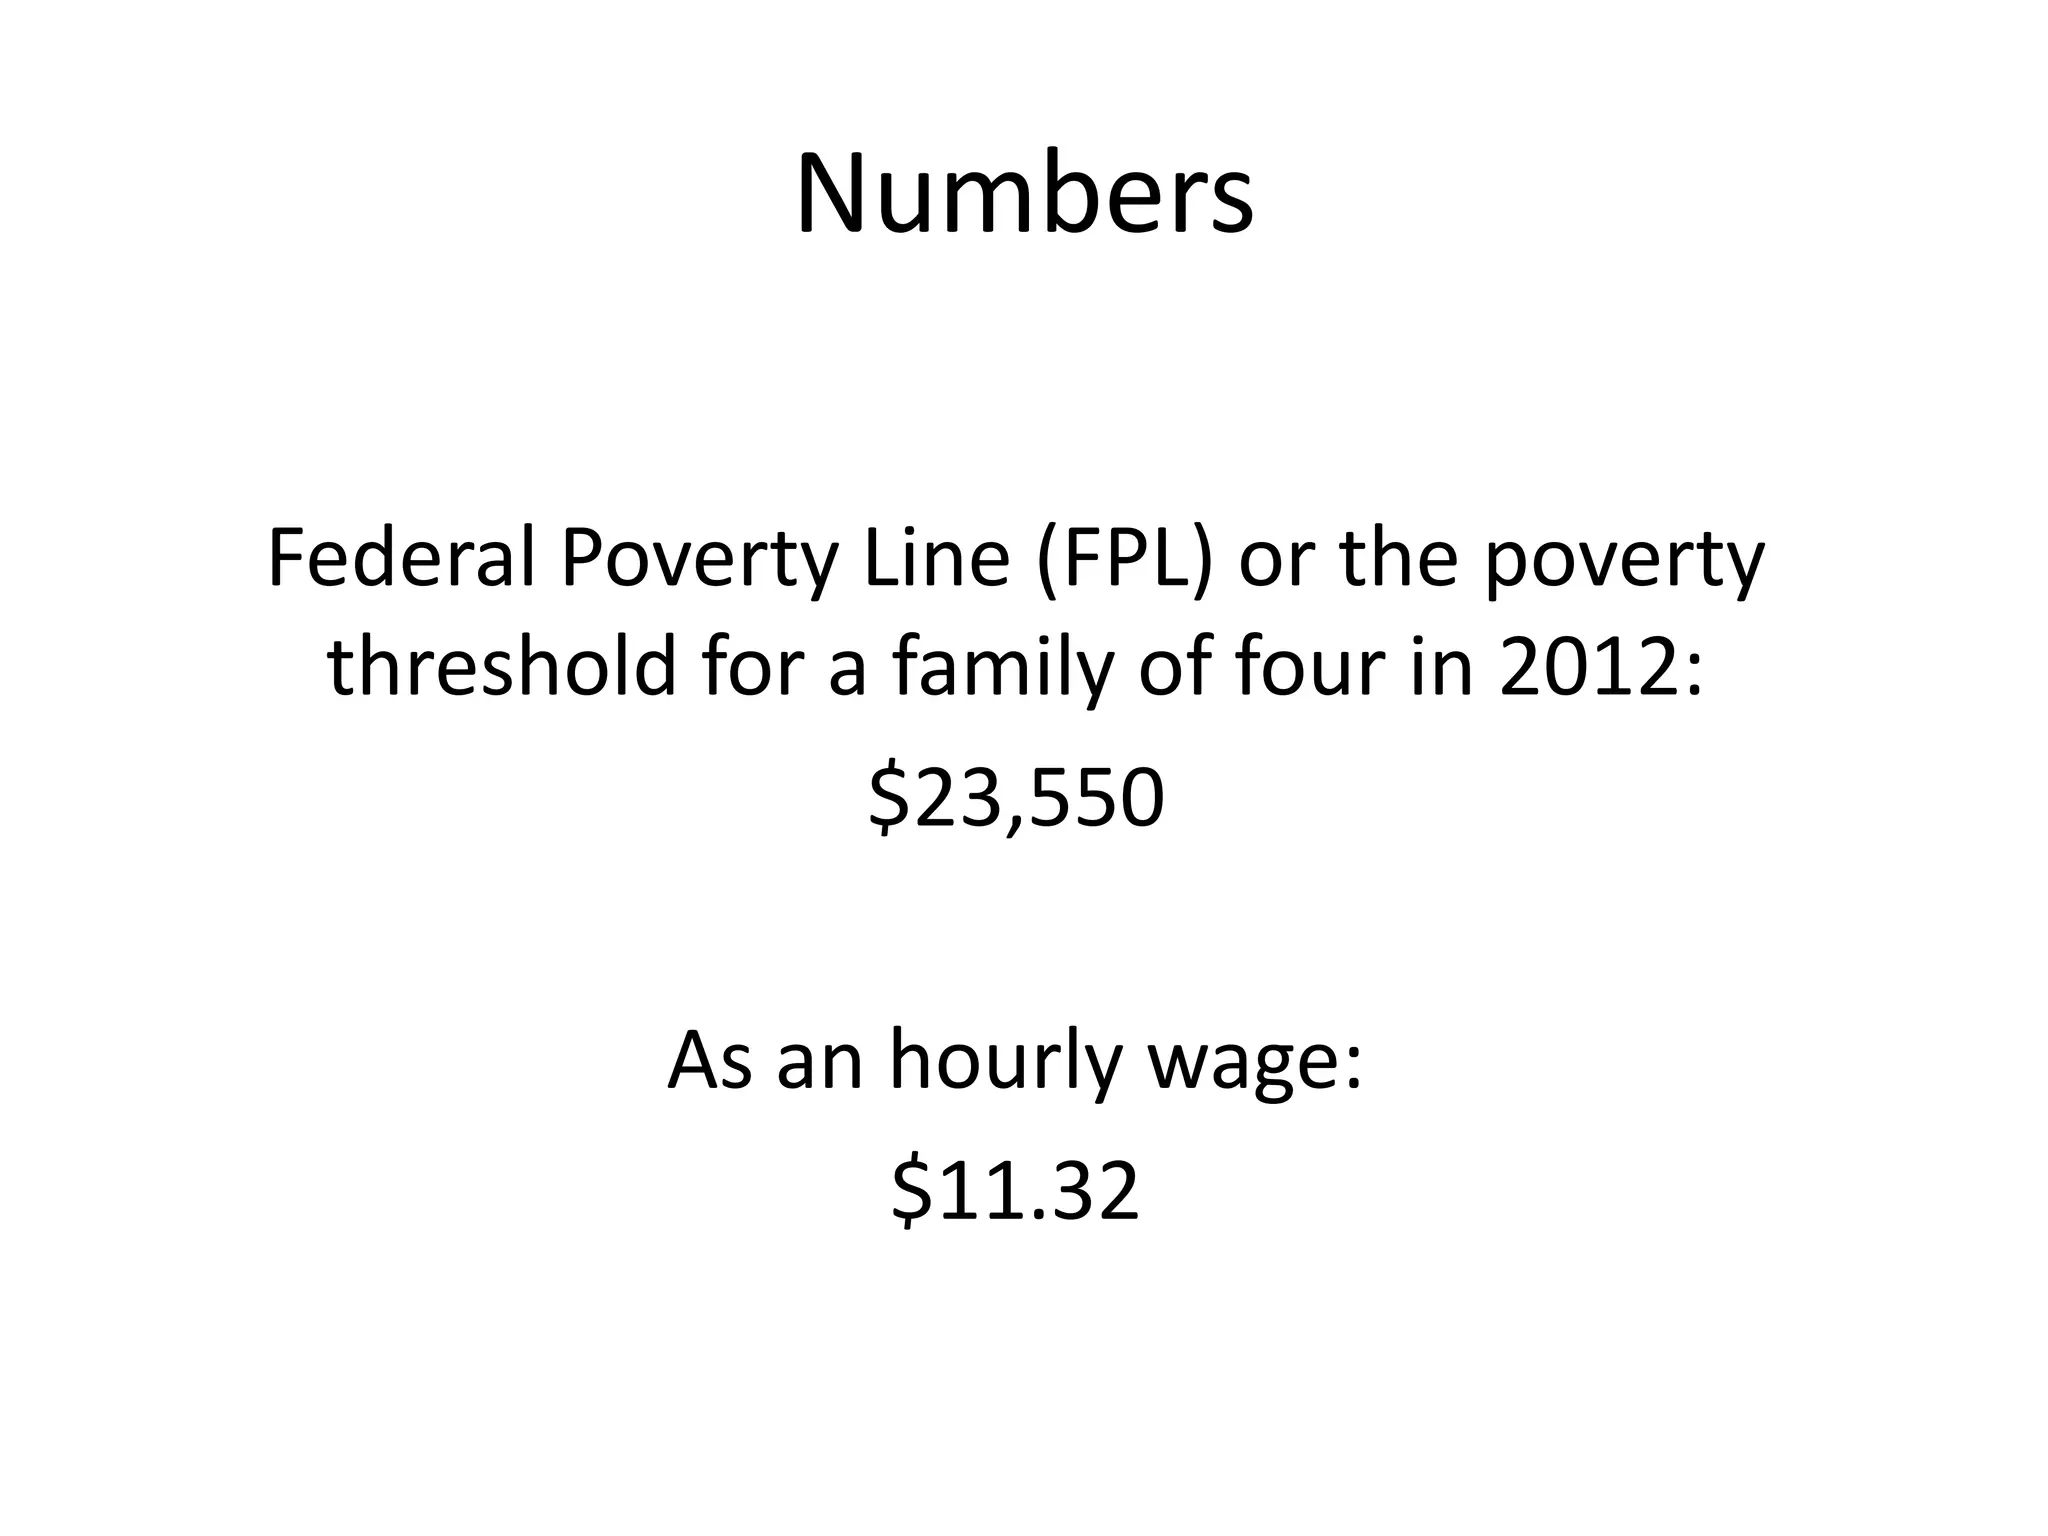
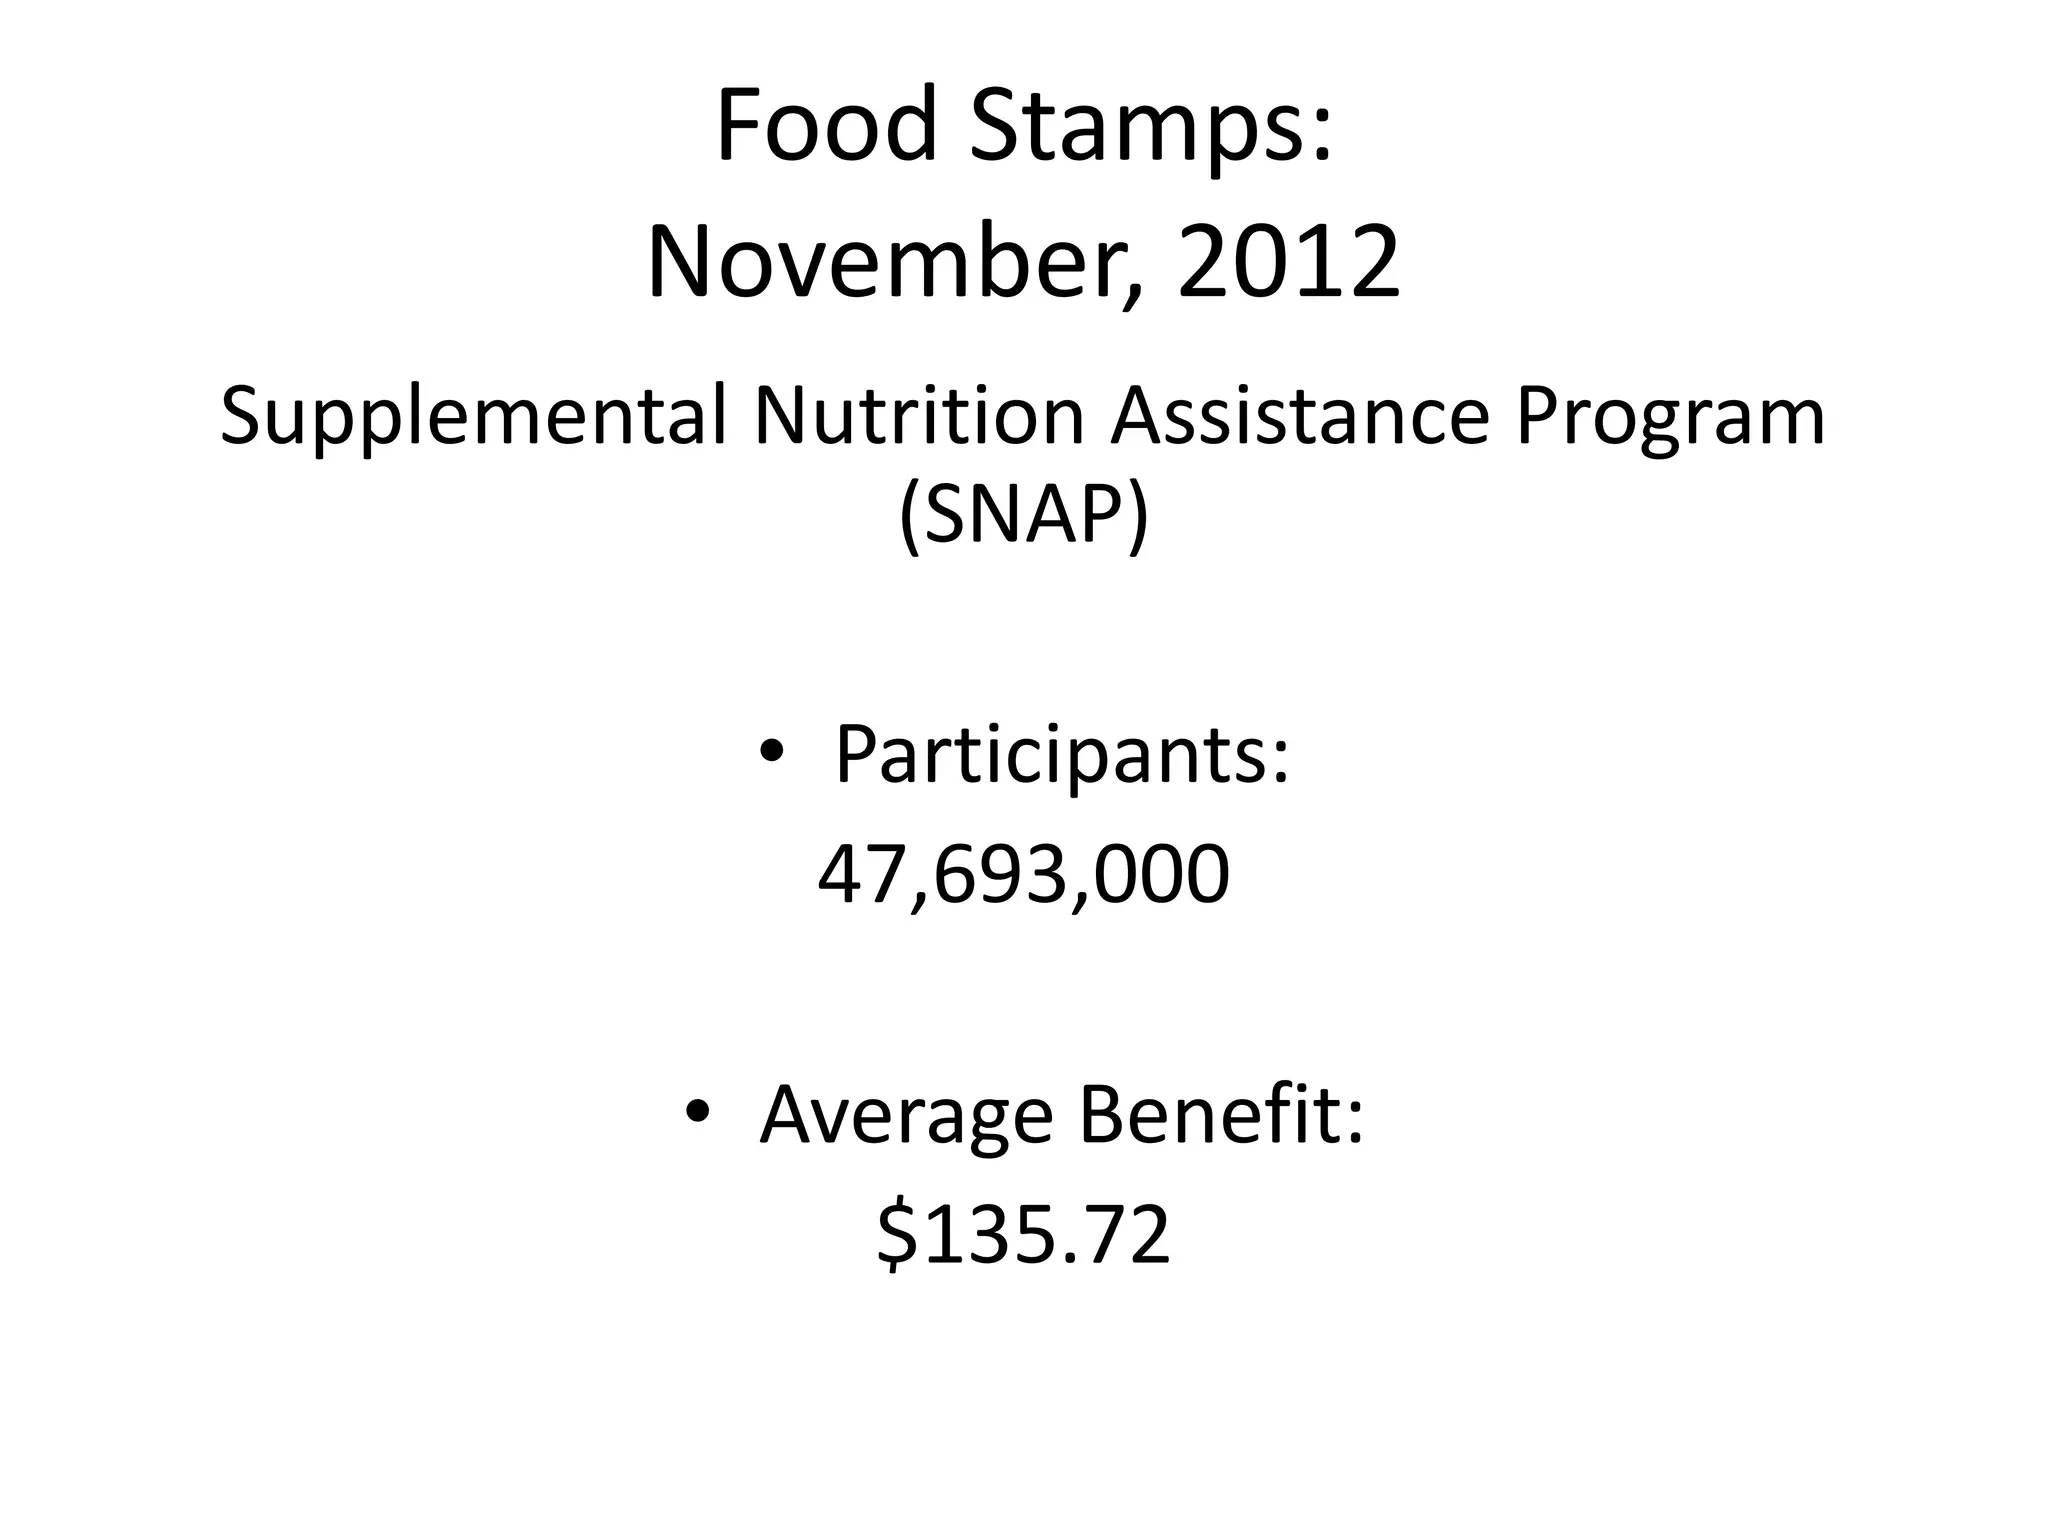
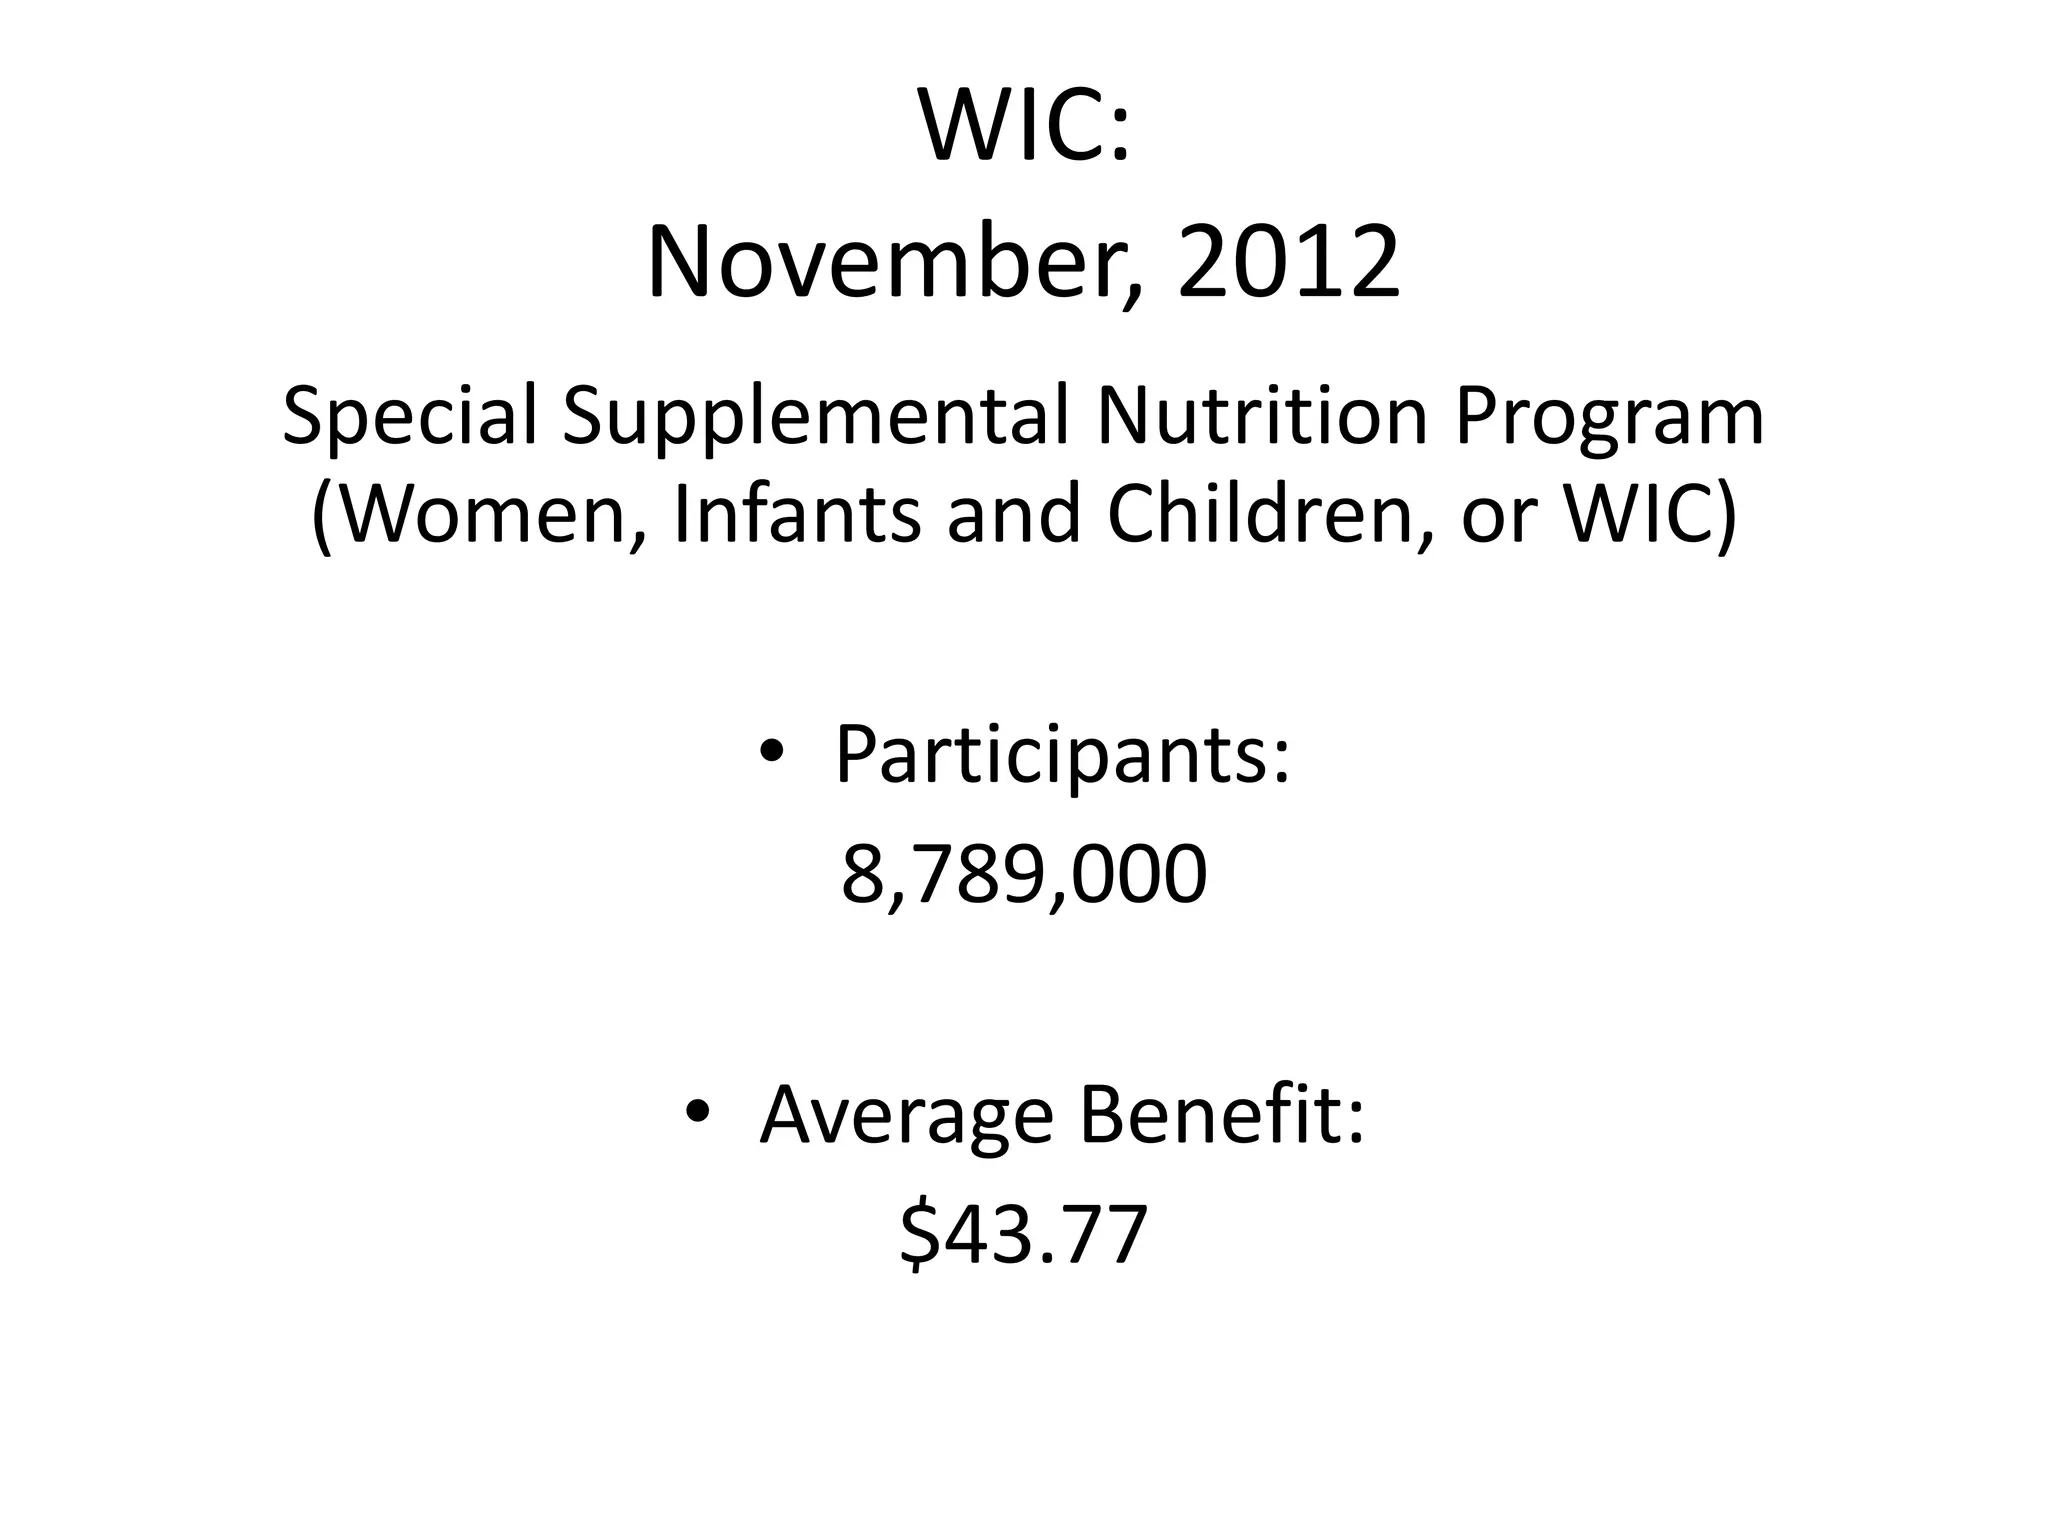
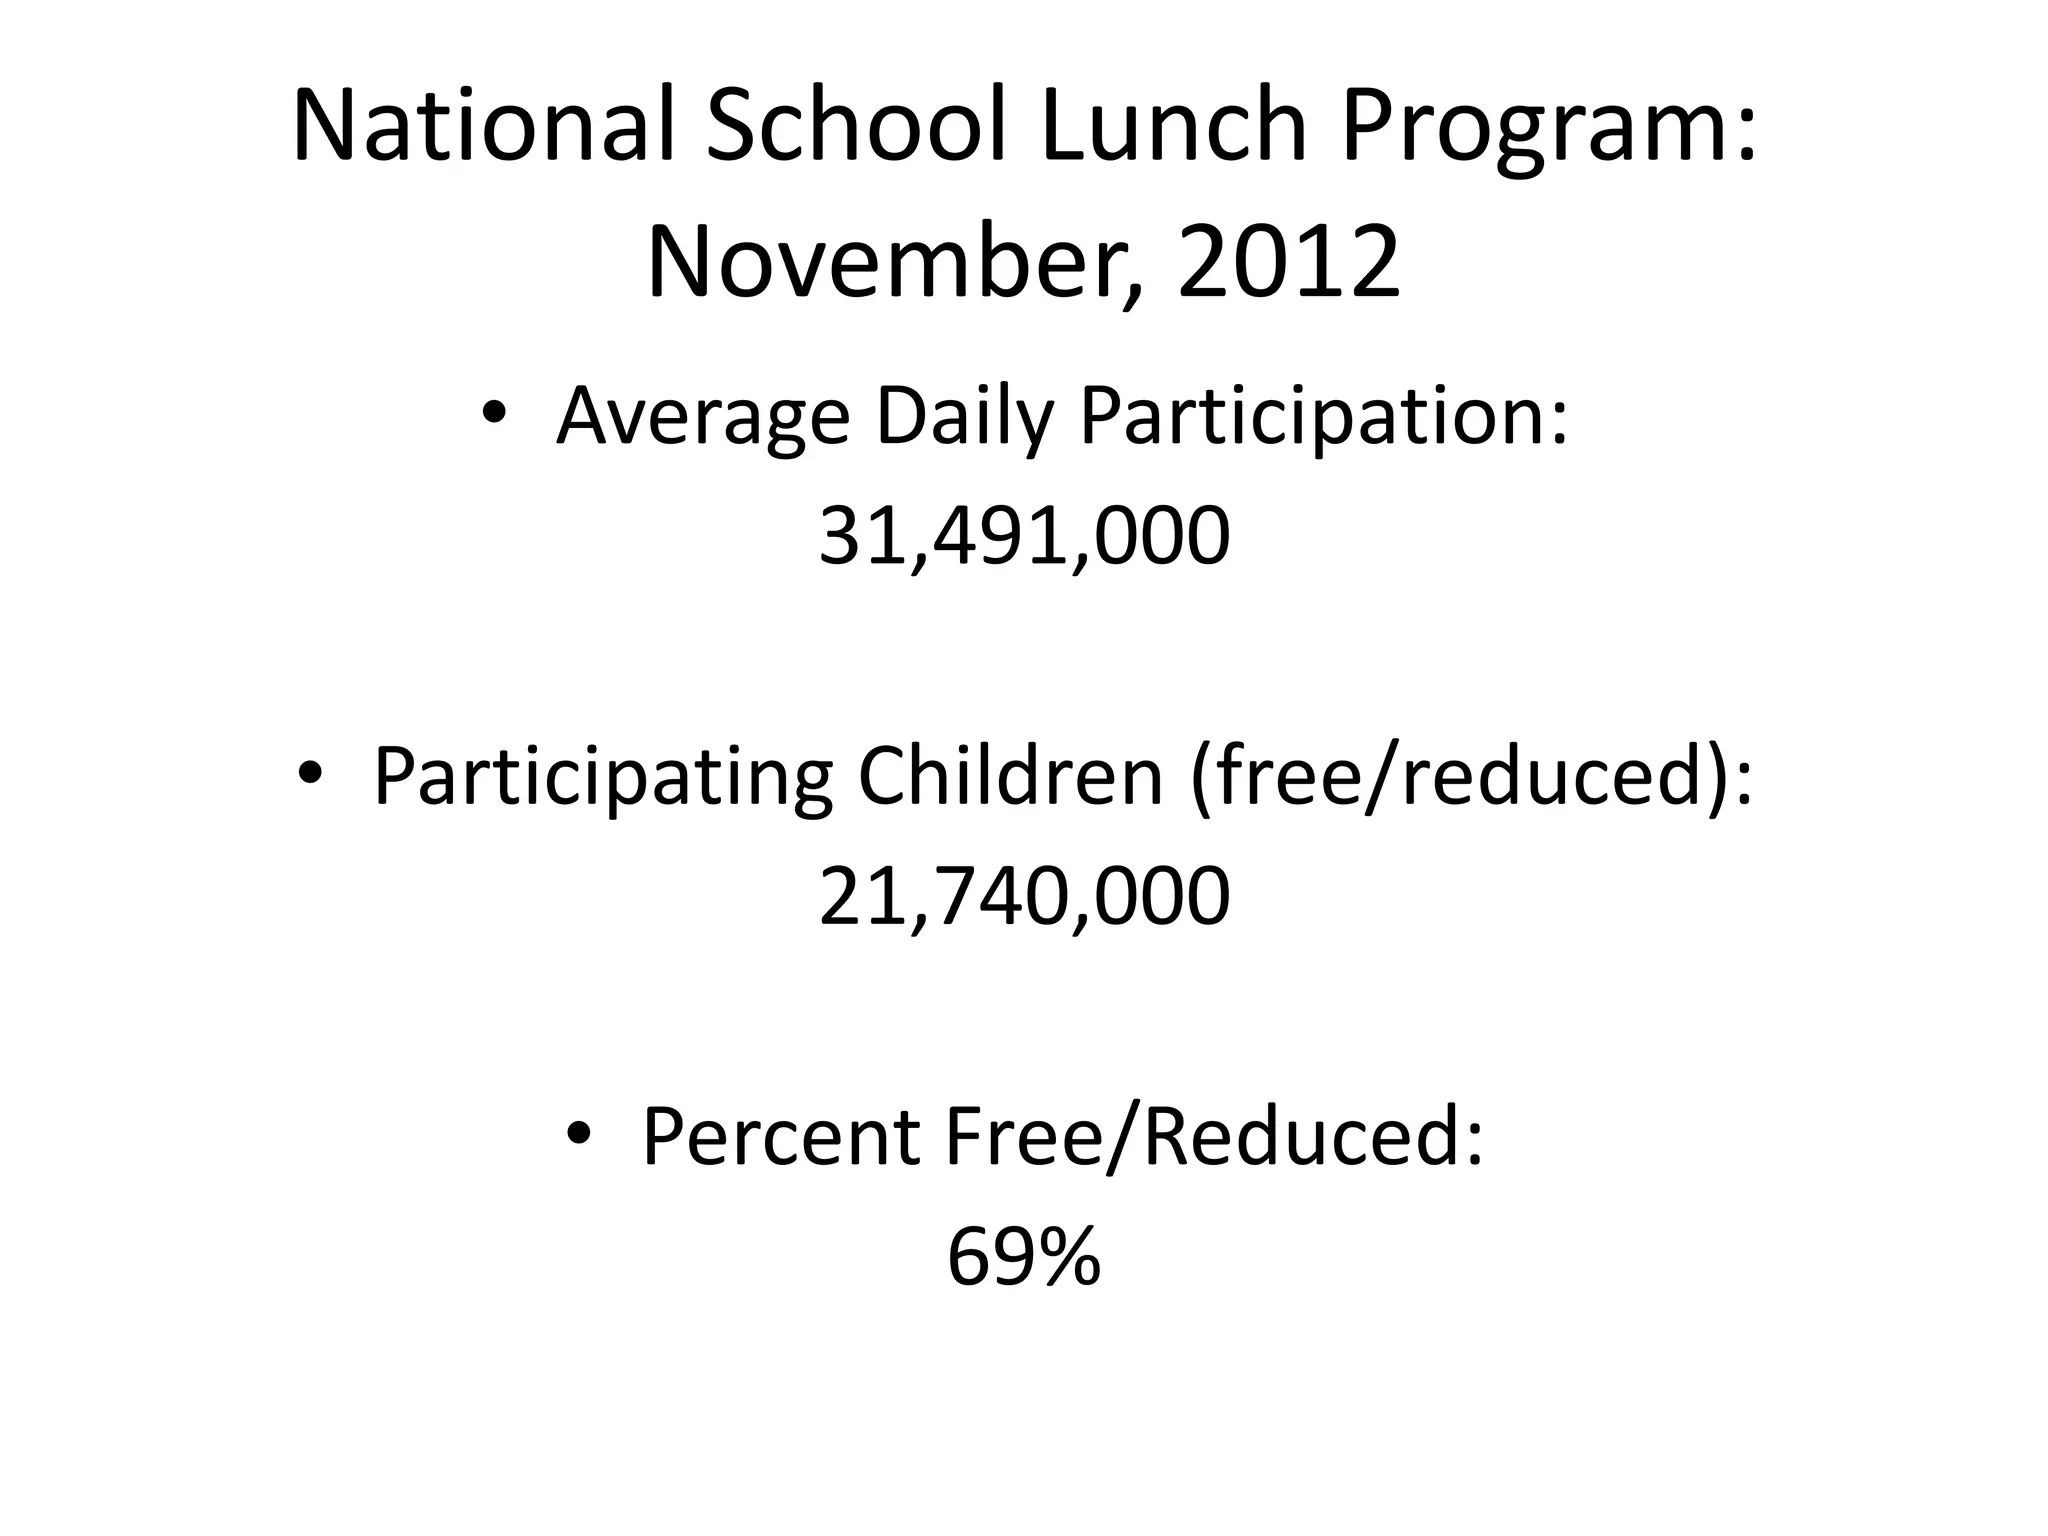
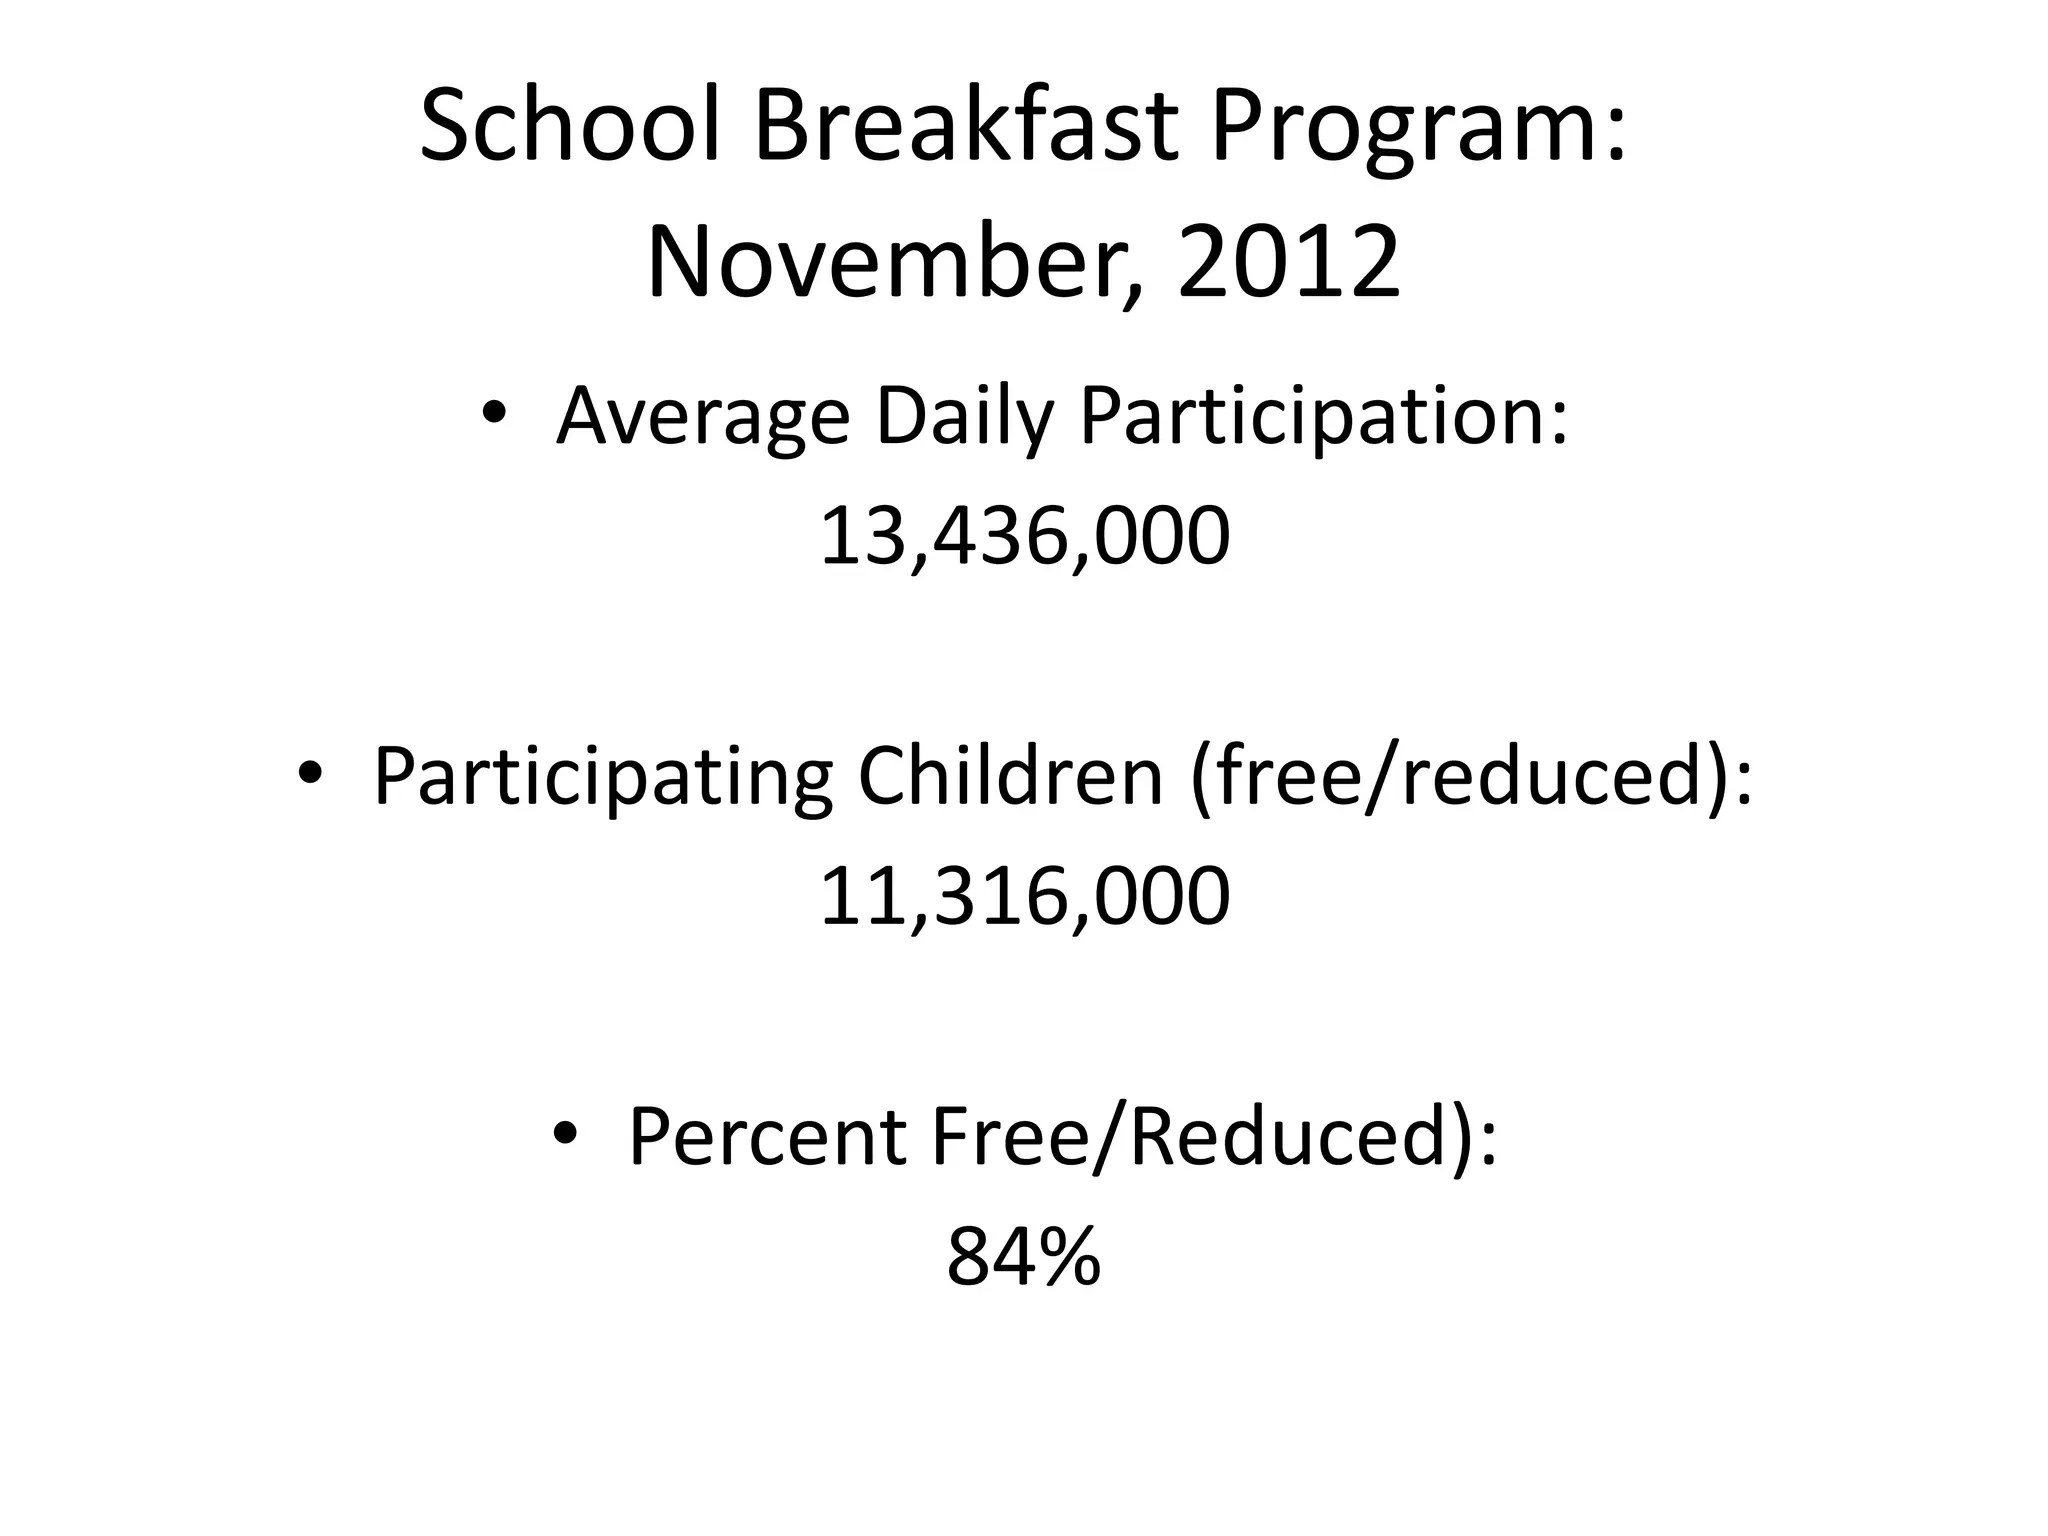
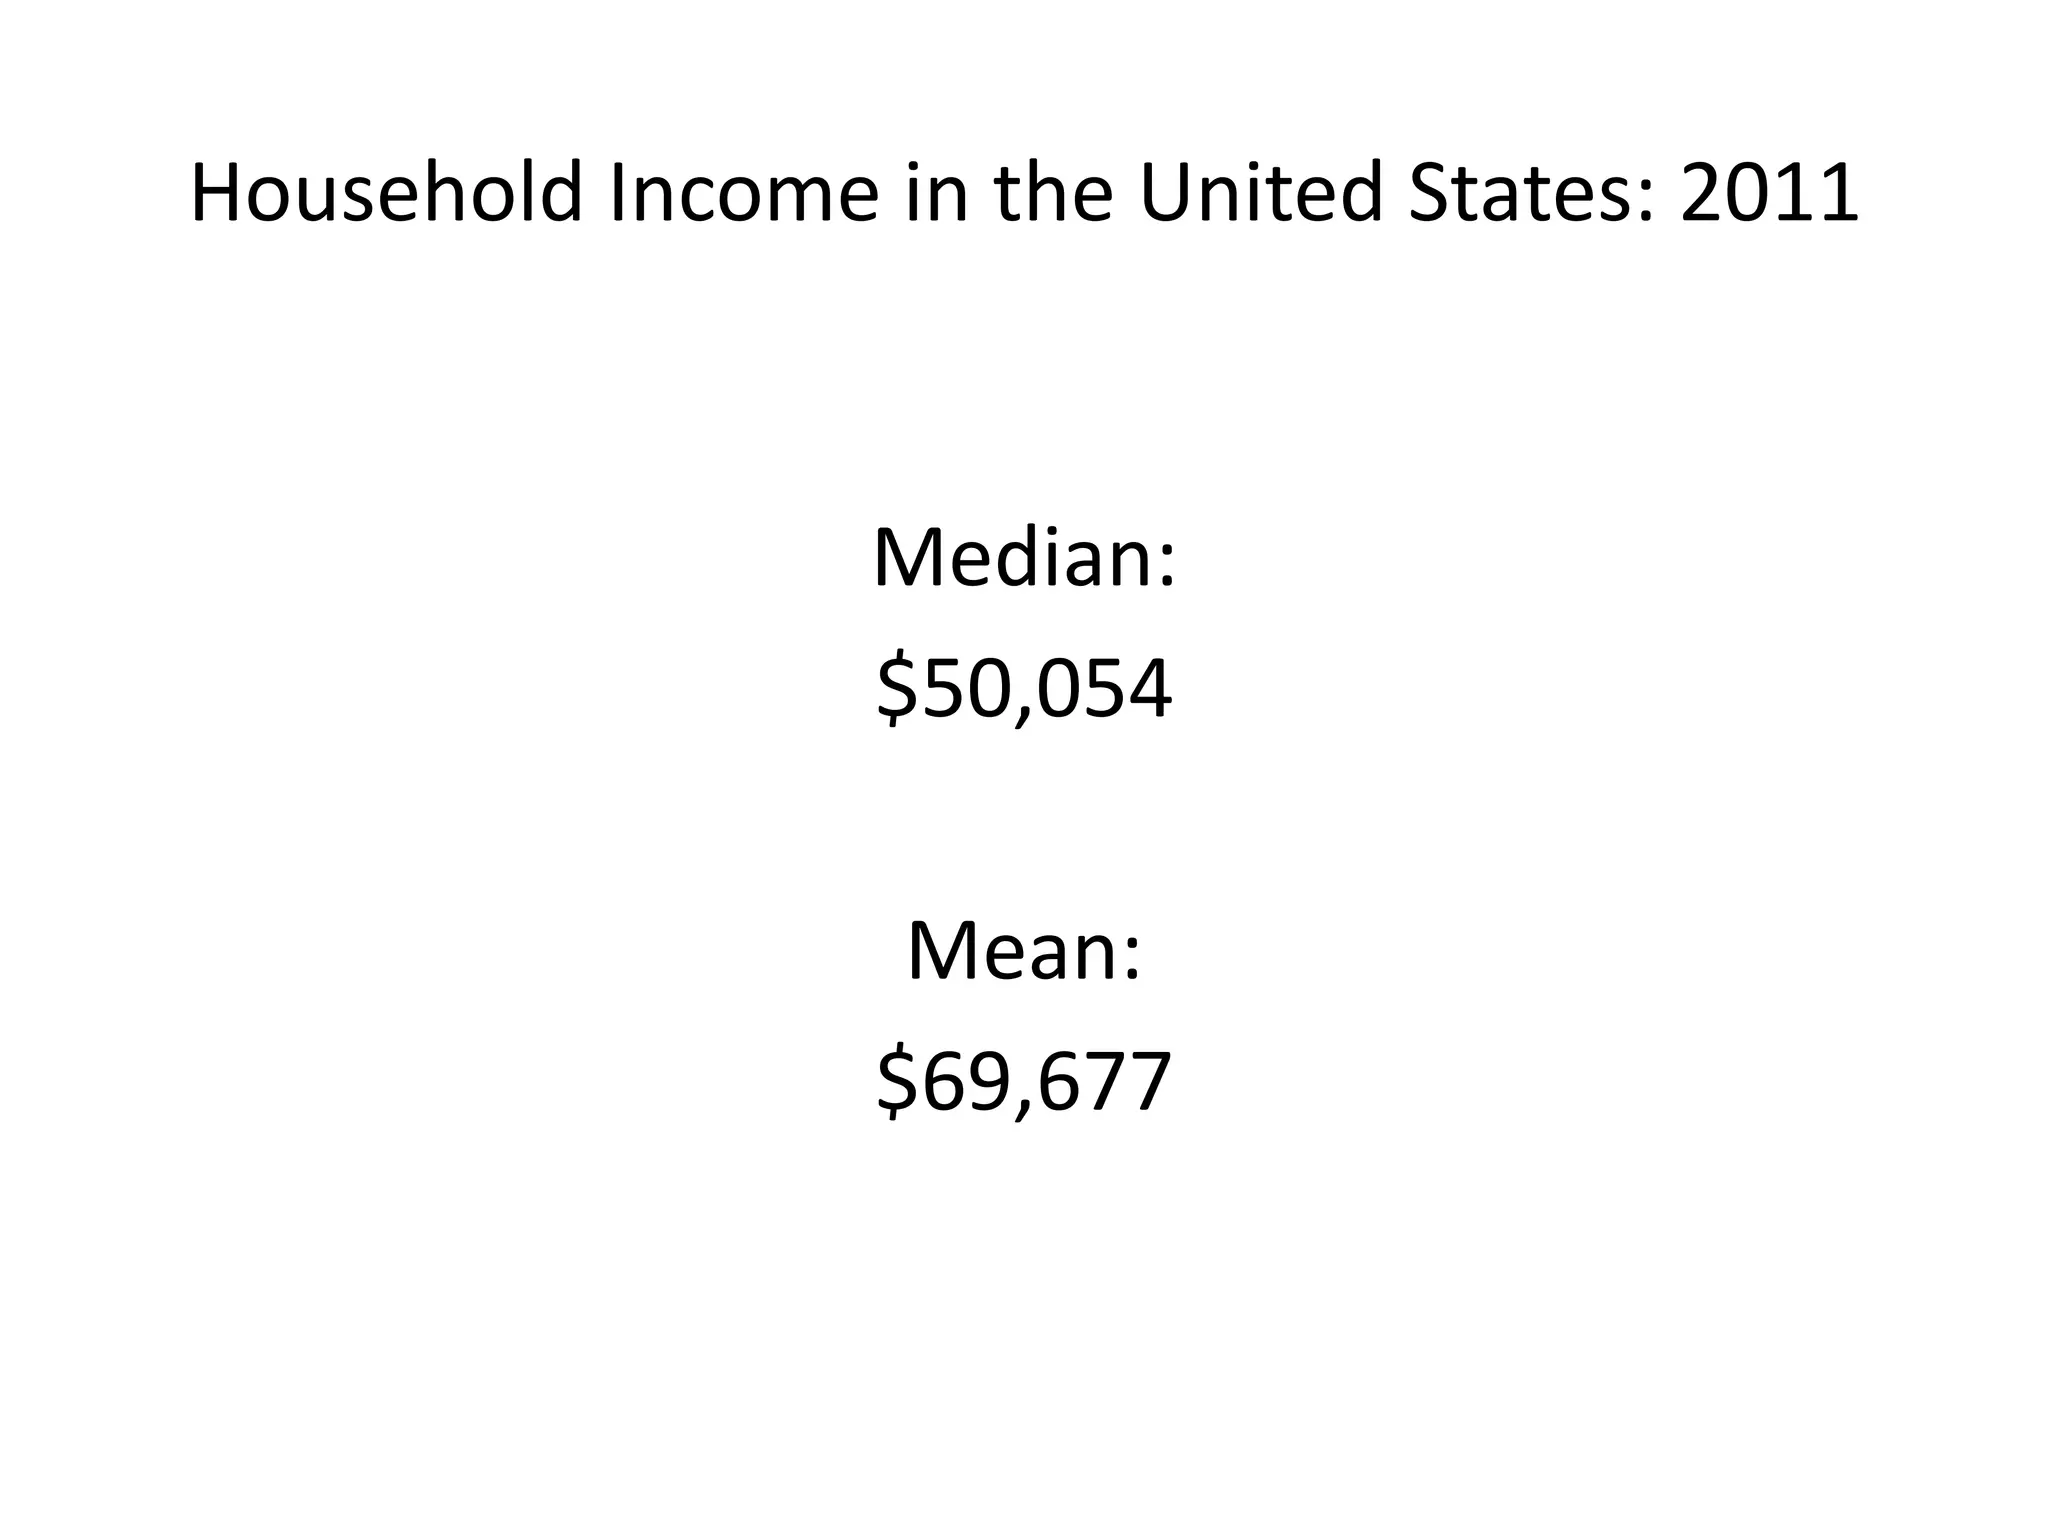
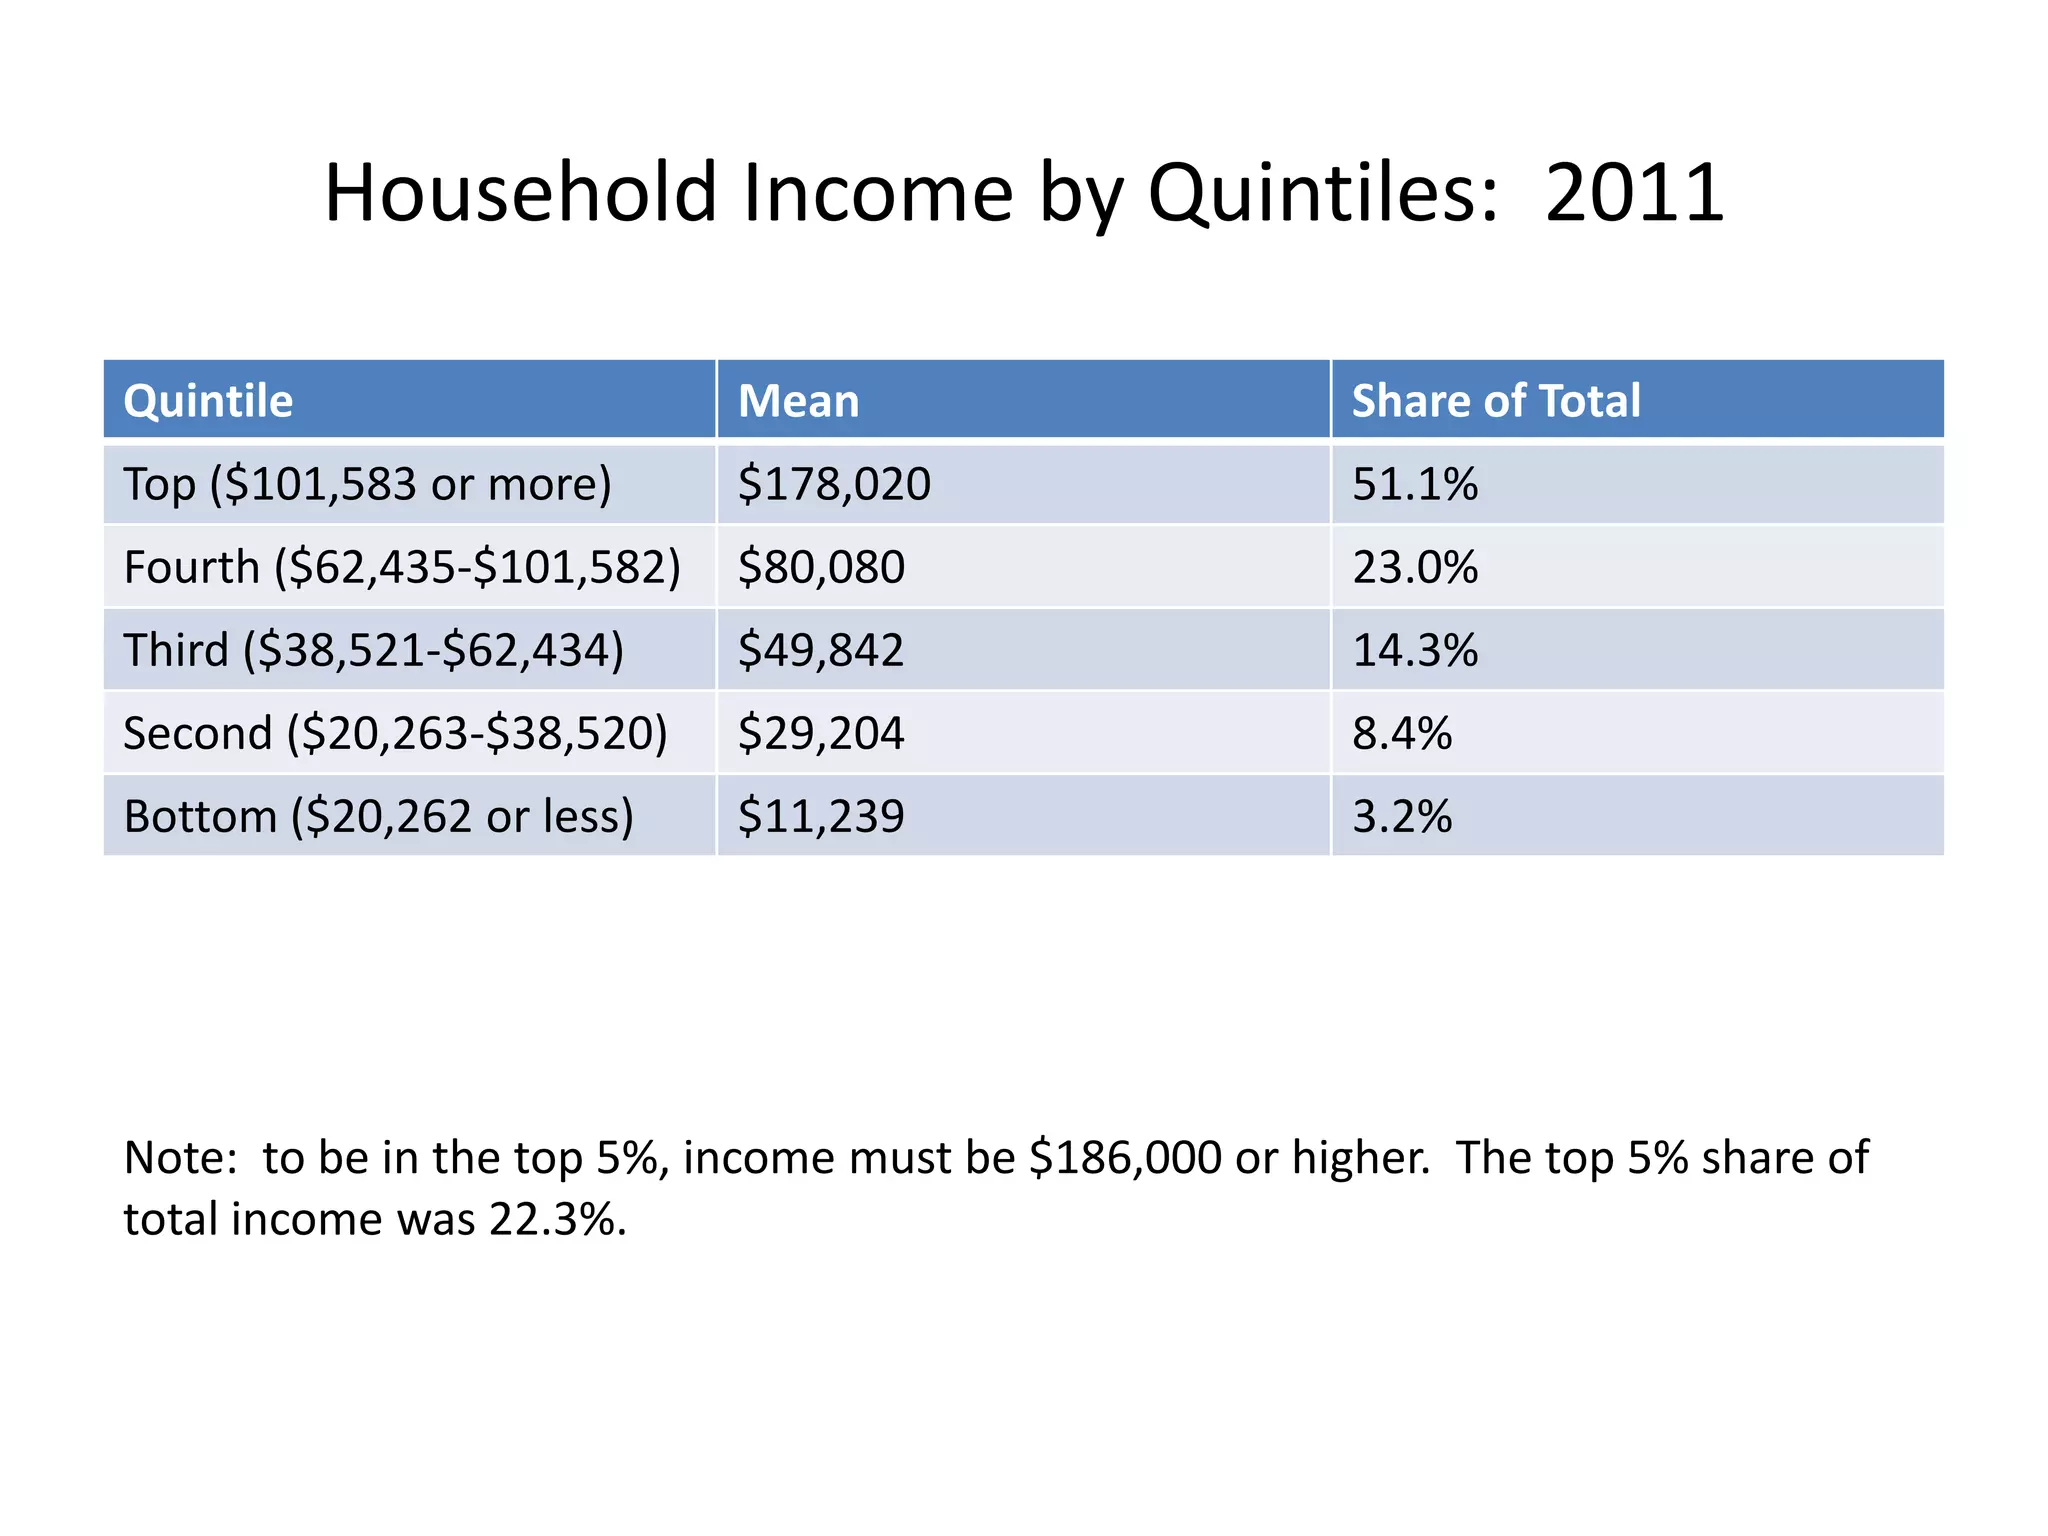
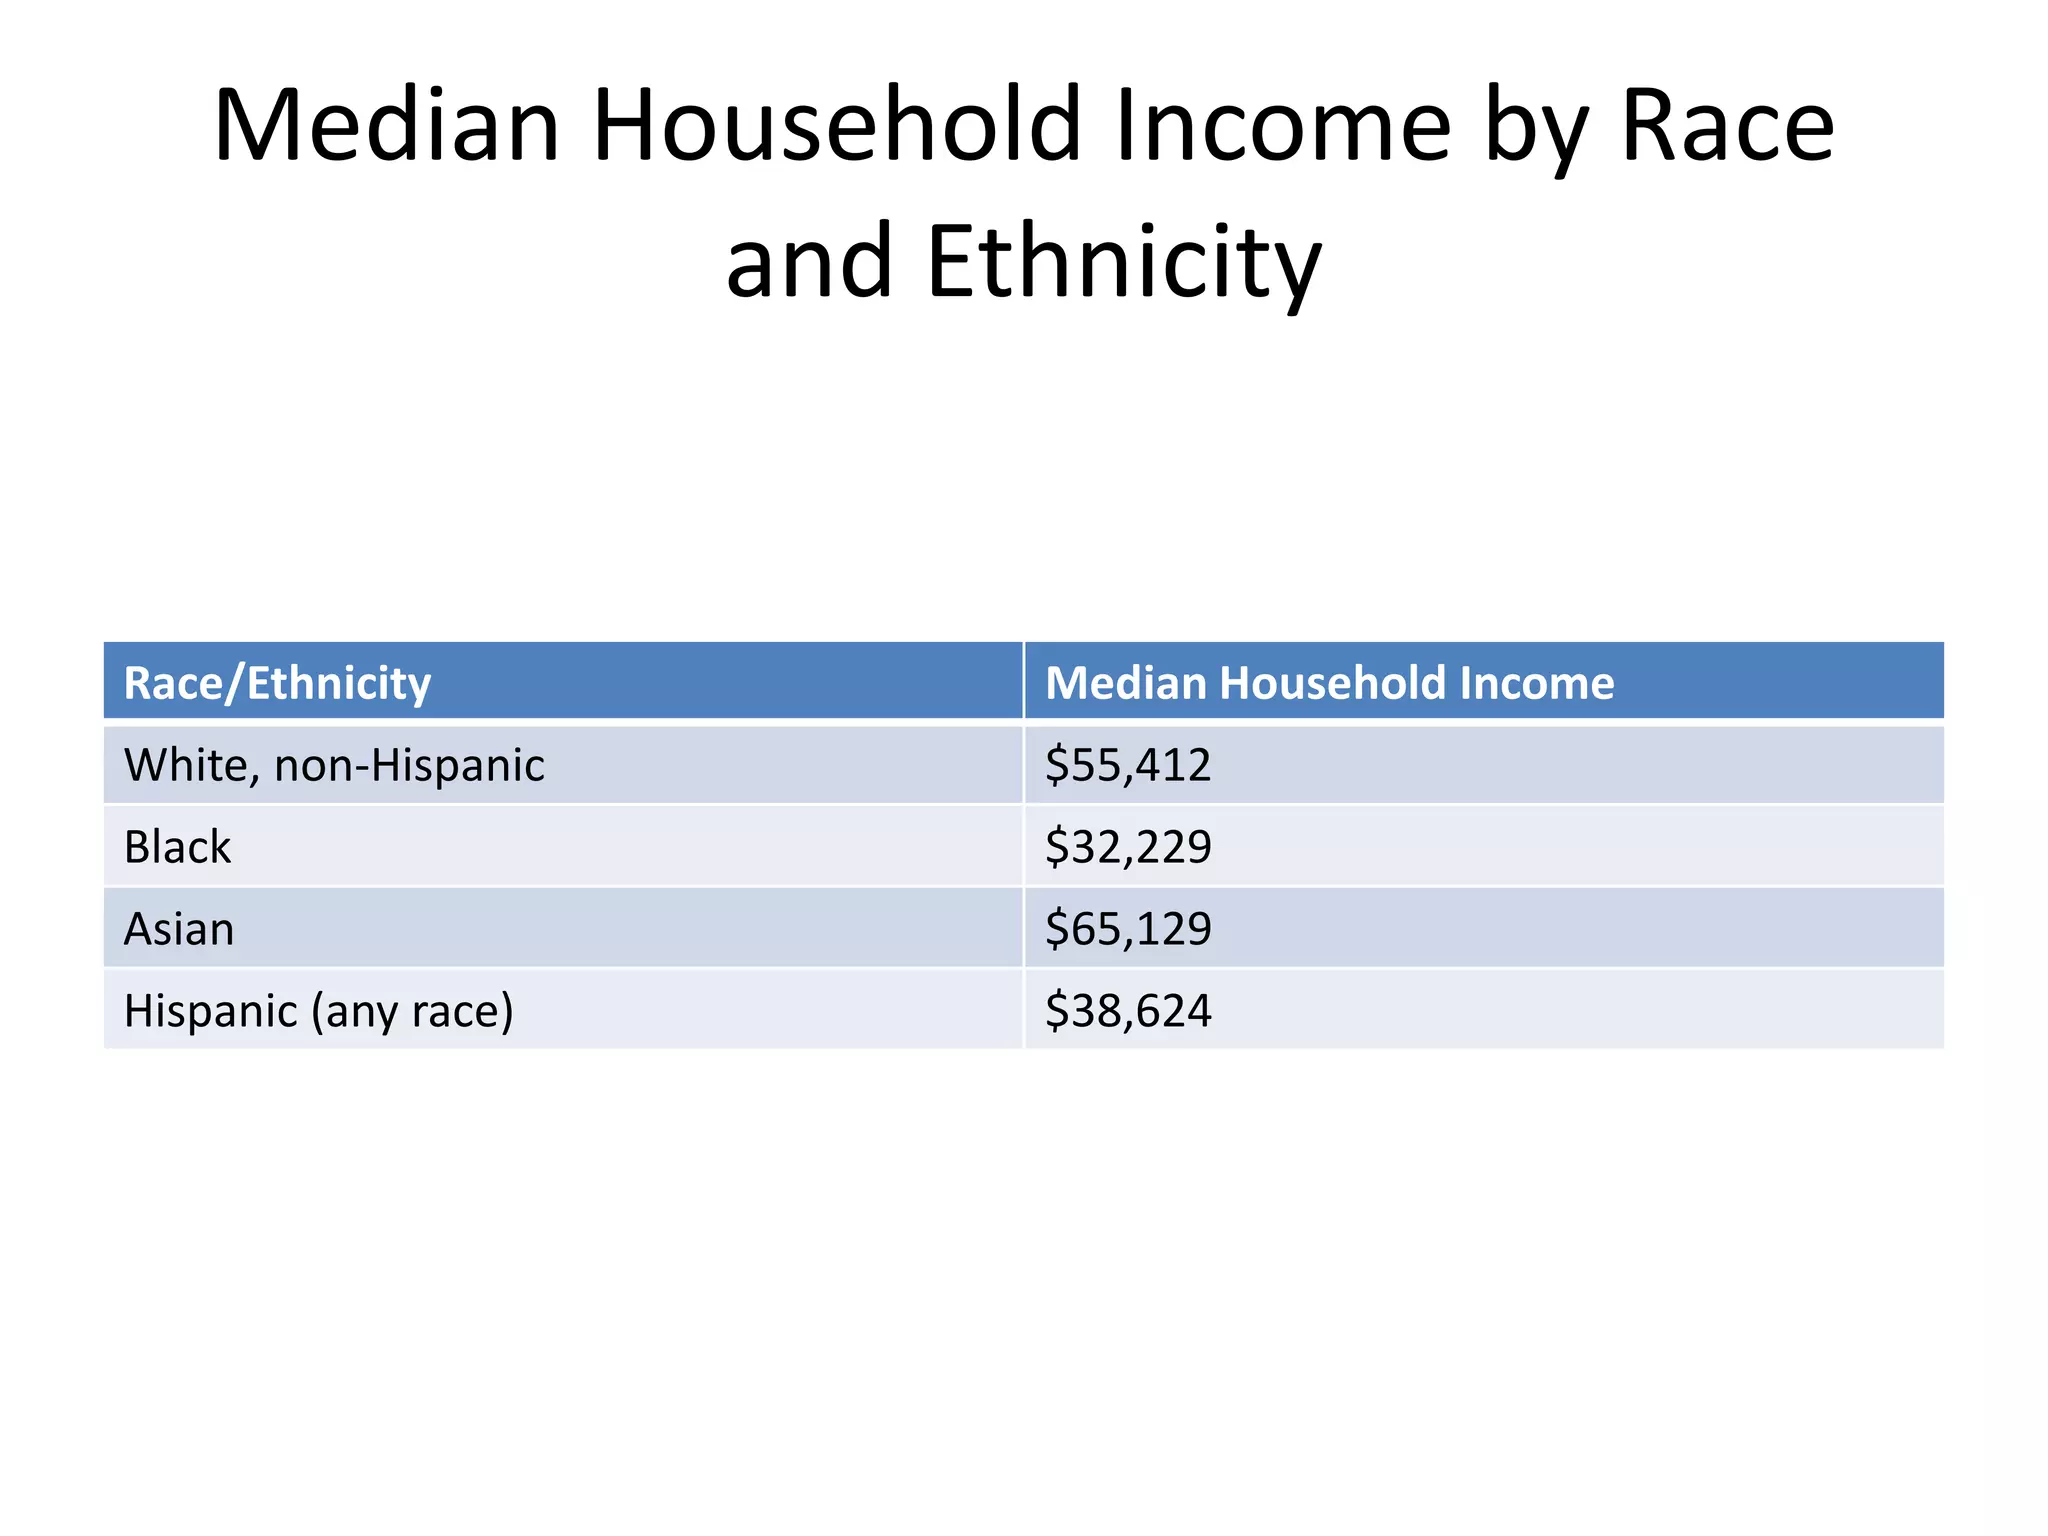
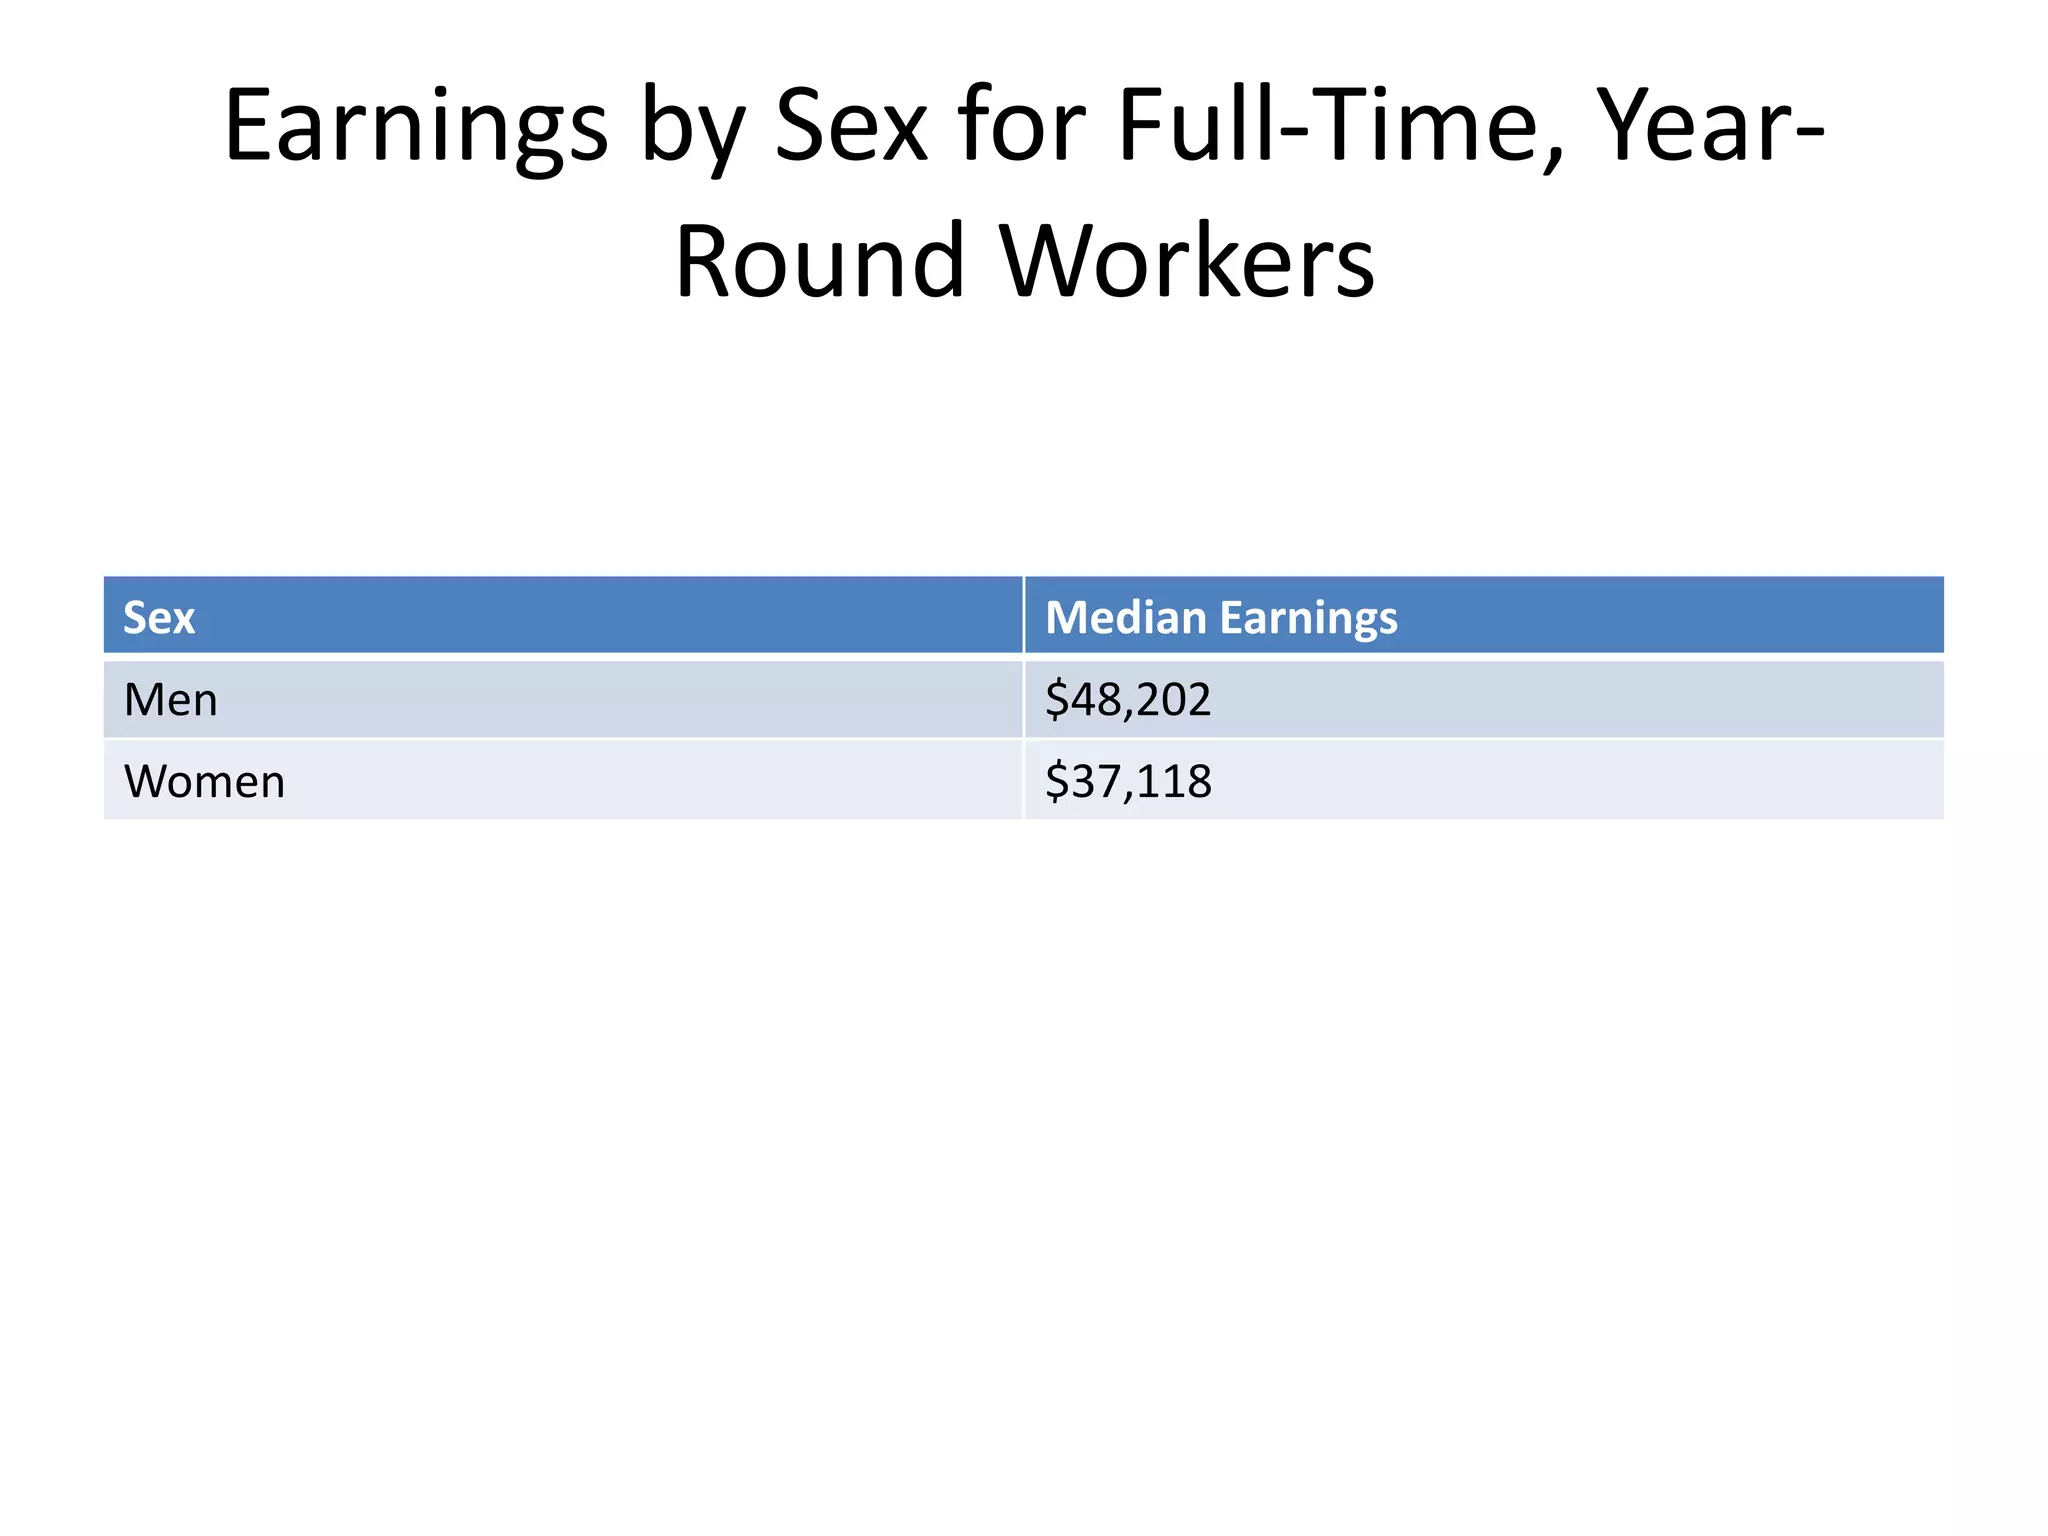
Defining and Measuring Poverty
in Social and Political Context
As a nation, we are on a cusp:
(1) 2012: the 50th anniversary of Michael
Harrington’s “The Other America,”
(2) 2013: the 50th anniversary of the March
on Washington for Jobs and Freedom (or the
Great March on Washington) on August 28th;
(3) 2014: the War on Poverty (the Economic
Opportunity Act of 1964);
and
(4) 2015: the 50th anniversary of Medicare and
Medicaid (Social Security Act Amendments of
1965)
Impact of the War on Poverty
The poverty rate in
1964: 19.0%
1969: 12.1%
A decline of 36.3% in the first five years of the War
on Poverty
Poverty During the Past Decade
Year Number Percent
2011 46,200,000 15.0
2010 46,200,000 15.1
2009 43,600,000 14.3
2008 39,800,000 13.2
2007 37,300,000 12.5
2006 36,500,000 12.3
2005 37,000,000 12.6
2004 37,000,000 12.7
2003 35,900,000 12.5
2002 34,600,000 12.1
2001 32,900,000 11.7
From 2001 to 2011:
an increase of 13,300,000 individuals in poverty
or
+40%
The poverty rate increased by 3.3%
or
+29%
The 2013 Poverty Guidelines for the 48
Contiguous States and the District of Columbia
Persons in Family Poverty Guidelines
1 $11,490
2 $15,510
3 $19,530
4 $23,550
5 $27,570
6 $31,590
7 $35,610
8 $39,630
For families with more than 8 persons, add $4020 for each additional person.
Roanoke, VA HUD Metro FMR Area (VA)
Two Parents, Two Children
Item Cost
Monthly Housing $764
Monthly Food $754
Monthly Child Care $1617
Monthly Transportation $607
Monthly Health Care $1403
Monthly Other Necessities $389
Monthly Taxes $510
Monthly Total $6043
Annual Total $72513
Economic Policy Institue Family Budget Calculator
Where does the Federal Poverty Line (FPL) come
from?
Mollie Orshansky:
January 9, 1915 – December 18, 2006
At that time,
most economists believed that the typical family
spent about one-third of its disposable income
on food.
So,
if we knew what a family spent on food,
we could create a poverty line by multiplying the
cost of a basket of food by three.
Why was a subsistence level food basket
chosen?
Why was a subsistence level food basket
chosen?
Cold War politics.
Why was a subsistence level food basket
chosen?
Cold War politics.
But numbers are always a matter of politics.
The Federal Poverty Line is an absolute
measure.
An absolute measure establishes a line.
If a person or family is below that line, they are
in poverty.
If they are above it – even by one dollar – they
are not in poverty
Numbers
Federal Poverty Line (FPL) or the poverty
threshold for a family of four in 2012:
$23,550
As an hourly wage:
$11.32
Food Stamps:
November, 2012
Supplemental Nutrition Assistance Program
(SNAP)
• Participants:
47,693,000
• Average Benefit:
$135.72
WIC:
November, 2012
Special Supplemental Nutrition Program
(Women, Infants and Children, or WIC)
• Participants:
8,789,000
• Average Benefit:
$43.77
National School Lunch Program:
November, 2012
• Average Daily Participation:
31,491,000
• Participating Children (free/reduced):
21,740,000
• Percent Free/Reduced:
69%
School Breakfast Program:
November, 2012
• Average Daily Participation:
13,436,000
• Participating Children (free/reduced):
11,316,000
• Percent Free/Reduced):
84%
Household Income in the United States: 2011
Median:
$50,054
Mean:
$69,677
Household Income by Quintiles: 2011
Quintile Mean Share of Total
Top ($101,583 or more) $178,020 51.1%
Fourth ($62,435-$101,582) $80,080 23.0%
Third ($38,521-$62,434) $49,842 14.3%
Second ($20,263-$38,520) $29,204 8.4%
Bottom ($20,262 or less) $11,239 3.2%
Note: to be in the top 5%, income must be $186,000 or higher. The top 5% share of
total income was 22.3%.
Median Household Income by Race
and Ethnicity
Race/Ethnicity Median Household Income
White, non-Hispanic $55,412
Black $32,229
Asian $65,129
Hispanic (any race) $38,624
Earnings by Sex for Full-Time, Year-
Round Workers
Sex Median Earnings
Men $48,202
Women $37,118
As a nation, we are on a cusp:
(1) 2012: the 50th anniversary of Michael Harrington’s
“The Other America,”
(2) 2013: the 50th anniversary of the March on
Washington for Jobs and Freedom (or the Great March on
Washington) on August 28th;
(3) 2014: the War on Poverty (the Economic Opportunity
Act of 1964);
and
(4) 2015: the 50th anniversary of Medicare and Medicaid
(Social Security Act Amendments of 1965)

Defining and Measuring Poverty in Social and Political Context - Keith Kilty

  • 1.
    Defining and MeasuringPoverty in Social and Political Context
  • 2.
    As a nation,we are on a cusp: (1) 2012: the 50th anniversary of Michael Harrington’s “The Other America,” (2) 2013: the 50th anniversary of the March on Washington for Jobs and Freedom (or the Great March on Washington) on August 28th; (3) 2014: the War on Poverty (the Economic Opportunity Act of 1964); and (4) 2015: the 50th anniversary of Medicare and Medicaid (Social Security Act Amendments of 1965)
  • 3.
    Impact of theWar on Poverty The poverty rate in 1964: 19.0% 1969: 12.1% A decline of 36.3% in the first five years of the War on Poverty
  • 4.
    Poverty During thePast Decade Year Number Percent 2011 46,200,000 15.0 2010 46,200,000 15.1 2009 43,600,000 14.3 2008 39,800,000 13.2 2007 37,300,000 12.5 2006 36,500,000 12.3 2005 37,000,000 12.6 2004 37,000,000 12.7 2003 35,900,000 12.5 2002 34,600,000 12.1 2001 32,900,000 11.7
  • 5.
    From 2001 to2011: an increase of 13,300,000 individuals in poverty or +40% The poverty rate increased by 3.3% or +29%
  • 6.
    The 2013 PovertyGuidelines for the 48 Contiguous States and the District of Columbia Persons in Family Poverty Guidelines 1 $11,490 2 $15,510 3 $19,530 4 $23,550 5 $27,570 6 $31,590 7 $35,610 8 $39,630 For families with more than 8 persons, add $4020 for each additional person.
  • 7.
    Roanoke, VA HUDMetro FMR Area (VA) Two Parents, Two Children Item Cost Monthly Housing $764 Monthly Food $754 Monthly Child Care $1617 Monthly Transportation $607 Monthly Health Care $1403 Monthly Other Necessities $389 Monthly Taxes $510 Monthly Total $6043 Annual Total $72513 Economic Policy Institue Family Budget Calculator
  • 8.
    Where does theFederal Poverty Line (FPL) come from?
  • 9.
    Mollie Orshansky: January 9,1915 – December 18, 2006
  • 10.
    At that time, mosteconomists believed that the typical family spent about one-third of its disposable income on food.
  • 11.
    So, if we knewwhat a family spent on food, we could create a poverty line by multiplying the cost of a basket of food by three.
  • 13.
    Why was asubsistence level food basket chosen?
  • 14.
    Why was asubsistence level food basket chosen? Cold War politics.
  • 15.
    Why was asubsistence level food basket chosen? Cold War politics. But numbers are always a matter of politics.
  • 16.
    The Federal PovertyLine is an absolute measure. An absolute measure establishes a line. If a person or family is below that line, they are in poverty. If they are above it – even by one dollar – they are not in poverty
  • 17.
    Numbers Federal Poverty Line(FPL) or the poverty threshold for a family of four in 2012: $23,550 As an hourly wage: $11.32
  • 18.
    Food Stamps: November, 2012 SupplementalNutrition Assistance Program (SNAP) • Participants: 47,693,000 • Average Benefit: $135.72
  • 19.
    WIC: November, 2012 Special SupplementalNutrition Program (Women, Infants and Children, or WIC) • Participants: 8,789,000 • Average Benefit: $43.77
  • 20.
    National School LunchProgram: November, 2012 • Average Daily Participation: 31,491,000 • Participating Children (free/reduced): 21,740,000 • Percent Free/Reduced: 69%
  • 21.
    School Breakfast Program: November,2012 • Average Daily Participation: 13,436,000 • Participating Children (free/reduced): 11,316,000 • Percent Free/Reduced): 84%
  • 22.
    Household Income inthe United States: 2011 Median: $50,054 Mean: $69,677
  • 23.
    Household Income byQuintiles: 2011 Quintile Mean Share of Total Top ($101,583 or more) $178,020 51.1% Fourth ($62,435-$101,582) $80,080 23.0% Third ($38,521-$62,434) $49,842 14.3% Second ($20,263-$38,520) $29,204 8.4% Bottom ($20,262 or less) $11,239 3.2% Note: to be in the top 5%, income must be $186,000 or higher. The top 5% share of total income was 22.3%.
  • 24.
    Median Household Incomeby Race and Ethnicity Race/Ethnicity Median Household Income White, non-Hispanic $55,412 Black $32,229 Asian $65,129 Hispanic (any race) $38,624
  • 25.
    Earnings by Sexfor Full-Time, Year- Round Workers Sex Median Earnings Men $48,202 Women $37,118
  • 26.
    As a nation,we are on a cusp: (1) 2012: the 50th anniversary of Michael Harrington’s “The Other America,” (2) 2013: the 50th anniversary of the March on Washington for Jobs and Freedom (or the Great March on Washington) on August 28th; (3) 2014: the War on Poverty (the Economic Opportunity Act of 1964); and (4) 2015: the 50th anniversary of Medicare and Medicaid (Social Security Act Amendments of 1965)