1. Development of fully automated ultrasensitive digital immunoassays using Single Molecule Array
(Simoa™) technology
Khushbu Bhatt, Andrew Hebert, Mikhail Levit
Sanofi Oncology, 640 Memorial Drive, Cambridge, MA 02138
Abstract
Purpose: Accurate analysis of protein biomarkers and cytokines is of
utmost importance for determining the target expression, therapeutic
efficacy, and toxicity in anti-cancer immunotherapeutics. However,
currently available immunoassays on ELISA and Meso Scale Discovery
platform are often not sensitive enough to detect low levels of proteins.
Method: Quanterix’s Simoa (Single molecule array) is highly sensitive,
fully automated immunoassay technology which makes use of arrays of
femtoliter sized chambers to isolate and detect single immuno-complex
on paramagnetic beads. This leads to detection of proteins in
femtomolar concentrations thus improving the sensitivity over
traditional immunoassays. It utilizes coupling of capture antibodies to
the paramagnetic beads followed by addition of analyte and
biotinylated antibodies which are labelled with the enzyme
streptavidin-β-galactosidase (SβG) and resorufin-β-galactopyranoside
as the substrate.
Result: Simoa based cytokine immunoassays were developed and
optimized to determine the target expression in murine model of tumor.
Variables like capture and detection antibody, SβG concentration, bead
number, diluent formulations, number of steps in the assay and the
incubation time were optimized. Assays with 10-200 fold improvement
in the sensitivity over Meso Scale Discovery and ELISA were developed
and validated.
Introduction: Simoa technology
Simoa platform makes use of sandwich immunoassay format
comprising of 3 steps:
1. Capture of analyte on the paramagnetic beads coated with the capture
antibody
2. Addition of biotinylated detection antibody to form an immuno-
sandwich
3. Labelling the detection antibody with the enzyme streptavidin-β-
galactosidase (SβG)
The instrument carries out three washings between each of these steps
Simoa assay can be carried out either in 3-step or 2-step or 1-step
format
1. 2-step assay- Incubating the detector with the analyte and the capture
beads prior to washing
2. 1-step assay- Incubation of all the components together
The capture beads with the immunocomplexes are resuspended in RGP
(resorufin β-galactopyranoside) substrate.
Beads are then pulled into an array of 216,000 fL sized wells, which
holds no more than single beads per well and the array is sealed by oil.
RGP substrate is hydrolyzed by SβG into fluorescent molecule
resorufin in the microwell if the analyte is captured and labelled.
Each single bead molecule generates high fluorescence signal locally
enabling digital readout and permitting measurements at femtomolar
concentrations.
Results
+
Results
Conclusion
Quanterix’s Simoa™ platform offers higher sensitivity and automation
for efficient processing of the samples with significant reduction in the
assay development time.
Simoa based cytokine immunoassays were developed and validated for
analyzing the concentration of cytokine in mice serum and tumor
models to ascertain the target expression
One to two orders of magnitude improvement in sensitivity was
achieved as compared to ELISA and Meso Scale Discovery
Assays were optimized for low background, high signal-to-noise ratio
and low matrix effect
Assays were evaluated for sensitivity, dilution, spike and recovery in
serum and tumor lysates.
Previously undetectable levels of the cytokine were detected in serum
and tumor lysates of the groups treated with the mRNA based
immunotherapy using the immunoassays developed on Simoa
platform.
Acknowledgement
I would like to thank my mentor Mikhail Levit and my team member
Andrew Hebert for training me in the lab and helping me with the
project.
Thanks to Timothy Wagenaar, Patrick Guirnalda, Tatiana Tolstykh,
Yu-an Zhang, Michael Lampa for assisting with the assay development
and optimization.
I would also like to thank the Biochemistry and Bioanalytics
department head Hong Cheng for her continued motivation, guidance,
support and patience during my time in Sanofi.
Assay development outline
Capture ab
Biotinylated detection ab
SβG
Chimeric protein assay development
Assay 3-step
Beads/reaction 500,000
Detector (ug/ml) 0.3
SβG (pM) 150
1. Determine the capture and detection ab
Capture ab: Y, detection ab: X
Higher background: 0.078 AEBs (acceptable < 0.02)
LLOD: 0.6 pg/ml
2. Optimize reagent concentration
Assay 2-step
Beads/reaction 250,000
Detector (ug/ml) 0.15
SβG (pM) 25
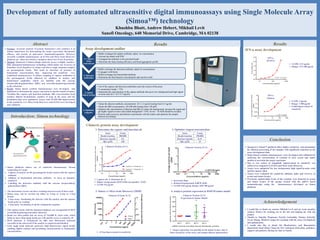
Chimeric Protein (X-Y)
Increased slope
Reduced background: 0.0078 AEBs
LLOD: 0.05 pg/ml, Range: 0.05-200 pg/ml
3. Simoa v/s Meso Scale Discovery (MSD)
2.5 log improvement in sensitivity
4. Analyze protein expression in B16F10 tumor model
Chimeric Protein (X-Y)
Expression in Tumor Model
G P N 7 5 5 0
pg/mgtotalprotein(lysate)
M ix 1 M ix 2 M ix 3 M ix 4
-1 0 0
0
1 0 0
2 0 0
3 0 0
4 0 0
m R N A m ix tu res e n c o d in g im m u n o -th e ra p e u tic p ro tein s
Target expression was possible in the tumor lysates due to
ultra-sensitivity of the assay and sample diluent optimization
IFN-α assay development
IF N -a
C o n c e n tra tio n (p g /m l)
Averageenzymesperbead
(AEB)
0 .1 1 1 0 1 0 0 1 0 0 0
0 .0 0 0 1
0 .0 0 1
0 .0 1
0 .1
1
1 0
L L O D : 0 .7 p g /m l
IFN-a
(Simoa)
IFN-a
(ELISA)
T ra n s fo rm o f IF N -a s td c u rv e
C o n c e n tra tio n (p g /m l)
O.D(450nm)
1 0 1 0 0 1 0 0 0
0 .0
0 .5
1 .0
1 .5
2 .0
2 .5
LLO D : 12.5 pg/m l
LLOD: 12.5 pg/ml,
Range: 12.5-400 pg/ml
LLOD: 2 pg/ml,
Range: 2-500 pg/ml
6-fold improvement in
sensitivity
1. Capture
bead
concentrate
• Buffer exchange the capture antibody, adjust its concentration
• Activate the beads with EDC
• Conjugate the antibody to the activated beads
• Determine the bead coating efficiency and bead aggregation profile
2. Detector
antibodies
• Buffer exchange the detection antibody, adjust its concentration
• Conjugate with biotin
• Buffer-exchange the biotinylated antibody
• Determine the final detector concentration and reaction yield
3. Initial
simoa testing
• Test if the capture and detection antibodies meet the criteria of the assay
• % monomeric beads > 75%
• Determine the concentration of the capture antibody that gives low background and high signal-
to-noise ratio (0.3 / 0.5/ 0.7 mg/ml)
4. Optimize
reagents
• Titrate the detector antibody concentration (0.1-1.2 ug/ml starting from 0.5 ug/ml)
• Titrate the SβG concentration (50-300 pM starting from 150 pM)
• Optimize the concentration of detector and SβG to reduce the background, increase the signal and
get higher signal-to-noise ratio (Ideal background < 0.02, levels > 18 AEB should be avoided
• Perform spike-recovery and dilution experiments with the matrix and optimize the sample
diluents accordingly
Chimeric Protein (X-Y)
C him eric P rotein (X -Y )
C o n cen tratio n (p g /m l)
Averageenzymesperbead
(AEB)
0.1 1 10 100 1000
0.01
0.1
1
10
100
C apture: X , D etection: Y
C apture: Y , D etection: X
Chimeric Protein (X-Y)