Keynote technicals intraday future levels for 051212
•
0 likes•169 views

The document provides the intra-day technical levels for various companies trading on the NSE for December 5, 2012. It includes the previous day's closing price, intra-day pivot points, and resistance and support levels for each stock. The levels are intended to help analyze the trend and potential price movement during the trading session.

Recommended
Recommended
More Related Content
What's hot
What's hot (20)
Viewers also liked
Viewers also liked (20)
Similar to Keynote technicals intraday future levels for 051212
Similar to Keynote technicals intraday future levels for 051212 (11)
More from Keynote Capitals Ltd.
More from Keynote Capitals Ltd. (20)
Keynote technicals intraday future levels for 051212
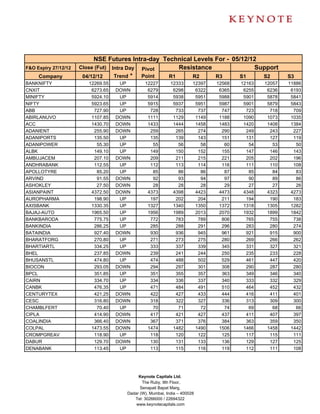
- 1. NSE Futures Intra-day Technical Levels For - 05/12/12 F&O Expiry 27/12/12 Close (Fut) Intra Day Pivot Resistance Support Company 04/12/12 Trend * Point R1 R2 R3 S1 S2 S3 BANKNIFTY 12269.55 UP 12227 12333 12397 12568 12163 12057 11886 CNXIT 6273.65 DOWN 6279 6298 6322 6365 6255 6236 6193 MINIFTY 5924.10 UP 5914 5938 5951 5988 5901 5878 5841 NIFTY 5923.65 UP 5915 5937 5951 5987 5901 5879 5843 ABB 727.90 UP 728 733 737 747 723 718 709 ABIRLANUVO 1107.85 DOWN 1111 1129 1149 1188 1090 1073 1035 ACC 1430.70 DOWN 1433 1444 1458 1483 1420 1408 1384 ADANIENT 255.90 DOWN 259 265 274 290 249 243 227 ADANIPORTS 135.50 UP 135 139 143 151 131 127 119 ADANIPOWER 55.30 UP 55 56 58 60 54 53 50 ALBK 149.10 UP 149 150 152 155 147 146 143 AMBUJACEM 207.10 DOWN 209 211 215 221 205 202 196 ANDHRABANK 112.55 UP 112 113 114 116 111 110 108 APOLLOTYRE 85.20 UP 85 86 86 87 85 84 83 ARVIND 91.55 DOWN 92 93 94 97 90 89 86 ASHOKLEY 27.50 DOWN 28 28 28 29 27 27 26 ASIANPAINT 4372.50 DOWN 4373 4398 4423 4473 4348 4323 4273 AUROPHARMA 198.90 UP 197 202 204 211 194 190 183 AXISBANK 1330.35 UP 1327 1340 1350 1372 1318 1305 1282 BAJAJ-AUTO 1965.50 UP 1956 1989 2013 2070 1932 1899 1842 BANKBARODA 775.75 UP 772 783 789 806 765 755 738 BANKINDIA 286.25 UP 285 288 291 296 283 280 274 BATAINDIA 927.40 DOWN 930 936 945 961 921 915 900 BHARATFORG 270.80 UP 271 273 275 280 269 266 262 BHARTIARTL 334.25 UP 333 337 339 345 331 327 321 BHEL 237.85 DOWN 239 241 244 250 235 233 228 BHUSANSTL 474.80 UP 474 488 502 529 461 447 420 BIOCON 293.05 DOWN 294 297 301 308 290 287 280 BPCL 351.85 UP 351 355 357 363 349 346 340 CAIRN 334.70 UP 334 336 337 340 333 332 329 CANBK 476.35 UP 471 484 491 510 464 452 432 CENTURYTEX 421.25 DOWN 422 427 433 444 416 411 401 CESC 316.80 DOWN 318 322 327 336 313 309 300 CHAMBLFERT 70.40 UP 70 71 72 74 69 68 66 CIPLA 414.90 DOWN 417 421 427 437 411 407 397 COALINDIA 366.40 DOWN 367 371 376 384 363 359 350 COLPAL 1473.55 DOWN 1474 1482 1490 1506 1466 1458 1442 CROMPGREAV 118.90 UP 118 120 122 125 117 115 111 DABUR 129.70 DOWN 130 131 133 136 129 127 125 DENABANK 113.45 UP 113 115 116 119 112 111 108 Keynote Capitals Ltd. The Ruby, 9th Floor, Senapati Bapat Marg, Dadar (W), Mumbai, India – 400028 Tel: 30266000 / 22694322 www.keynotecapitals.com
- 2. NSE Futures Intra-day Technical Levels For - 05/12/12 F&O Expiry 27/12/12 Close (Fut) Intra Day Pivot Resistance Support Company 04/12/12 Trend * Point R1 R2 R3 S1 S2 S3 DISHTV 78.75 UP 78 80 81 83 77 76 74 DIVISLAB 1178.90 DOWN 1179 1186 1193 1206 1172 1166 1153 DLF 214.50 UP 214 217 220 225 211 208 203 DRREDDY 1841.00 DOWN 1844 1852 1862 1880 1834 1827 1809 EXIDEIND 146.65 DOWN 147 149 151 156 144 142 138 FEDERALBNK 486.95 DOWN 488 491 496 504 483 479 471 FINANTECH 1149.30 DOWN 1151 1168 1188 1224 1132 1114 1077 GAIL 354.15 UP 353 357 359 365 351 348 342 GMRINFRA 19.40 DOWN 19 20 20 21 19 19 18 GODREJIND 317.65 UP 314 322 326 338 310 303 291 GRASIM 3308.60 DOWN 3329 3354 3400 3472 3283 3257 3186 GSPL 76.35 UP 76 77 77 79 75 75 73 GUJFLUORO 334.40 UP 334 342 349 364 327 319 304 GVKPIL 14.00 UP 14 14 14 15 14 13 13 HAVELLS 607.55 UP 604 615 623 643 596 585 565 HCLTECH 652.30 UP 650 656 660 669 646 641 631 HDFC 847.25 UP 845 852 857 869 840 832 820 HDFCBANK 690.65 UP 690 694 698 705 687 683 675 HDIL 116.55 UP 116 118 120 123 115 112 109 HEROMOTOCO 1818.70 DOWN 1846 1882 1946 2047 1782 1745 1644 HEXAWARE 110.55 DOWN 111 112 114 117 109 108 105 HINDALCO 117.55 UP 117 118 119 120 117 116 115 HINDPETRO 286.80 DOWN 289 292 297 306 284 281 273 HINDUNILVR 537.50 DOWN 538 541 545 552 535 532 525 HINDZINC 141.60 DOWN 142 143 144 147 140 139 136 IBREALEST 71.00 DOWN 71 72 74 77 70 68 65 ICICIBANK 1126.20 UP 1119 1136 1147 1174 1109 1092 1065 IDBI 110.10 UP 110 112 113 116 108 106 103 IDEA 98.35 UP 98 99 100 102 97 96 94 IDFC 172.75 UP 172 174 176 180 171 169 165 IFCI 33.60 UP 33 34 35 37 32 31 29 IGL 267.10 DOWN 268 271 274 280 265 263 257 INDHOTEL 65.80 DOWN 66 67 68 71 65 64 61 INDIACEM 88.85 DOWN 89 91 92 95 88 87 84 INDUSINDBK 418.00 DOWN 419 423 428 436 415 411 403 INFY 2448.75 UP 2446 2464 2480 2513 2431 2413 2379 IOB 83.05 UP 83 84 85 87 82 80 78 IOC 264.65 DOWN 265 266 267 269 264 263 261 IRB 137.00 DOWN 138 139 141 145 136 134 131 ITC 297.10 UP 297 299 300 303 295 294 290 Keynote Capitals Ltd. The Ruby, 9th Floor, Senapati Bapat Marg, Dadar (W), Mumbai, India – 400028 Tel: 30266000 / 22694322 www.keynotecapitals.com
- 3. NSE Futures Intra-day Technical Levels For - 05/12/12 F&O Expiry 27/12/12 Close (Fut) Intra Day Pivot Resistance Support Company 04/12/12 Trend * Point R1 R2 R3 S1 S2 S3 IVRCLINFRA 44.10 UP 44 45 45 47 43 43 41 JINDALSTEL 410.45 DOWN 411 416 422 433 406 401 390 JISLJALEQS 72.40 UP 72 73 74 76 71 70 69 JPASSOCIAT 101.00 UP 100 103 104 108 98 96 91 JPPOWER 43.65 UP 43 45 46 50 41 39 35 JSWENERGY 64.85 DOWN 65 66 67 70 64 63 60 JSWSTEEL 758.85 UP 758 768 777 797 749 739 720 JUBLFOOD 1279.20 DOWN 1280 1292 1305 1329 1268 1256 1232 KOTAKBANK 673.75 UP 671 680 685 700 665 657 642 KTKBANK 173.05 DOWN 178 184 195 212 167 160 143 LICHSGFIN 271.70 UP 270 275 278 286 267 262 254 LT 1672.10 UP 1669 1681 1689 1709 1661 1649 1629 LUPIN 597.35 UP 596 601 606 615 592 586 576 M&M 946.15 DOWN 951 957 967 984 940 934 917 MARUTI 1487.90 DOWN 1492 1502 1516 1540 1478 1469 1445 MCDOWELL-N 2011.80 UP 2009 2035 2057 2105 1987 1961 1913 MCLEODRUSS 360.70 UP 360 365 369 378 356 351 343 MPHASIS 391.90 DOWN 397 404 415 433 385 379 361 MRF 11236.55 UP 11154 11358 11479 11804 11033 10829 10504 NHPC 23.80 DOWN 24 24 24 25 24 23 23 NMDC 164.10 DOWN 165 166 167 169 163 162 160 NTPC 159.85 DOWN 160 162 163 166 159 157 154 OFSS 2930.45 DOWN 2947 2982 3034 3121 2895 2860 2773 ONGC 261.35 DOWN 262 264 267 271 260 258 253 OPTOCIRCUI 106.20 DOWN 107 110 113 119 103 101 95 ORIENTBANK 339.45 UP 339 343 346 354 335 331 323 PANTALOONR 231.65 UP 231 238 244 258 225 218 204 PEL 504.15 UP 502 510 515 528 497 489 476 PETRONET 162.90 DOWN 163 164 166 168 162 161 159 PFC 194.40 DOWN 195 197 200 205 192 190 186 PNB 794.05 UP 792 800 806 820 786 778 764 POWERGRID 121.05 UP 121 122 123 124 120 119 117 PTC 75.40 DOWN 76 77 78 80 75 74 71 PUNJLLOYD 55.55 UP 55 56 57 59 54 53 52 RANBAXY 515.65 UP 513 521 527 540 507 499 486 RAYMOND 459.00 DOWN 459 470 481 502 448 438 416 RCOM 73.15 UP 73 74 75 78 71 70 67 RECLTD 235.50 DOWN 236 238 241 247 233 230 225 RELCAPITAL 439.40 UP 435 445 451 467 429 419 402 RELIANCE 830.10 UP 824 837 843 863 818 805 786 Keynote Capitals Ltd. The Ruby, 9th Floor, Senapati Bapat Marg, Dadar (W), Mumbai, India – 400028 Tel: 30266000 / 22694322 www.keynotecapitals.com
- 4. NSE Futures Intra-day Technical Levels For - 05/12/12 F&O Expiry 27/12/12 Close (Fut) Intra Day Pivot Resistance Support Company 04/12/12 Trend * Point R1 R2 R3 S1 S2 S3 RELINFRA 502.20 UP 498 507 512 526 493 485 471 RENUKA 31.90 UP 32 32 33 34 31 30 29 RPOWER 98.35 UP 98 100 101 104 97 95 92 SAIL 82.10 UP 82 83 84 85 81 80 79 SBIN 2247.70 UP 2210 2295 2341 2473 2163 2078 1947 SESAGOA 181.85 DOWN 182 184 186 190 180 178 174 SIEMENS 685.50 UP 685 690 695 704 681 676 667 SINTEX 64.05 DOWN 64 65 66 68 63 63 61 SRTRANSFIN 689.10 UP 686 697 704 722 679 668 650 STER 107.70 DOWN 108 109 111 113 106 105 102 SUNPHARMA 709.70 DOWN 711 714 718 725 707 704 697 SUNTV 416.10 UP 415 424 432 448 407 398 382 SUZLON 18.50 DOWN 19 19 20 21 18 18 17 SYNDIBANK 125.90 DOWN 126 128 131 135 124 122 117 TATACHEM 355.40 UP 355 370 385 414 340 325 296 TATACOMM 230.70 UP 231 233 235 240 228 226 221 TATAGLOBAL 167.30 DOWN 168 170 172 177 165 164 159 TATAMOTORS 273.45 DOWN 274 277 280 287 270 267 261 TATAMTRDVR 163.40 DOWN 164 166 168 173 162 160 155 TATAPOWER 112.50 UP 111 114 116 122 109 106 100 TATASTEEL 391.20 UP 391 394 396 402 388 385 380 TCS 1308.85 DOWN 1313 1324 1339 1364 1299 1288 1263 TECHM 896.45 DOWN 897 903 910 923 890 884 872 TITAN 307.55 UP 308 310 312 317 305 303 298 UCOBANK 78.10 UP 78 79 79 81 77 77 75 ULTRACEMCO 1986.55 DOWN 1990 2005 2023 2056 1972 1957 1924 UNIONBANK 247.30 UP 245 251 255 265 241 234 224 UNIPHOS 124.90 DOWN 126 127 130 134 123 122 118 UNITECH 33.85 UP 33 35 36 38 32 31 29 VIJAYABANK 61.10 DOWN 61 62 63 64 60 60 58 VOLTAS 115.35 UP 114 117 118 122 113 111 107 WELCORP 106.00 DOWN 106 107 109 111 105 104 102 WIPRO 390.65 DOWN 394 399 407 420 386 381 368 Keynote Capitals Ltd. The Ruby, 9th Floor, Senapati Bapat Marg, Dadar (W), Mumbai, India – 400028 Tel: 30266000 / 22694322 www.keynotecapitals.com
- 5. NSE Futures Intra-day Technical Levels For - 05/12/12 F&O Expiry 27/12/12 Close (Fut) Intra Day Pivot Resistance Support Company 04/12/12 Trend * Point R1 R2 R3 S1 S2 S3 YESBANK 452.15 UP 451 455 457 464 448 444 438 ZEEL 211.00 UP 208 216 221 233 203 196 183 Sanjay Bhatia (AVP – Technical Research), Email Id sanjay@keynotecapitals.net Pivot Point: Intra- Day Trading Tool. - The key to the use of this tool is the use of Stop Loss Intra Day Trend: It is valid only till the point where Price trades above Pivot Point. For Eg. “UP” would be valid till Price remains above Pivot Point. It would become “DOWN” in event Price trades below Pivot Point. Pivot Point (PP): This is a trigger point for Intra Day Buy / Sell based on the price range of the previous day. R1: Resistance 1: 1st Resistance level over Pivot Point, R2: Resistance 2: Next Resistance level after R1. R3: Resistance 3: Next Resistance level after R2. S1: Support 1: 1st Support level after Pivot Point, S2: Support 2: Next Support level after S1. S3: Support 3: Next Support level after S2. Note: As per this tool, the trader should take BUY position just above the Pivot Point and keep the Pivot Point level as stop loss and the first target would be R1 level (Resistance 1). If R1 is crossed then R2 (Resistance 2) becomes the next target with the stop loss placed at R1 level. If R2 is crossed then R3 (Resistance 3) becomes the next target with the stop loss placed at R2 level. Similarly if price goes below the Pivot Point the trader should take a SELL position and keep the Pivot Point level as the stop loss and the first target would be S1 level (Support 1). If S1 level is breached then S2 level (Support 2) becomes the next target with the stop loss placed at S1 level. If S2 level is breached then S3 level (Support 3) becomes the next target with the stop loss placed at S2 level. Disclaimer: This document is not for public distribution and has been furnished to you solely for your information and must not be reproduced or redistributed to any other person. Persons into whose possession this document may come are required to observe these restrictions. This material is for the personal information of the authorized recipient, and we are not soliciting any action based upon it. This report is not to be construed as an offer to sell or the solicitation of an offer to buy any security in any jurisdiction where such an offer or solicitation would be illegal. It is for the general information of clients of Keynote Capitals Ltd. It does not constitute a personal recommendation or take into account the particular investment objectives, financial situations, or needs of individual clients. We have reviewed the report and in so far as it includes current or historical information, it is believed to be reliable though its accuracy or completeness cannot be guaranteed. Neither Keynote Capitals Ltd., nor any person connected with it, accepts any liability arising from the use of this document. The recipients of this material should rely on their own investigations and take their own professional advice. Price and value of the investments referred to in this material may go up or down. Past performance is not a guide for future performance. Certain transactions including those involving futures, options and other derivatives as well as non-investment grade securities involve substantial risk and are not suitable for all investors. Reports based on technical analysis centers on studying charts of a stock’s price movement and trading volume, as opposed to focusing on a company’s fundamentals and as such, may not match with a report on a company’s fundamentals. Opinions expressed are our current opinions as of the date appearing on this material only. While we endeavor to update on a reasonable basis the information discussed in this material, there may be regulatory, compliance or other reasons that prevent us from doing so. Prospective investors and others are cautioned that any forward looking statements are not predictions and may be subject to change without notice. Our proprietary trading and investment businesses may make investment decisions that are inconsistent with the recommendations expressed herein. We and our affiliates, officers, directors, and employees world wide may: (a) from time to time have long or short positions in and buy or sell the securities thereof of company (ies) mentioned herein or (b) be engaged in any other transaction involving such securities and earn brokerage or other compensation or act as a market maker in the financial instruments of the company (ies) discussed herein or act as advisor or lender/ borrower to such company (ies) or have other potential conflict of interest with respect to any recommendation and related information and opinions. The analyst for this report certifies that all of the views expressed in this report accurately reflect his or her personal views about the subject company or companies and its or their securities, and no part of his or her compensation was, is or will be, directly or indirectly related to specific recommendations or views expressed in this report. No part of this material may be duplicated in any form and/or redistributed without Keynote Capitals Ltd’s., prior written consent. Keynote Capitals Ltd. The Ruby, 9th Floor, Senapati Bapat Marg, Dadar (W), Mumbai, India – 400028 Tel: 30266000 / 22694322 www.keynotecapitals.com