Download to read offline
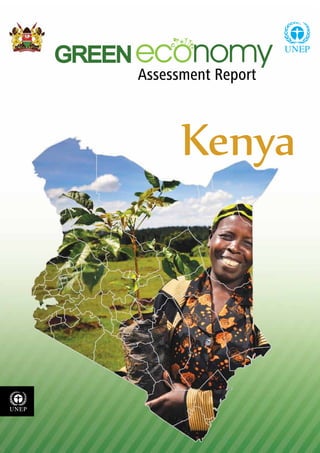
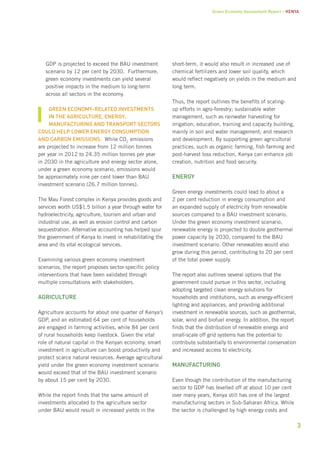
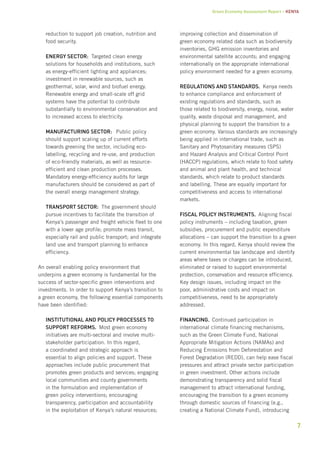
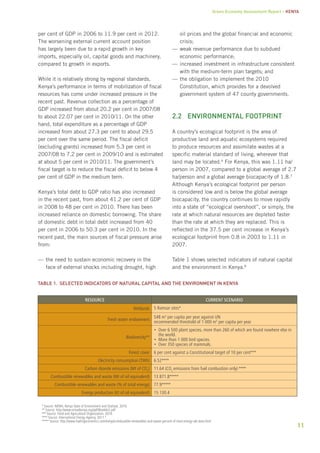
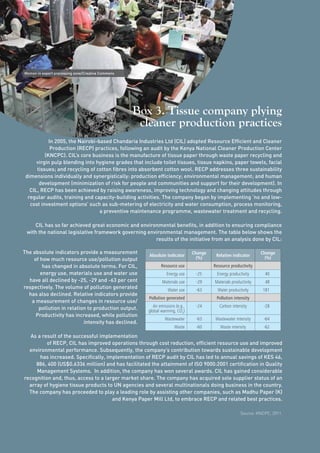
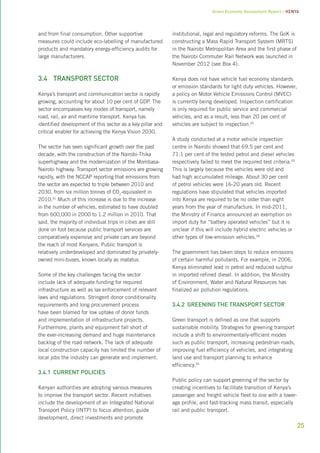
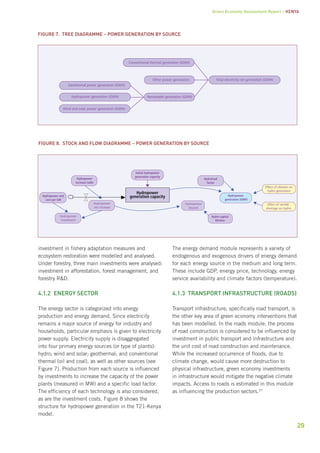
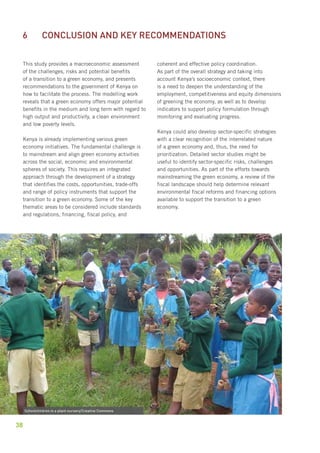
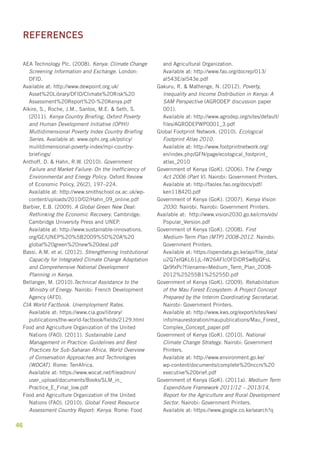
![Table 4. Policy and legal provisions for a green economy
14
State programme/
Strategy/Action plan Provisions Main implementation
agency
Overall national development
1 Constitution of Kenya 2010
− Article 42 recognizes a clean and healthy environment as a right.
− Article 60 (c) calls for sustainable and productive management of land
resources
− Article 69 [(a)-(h)] declares that the State shall ensure sustainable
exploitation, utilization, and protection of genetic and biological
diversity; establish a system for environmental impact assessment; and
achieve and maintain a tree cover of at least 10 per cent of the land
area of Kenya.
Government of Kenya
2
Kenya Vision 2030
Over-reaching vision and overall policy framework for sustainable
development
Ministry of Devolution and
Planning
First Medium-Term Plan,
2008-2012: Kenya Vision
2030
Programmes and projects for 2008-2012: restoration of ecosystems,
including rehabilitation and protection of the five water towers (Mau, Mt.
Kenya, Aberdares, Cheregany and Mt. Kenya); preparation of national land
use plan, waste management systems, exploration and mining, invasive
species, geological mapping, renewable energy and sustainable land use.
Ministry of Devolution and
Planning
Second Medium-Term Plan,
2013-2017
Some programmes and projects for 2013-2017 include: strengthening
environmental governance; waste management and pollution control;
rehabilitation of urban rivers; rehabilitation and protection of the water
towers, forest and wildlife conservation and management; promotion and
piloting of green energy; review of water resources management; land
reclamation; implementation of the NCCRS and development of a national
green economy strategy.
Ministry of Devolution and
Planning
4
Population Policy for National
Development (PPND)
PPND recognizes the impact of rapid population growth on Kenya’s
development goals and proposes a multi-sectoral approach to address this
issue, with a focus on voluntary family planning.
Ministry of Devolution and
Planning
5 Physical Planning Act
Reserve all land planned for open spaces, parks, urban forests and green
belts.
Ministry of Lands, Housing
and Urban Development
6
Local Government Act
(Revised)
Utilization of sewage systems including removal and destruction of refuse
and effluents
Ministry of Devolution and
Planning
6
Arid and Semi-Arid Lands
(ASALs) National Vision and
Strategy: Natural Resource
Management, 2005-2015
Sets out the overarching principles and broad actions required to transform
the Kenyan ASALs into national wealth and employment creators.
Ministry of Devolution and
Planning
Health
7 Public Health Act Provisions concerning sanitation and health Ministry of Health
Agriculture
8
Agricultural Sector
Development Strategy (ASDS)
2010-2020
ASDS seeks to progressively reduce unemployment and poverty in Kenya
through agriculture, and to spur agriculture back to growth trends.
Ministry of Agriculture,
Livestock and Fisheries
9 Agriculture Act
Promotes and maintains stable agriculture and provides for conservation of
soil and its fertility; aims to stimulate the development of agricultural land
in accordance with the accepted practices of good land management and
good husbandry
Ministry of Agriculture,
Livestock and Fisheries
10
Agriculture (Farm Forestry)
Rules 2009
Promotion and maintenance of farm forest cover of at least 10 per cent of
every agricultural land holding and preservation and sustenance of the
environment in combating climate change and global warming
Ministry of Agriculture,
Livestock and Fisheries
Energy
11
Draft National Energy Policy -
Third Draft
Aims to facilitate provision of clean, sustainable, affordable, reliable and
secure energy services at least cost, while protecting the environment.
Ministry of Energy and
Petroleum
12
Feed-in Tariffs for Renewable
Energy Resource Generated
Electricity- Guide for Investors
− Accelerates the development of green energy, including wind, solar and
renewable biomass.
− Instrument to promote generation of electricity from renewable energy
sources
Ministry of Energy and
Petroleum](https://image.slidesharecdn.com/kenyagreeneconomyassessment-141206103503-conversion-gate01/85/Kenyagreeneconomyassessment-20-320.jpg)
![2.4 Policy and legal landscape
The newly adopted Kenyan Constitution (2010) gives
rise to a devolved two-tier structure of government
and, hence, new and distinct governance structures
at the national and county levels. Article 42 of the
Constitution recognizes the right to a clean and
healthy environment, while Article 60 (c) provides
for sustainable and productive management of land
resources. It calls for “sustainable exploitation,
utilization, management and conservation of the
environment and natural resources” and works “…
to achieve and maintain a tree cover of at least 10
per cent of the land area of Kenya” (Article 69 [(a)-
(h)]).
In 2010, the government developed a comprehensive
National Climate Change Response Strategy (NCCRS),
which was followed by a National Climate Change
Action Plan (NCCAP) that sets out how the NCCRS
will be implemented. The NCCRS and NCCAP make
recommendations for reducing the negative impacts
of climate change.
By the end of 2012, other relevant policies
were being formulated, including the National
Environment Policy; Draft Carbon Investment Policy;
Reducing Emissions from Deforestation and Forest
16
Degradation (REDD) Policy; and the National Energy
Policy. Furthermore, policies and bills on oil and
mineral resources are being developed, following
the discovery of oil and mineral deposits in Kenya.
Numerous green economy-related sector-specific
planning documents exist (see Table 4). Kenyan
authorities are currently in the process of formulating
a Multilateral Environmental Agreement Strategy
(MEAS).
In addition to these legal and policy provisions,
numerous green economy-related programmes are
being undertaken by government ministries. These
include the Kenya National Cleaner Production
Centre and the GKI. Multilateral and bilateral
development agencies are also involved in supporting
numerous projects that address the challenge of
climate change and support the green economy
policy agenda, notably UNEP, UNDP, the Danish
International Development Agency (DANIDA), the
Canadian International Development Agency (CIDA),
the UK Department for International Development
(DfID), the Agence Française de Développement
(AFD), the US Agency for International Development
(USAID) and the World Bank. By January 2013,
Kenya had registered 11 projects under the Kyoto
Protocol’s Clean Development Mechanisms (CDM).16
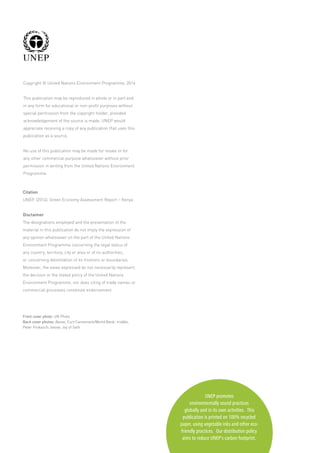
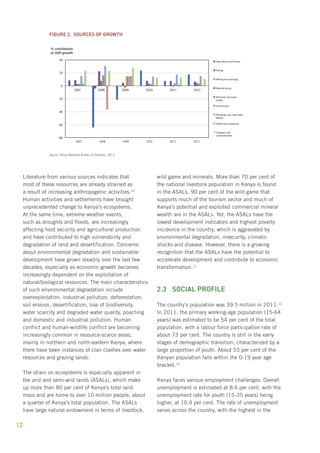
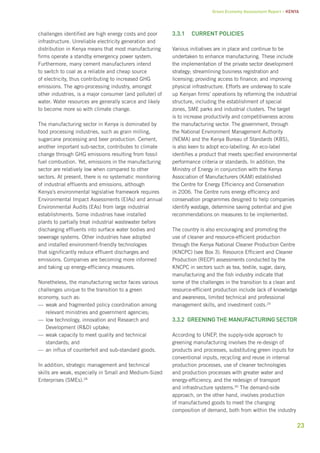
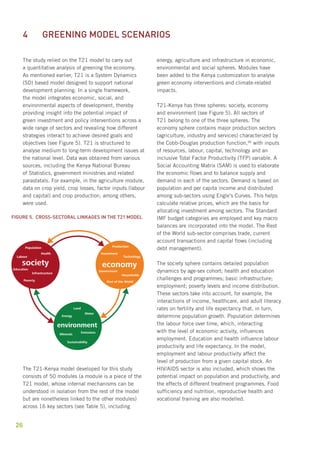
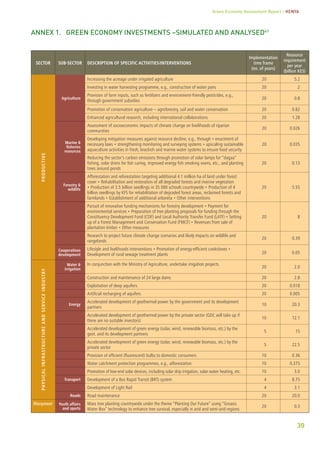
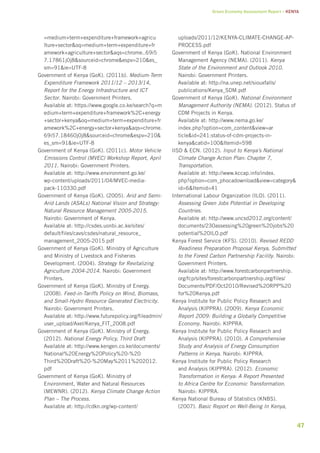
Mangroves in the Lamu Area/GRID Arendal/Peter Prokosch](https://image.slidesharecdn.com/kenyagreeneconomyassessment-141206103503-conversion-gate01/85/Kenyagreeneconomyassessment-22-320.jpg)


This document provides an assessment report on Kenya's transition to a green economy. It finds that Kenya has already taken steps toward greening its economy through policies supporting renewable energy, sustainable natural resource use, and green economy mainstreaming. Quantitative modeling of green investment scenarios in key sectors like agriculture, energy, manufacturing and transport show that in the short-term, GDP growth would not be substantially different than under a business-as-usual scenario. However, in the long-term, a green economy could yield 12% higher GDP by 2030 alongside a cleaner environment and higher productivity. Green investments could also lower energy use and carbon emissions compared to business-as-usual. The report concludes that Kenya's transition to a green economy has the


