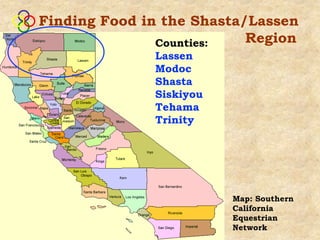
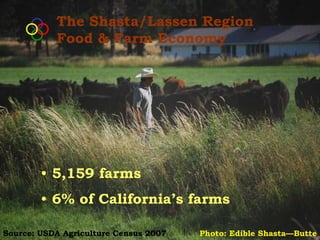
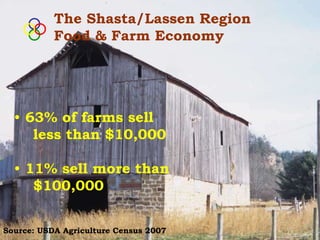
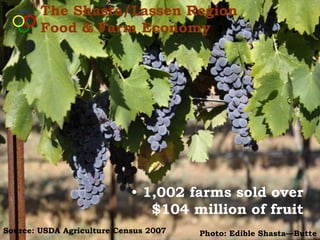
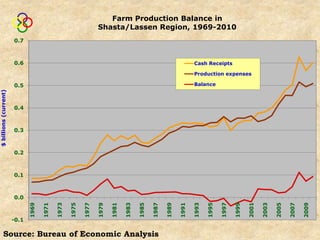
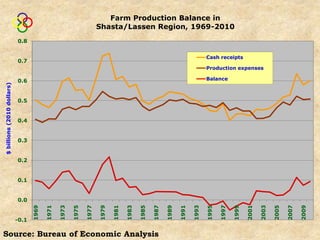
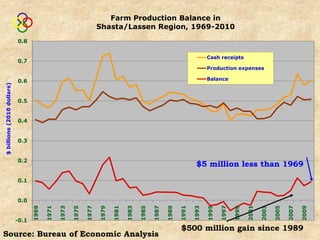
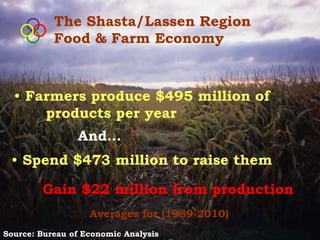
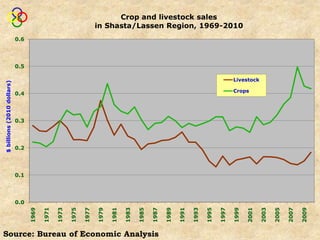
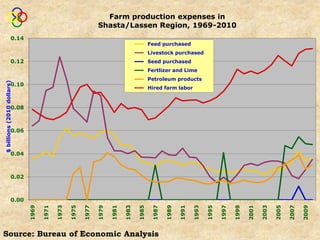
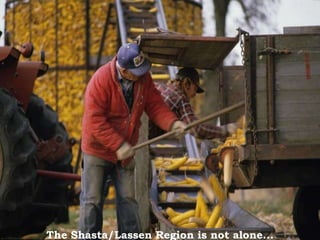
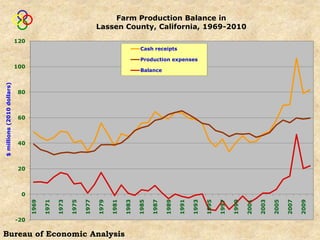
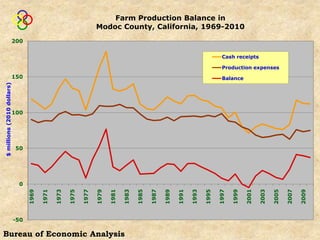
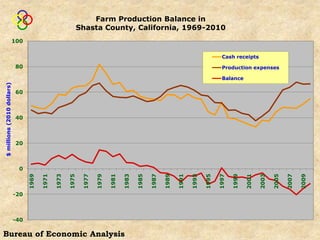
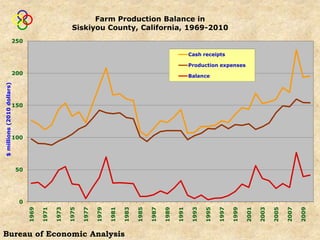
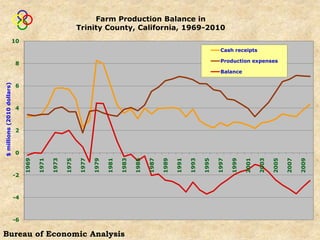
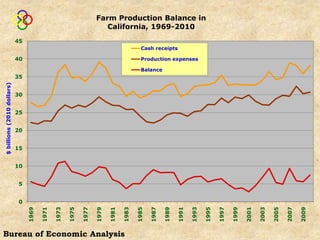
Photo: Edible Shasta-Butte
                                      The role of
                                      local food in
                                      economic
                                      recovery
                                      in the
                                      Shasta/Lassen
                                      region
                                      Ken Meter
                                      Crossroads
                                      Resource Center
                                      (Minneapolis)
                                      California Center for
                                      Cooperative Development
                                      Growing Local Coalition
                                      Redding and Anderson,
                                      California
Dan & Malinda Martin — Lazy 69 Farm   July 10, 2012
―Finding Food in Farm Country‖ Studies


plus Maui & Hawai’i


83 regions (incl. 10 states) in 30 states & one province
Vision for local food economies


Build:
    Health
    Wealth
    Connection
    Capacity
―Local‖ foods may be the best path
toward economic recovery in U.S.
―Local‖ is a shorthand....


Photo: DSC
Goal: to build
  Community-Based
  Food Systems


Photo: DSC
Business Clusters
                                         Kroger Athens

Athens Farmers’ Market


Farms                     Athens, Ohio

                                                 ACENet

Crumb’s Bakery
                                         Food processing
                                         businesses

             Casa Nueva
Dix/Hall Farm — Pomeroy, Ohio
Warren Taylor — Pomeroy, Ohio
Kroger Athens            13 Independent
                                              Stores in Ohio

22 Whole Foods


  Truckers                                     Jeni’s Splendid Ice
                                               Creams
                         Snowville Creamery


                                                 Local labor
Equipment
suppliers
             Utilities                 Dix/Hall farm

     Packaging material                Hamm farm
     suppliers
Snowville at Paw Paw Fest
Business Clusters


                          Jeni’s Splendid
                            Ice Creams


―Our growth is based on Snowville’s growth....
We are always in communication with each other.‖
                                             – Jeni Britton Bauer
Snowville at Paw Paw Fest
green energy

                      electricity, fuel, wate
                                 r
    Strawberries
     Raspberries                                   nanofiltered
     Blueberries                                    skim milk
        Peaches
           Pears
        Apricots        Jeni’s Splendid         Milk:
     Sweet Corn           Ice Creams            Snowville Creamery
           Basil
          Honey
            etc:

    from various
      Ohio farms
                        Local Employees


Process own flavors       Employees
     in season             buy local
Next steps


New collaboration:

• Snowville Creamery
  brings produce & milk to Columbus


• Columbus Food Bank
  stores these foods at warehouse


• The Greener Grocer
  sells these foods in retail store
Next steps


This is viewed as a step toward
    delivering fresh food to
    low-income consumers
Finding Food in the Shasta/Lassen
               Counties:   Region
              Lassen
              Modoc
              Shasta
              Siskiyou
              Tehama
              Trinity


                         Map: Southern
                         California
                         Equestrian
                         Network
The Shasta/Lassen Region


          • 344,116 residents
         • Receive $11 billion
          of income each year
Personal income in Shasta Region, 2001 - 2010
                    4.0


                    3.5


                    3.0
$ billions (2010)


                    2.5                                                             Manufacturing

                                                                                    Retail

                                                                                    Professional / scientific
                    2.0
                                                                                    Health care & social assistance

                                                                                    Government
                    1.5
                                                                                    Finance & Insurance

                                                                                    Interest, dividend, rent
                    1.0
                                                                                    Transfer payments


                    0.5


                     -
                          2001 2002 2003 2004 2005 2006 2007 2008 2009 2010
households


                                       -
                                           2,000
                                                   4,000
                                                           6,000
                                                                      8,000
                                                                                10,000
                                                                                         12,000
                                                                                                   14,000
                                                                                                             16,000

                           Less than
                           $10,000

                          $10,000 to
                           $14,999

                          $15,000 to
                           $19,999


Source: Federal Census
                          $20,000 to
                           $24,999

                          $25,000 to
                           $29,999

                          $30,000 to
                           $34,999

                          $35,000 to
                           $39,999

                          $40,000 to
                           $44,999
                                                                                             (29%) below
                                                                                           100,000 people

                                                                                           185% of poverty


                          $45,000 to
                           $49,999

                          $50,000 to
                           $59,999

                          $60,000 to
                                                                                                                      Household income in Shasta Region, 2006-2010


                           $74,999

                          $75,000 to
                           $99,999

                         $100,000 to
                          $124,999

                         $125,000 to
                          $149,999

                         $150,000 to
                          $199,999

                         $200,000 or
                           more
The Shasta/Lassen Region
           Food & Farm Economy


        • 5,159 farms
        • 6% of California’s farms

Source: USDA Agriculture Census 2007   Photo: Edible Shasta—Butte
The Shasta/Lassen Region
           Food & Farm Economy


  • 63% of farms sell
     less than $10,000

  • 11% sell more than
     $100,000


Source: USDA Agriculture Census 2007
The
  Shasta/Lassen
  Region
  Food & Farm
  Economy

54% of farms
are less than
50 acres


                 Photo:
    Edible Shasta—Butte
The Shasta/Lassen Region
Food & Farm Economy


 Cattle & Calves             $105
 Fruits, nuts & berries**     104
 Forage (hay, etc.)**          58
 Ornamentals**                 49
 Vegetables**                  32
 Milk                          14
 Wheat**                       11


        ** incomplete data
Photo: Edible Shasta—Butte
the Shasta/Lassen Region
   Food & Farm Economy

• 156 vegetable farms


• over $32 million sales


                  Source: USDA Agriculture Census 2007
The Shasta/Lassen Region
        Food & Farm Economy


                            • 1,002 farms sold over
                               $104 million of fruit
Source: USDA Agriculture Census 2007   Photo: Edible Shasta—Butte
614 farms sell
                        direct to consumers
                                $2.2 million
                                      in sales
                            34% rise in farms
                              9% rise in sales
                                     2002 - 2007


Source: Census of Agriculture 2007    Photo: Edible Shasta—Butte
the Shasta/Lassen Region
   Food & Farm Economy


• 97 farms sell organic products

• $13 million in sales


                         Photo: Edible Shasta—Butte
Photo: Edible Shasta—Butte
Farm Production Balance in
                                                                 Shasta/Lassen Region, 1969-2010
                       0.7


                       0.6                                                                                        Cash Receipts

                                                                                                                  Production expenses

                       0.5                                                                                        Balance
$ billions (current)


                       0.4


                       0.3


                       0.2


                       0.1


                       0.0
                              1969

                                     1971

                                            1973

                                                   1975

                                                          1977

                                                                 1979

                                                                        1981

                                                                               1983

                                                                                      1985

                                                                                             1987

                                                                                                    1989

                                                                                                           1991

                                                                                                                  1993

                                                                                                                         1995

                                                                                                                                1997

                                                                                                                                       1999

                                                                                                                                              2001

                                                                                                                                                     2003

                                                                                                                                                            2005

                                                                                                                                                                   2007

                                                                                                                                                                          2009
                       -0.1

          Source: Bureau of Economic Analysis
Farm Production Balance in
                                                                      Shasta/Lassen Region, 1969-2010
                            0.8


                                                                                                                              Cash receipts
                            0.7
                                                                                                                              Production expenses

                            0.6                                                                                               Balance
$ billions (2010 dollars)


                            0.5


                            0.4


                            0.3


                            0.2


                            0.1


                            0.0
                                                               1977
                                   1969

                                          1971

                                                 1973

                                                        1975


                                                                      1979

                                                                             1981

                                                                                    1983

                                                                                           1985

                                                                                                  1987

                                                                                                         1989

                                                                                                                1991

                                                                                                                       1993

                                                                                                                              1995

                                                                                                                                     1997

                                                                                                                                            1999

                                                                                                                                                   2001

                                                                                                                                                          2003

                                                                                                                                                                 2005

                                                                                                                                                                        2007

                                                                                                                                                                               2009
                            -0.1

Source: Bureau of Economic Analysis
Farm Production Balance in
                                                                      Shasta/Lassen Region, 1969-2010
                            0.8


                                                                                                                              Cash receipts
                            0.7
                                                                                                                              Production expenses

                            0.6                                                                                               Balance
$ billions (2010 dollars)


                            0.5


                            0.4


                            0.3


                            0.2
                                                                                                                        $5 million less than 1969
                            0.1


                            0.0
                                   1969

                                          1971

                                                 1973

                                                        1975

                                                               1977

                                                                      1979

                                                                             1981

                                                                                    1983

                                                                                           1985

                                                                                                  1987

                                                                                                         1989

                                                                                                                1991

                                                                                                                       1993

                                                                                                                              1995

                                                                                                                                     1997

                                                                                                                                            1999

                                                                                                                                                   2001

                                                                                                                                                          2003

                                                                                                                                                                 2005

                                                                                                                                                                        2007

                                                                                                                                                                               2009
                            -0.1
                                                                                                                $500 million gain since 1989
Source: Bureau of Economic Analysis
The Shasta/Lassen Region
           Food & Farm Economy


  • Farmers produce $495 million of
      products per year
                And…
 • Spend $473 million to raise them

        Gain $22 million from production
                   Averages for (1989-2010)
Source: Bureau of Economic Analysis
The Shasta/Lassen Region
           Food & Farm Economy


            Plus…

   • Farm families earn $35 million of
       other farm-related income

   • And receive $13 million in federal
       supports each year

Source: Bureau of Economic Analysis
Shasta/Lassen Region
                                                                 farm income by type, 1969-2010
                            0.25


                            0.20


                                                                                                                              Government Payments
$ billions (2010 dollars)


                            0.15                                                                                              Other Farm-Related Income

                                                                                                                              Farm Production Balance

                            0.10


                            0.05


                            0.00
                                   1969

                                          1971

                                                 1973

                                                        1975

                                                               1977

                                                                      1979

                                                                             1981

                                                                                    1983

                                                                                           1985

                                                                                                  1987

                                                                                                         1989

                                                                                                                1991

                                                                                                                       1993

                                                                                                                               1995

                                                                                                                                      1997

                                                                                                                                             1999

                                                                                                                                                    2001

                                                                                                                                                           2003

                                                                                                                                                                  2005

                                                                                                                                                                         2007

                                                                                                                                                                                2009
                      -0.05


                      -0.10

Source: Bureau of Economic Analysis
Photo: Edible Shasta—Butte
Crop and livestock sales
                                                                     in Shasta/Lassen Region, 1969-2010
                            0.6


                            0.5

                                                                                                                                           Livestock
$ billions (2010 dollars)


                                                                                                                                           Crops
                            0.4


                            0.3


                            0.2


                            0.1


                            0.0
                                                                                                 1987


                                                                                                                                                  2001
                                  1969

                                         1971

                                                1973

                                                       1975

                                                              1977

                                                                     1979

                                                                            1981

                                                                                   1983

                                                                                          1985


                                                                                                        1989

                                                                                                               1991

                                                                                                                      1993

                                                                                                                             1995

                                                                                                                                    1997

                                                                                                                                           1999


                                                                                                                                                         2003

                                                                                                                                                                2005

                                                                                                                                                                       2007

                                                                                                                                                                              2009
Source: Bureau of Economic Analysis
33% of all farms
reported net
losses in 2007
Farm production expenses in
                                                               Shasta/Lassen Region, 1969-2010
                     0.14
                                                                                           Feed purchased
                                                                                           Livestock purchased
                     0.12                                                                  Seed purchased
                                                                                           Fertlizer and Lime
                                                                                           Petroleum products
$ billions (2010 dollars)


                     0.10
                                                                                           Hired farm labor


                     0.08


                     0.06


                     0.04


                     0.02


                     0.00
                                                                      1981


                                                                                                                                                                  2007
                            1969

                                   1971

                                          1973

                                                 1975

                                                        1977

                                                               1979


                                                                             1983

                                                                                    1985

                                                                                            1987

                                                                                                   1989

                                                                                                          1991

                                                                                                                 1993

                                                                                                                        1995

                                                                                                                               1997

                                                                                                                                      1999

                                                                                                                                             2001

                                                                                                                                                    2003

                                                                                                                                                           2005


                                                                                                                                                                         2009
Source: Bureau of Economic Analysis
$235 million of these farm inputs
        are sourced outside the region


Source: Ken Meter using data from Agriculture Census 2007
Using local inputs
              would reduce these losses
Compost at Pleasantview Farm (Circleville)
Also a region of food consumers...
Finding Food in Farm Country
         As farmers struggle...


                 • Consumers buy $912 million
                             of food each year


           • $800 million from outside region

Source: Ken Meter using Bureau of Labor Statistics
Finding Food in the
         Shasta/Lassen Region
       Markets for food eaten at home

                                           millions
       Meats, poultry, fish, and eggs      $ 116
       Fruits & vegetables                     98
       Cereals and bakery products             68
       Dairy products                          57
       ―Other,‖ incl. sweets, fats, & oils   193


Source: Census & BLS
All told, the Shasta/Lassen Region

• Gains $22 million in production

• Loses $235 million buying inputs

• Loses $800 million buying food


   Potential wealth lost each year
Finding Food in Farm Country


             Total loss is:


• $1 billion each year!
• more than double the value of all
    food products raised in region
The good news is...
                      Photo: Edible Shasta—Butte
Farm Production Balance in
                                                             Current farm income compared to
                                                        the Shasta/Lassen Region, 1969-2010 market
                                                             Shasta/Lassen Region consumer
                            0.8
                                                                                                                  consumer market
                                                                                                                              Cash receipts
                            0.7
                                                                                                                              Production expenses

                            0.6                                                                                               Balance
$ billions (2010 dollars)


                            0.5


                            0.4


                            0.3


                            0.2


                            0.1


                            0.0
                                                               1977
                                   1969

                                          1971

                                                 1973

                                                        1975


                                                                      1979

                                                                             1981

                                                                                    1983

                                                                                           1985

                                                                                                  1987

                                                                                                         1989

                                                                                                                1991

                                                                                                                       1993

                                                                                                                              1995

                                                                                                                                     1997

                                                                                                                                            1999

                                                                                                                                                   2001

                                                                                                                                                          2003

                                                                                                                                                                 2005

                                                                                                                                                                        2007

                                                                                                                                                                               2009
                            -0.1

Source: BEA and BLS
The Shasta/Lassen Region

If region’s consumers bought $5 of
their food directly from local farms
each week...


       …farms would earn $89 million
                of new farm income
The Shasta/Lassen Region is not alone...
Data from each
         county in the
        Shasta/Lassen
            Region


Photos: Edible Shasta—Butte
Farm Production Balance in
                                                                     Lassen County, California, 1969-2010
                            120
                                                                                           Cash receipts

                                                                                           Production expenses
                            100
                                                                                           Balance
$ millions (2010 dollars)


                             80


                             60


                             40


                             20


                              0


                                                                                                                                                         2003
                                  1969

                                         1971

                                                1973

                                                       1975

                                                              1977

                                                                     1979

                                                                            1981

                                                                                   1983

                                                                                          1985

                                                                                                 1987

                                                                                                        1989

                                                                                                               1991

                                                                                                                      1993

                                                                                                                             1995

                                                                                                                                    1997

                                                                                                                                           1999

                                                                                                                                                  2001


                                                                                                                                                                2005

                                                                                                                                                                       2007

                                                                                                                                                                              2009
                            -20

Bureau of Economic Analysis
Farm Production Balance in
                                                                     Modoc County, California, 1969-2010
                            200

                                                                                                                                      Cash receipts

                                                                                                                                      Production expenses
                            150                                                                                                       Balance
$ millions (2010 dollars)


                            100


                             50


                             0

                                                                                                                      1993
                                  1969

                                         1971

                                                1973

                                                       1975

                                                              1977

                                                                     1979

                                                                            1981

                                                                                   1983

                                                                                          1985

                                                                                                 1987

                                                                                                        1989

                                                                                                               1991


                                                                                                                             1995

                                                                                                                                    1997

                                                                                                                                           1999

                                                                                                                                                  2001

                                                                                                                                                         2003

                                                                                                                                                                2005

                                                                                                                                                                       2007

                                                                                                                                                                              2009
                            -50

Bureau of Economic Analysis
Farm Production Balance in
                                                              Shasta County, California, 1969-2010
                            100

                                                                                                                                       Cash receipts

                             80                                                                                                        Production expenses

                                                                                                                                       Balance
$ millions (2010 dollars)


                             60


                             40


                             20


                             0


                                                                                                                       1993
                                  1969

                                         1971

                                                1973

                                                       1975

                                                               1977

                                                                      1979

                                                                             1981

                                                                                    1983

                                                                                           1985

                                                                                                  1987

                                                                                                         1989

                                                                                                                1991


                                                                                                                              1995

                                                                                                                                     1997

                                                                                                                                            1999

                                                                                                                                                   2001

                                                                                                                                                          2003

                                                                                                                                                                 2005

                                                                                                                                                                        2007

                                                                                                                                                                               2009
                            -20


                            -40

Bureau of Economic Analysis
Farm Production Balance in
                                                        Siskiyou County, California, 1969-2010
                            250

                                                                                                                      Cash receipts

                                                                                                                      Production expenses
                            200                                                                                       Balance
$ millions (2010 dollars)


                            150


                            100


                             50


                             0
                                                                                                                       1993
                                  1969

                                         1971

                                                1973

                                                       1975

                                                              1977

                                                                     1979

                                                                            1981

                                                                                   1983

                                                                                          1985

                                                                                                 1987

                                                                                                        1989

                                                                                                               1991


                                                                                                                              1995

                                                                                                                                     1997

                                                                                                                                            1999

                                                                                                                                                   2001

                                                                                                                                                          2003

                                                                                                                                                                 2005

                                                                                                                                                                        2007

                                                                                                                                                                               2009
Bureau of Economic Analysis
Farm Production Balance in
                                                        Tehama County, California, 1969-2010
                            250

                                                                                                                                Cash receipts

                                                                                                                                Production expenses
                            200
                                                                                                                                Balance
$ millions (2010 dollars)


                            150


                            100


                             50


                              0                                                                          1989
                                   1969

                                          1971

                                                 1973

                                                        1975

                                                               1977

                                                                      1979

                                                                             1981

                                                                                    1983

                                                                                           1985

                                                                                                  1987


                                                                                                                1991

                                                                                                                       1993

                                                                                                                              1995

                                                                                                                                     1997

                                                                                                                                            1999

                                                                                                                                                   2001

                                                                                                                                                          2003

                                                                                                                                                                 2005

                                                                                                                                                                        2007

                                                                                                                                                                               2009
                             -50


                            -100

Bureau of Economic Analysis
Farm Production Balance in
                                                             Trinity County, California, 1969-2010
                            10
                                                                                                                                     Cash receipts

                                                                                                                                     Production expenses
                            8
                                                                                                                                     Balance

                            6
$ millions (2010 dollars)


                            4


                            2


                            0


                                                                                                                            1995


                                                                                                                                                               2005
                                 1969

                                        1971

                                               1973

                                                      1975

                                                             1977

                                                                    1979

                                                                           1981

                                                                                  1983

                                                                                         1985

                                                                                                1987

                                                                                                       1989

                                                                                                              1991

                                                                                                                     1993


                                                                                                                                   1997

                                                                                                                                          1999

                                                                                                                                                 2001

                                                                                                                                                        2003


                                                                                                                                                                      2007

                                                                                                                                                                             2009
                            -2


                            -4


                            -6

Bureau of Economic Analysis
State of California


Source: USDA Agriculture Census 2007
Top Farm Products in California
                     Top Farm Products in California, 2010


                                        Grapes
                                         10%     Almonds
                                                                    Cattle & Calves
                                                   9%
                        Ornamentals                                       7%
                           12%


                                                           Strawberries
                                                               6%
                Dairy                                            Lettuce
                19%                                                5%


                                      Other                               Tomatoes
                                      18%                                   4%
                                                                 Pistachios
                                                             Walnuts 4%
                                                      Rice     3%
                                                      3%


Economic Research Service (2010)
Farm Production Balance in
                                                                       California, 1969-2010
                            45
                                                                                           Cash receipts

                            40                                                             Production expenses

                                                                                           Balance
                            35
$ billions (2010 dollars)


                            30


                            25


                            20


                            15


                            10


                            5


                            0


                                                                                                                                                 2001
                                 1969

                                        1971

                                               1973

                                                      1975

                                                             1977

                                                                    1979

                                                                           1981

                                                                                  1983

                                                                                         1985

                                                                                                1987

                                                                                                       1989

                                                                                                              1991

                                                                                                                     1993

                                                                                                                            1995

                                                                                                                                   1997

                                                                                                                                          1999


                                                                                                                                                        2003

                                                                                                                                                               2005

                                                                                                                                                                      2007

                                                                                                                                                                             2009
Bureau of Economic Analysis
U.S. data
Farm production balance for U.S. farms, 1929 -2011
                               400


                               350
                                                    U.S. Data
                                                                                                                                          Cash receipts
                               300
                                                                                                                                          Production expenses
                                                                                                                                          Farm Production Balance
$ billions (current dollars)


                               250


                               200


                               150


                               100


                               50


                                0
                                     1929

                                            1932

                                                   1935

                                                          1938

                                                                 1941

                                                                        1944

                                                                               1947

                                                                                      1950

                                                                                             1953

                                                                                                    1956

                                                                                                           1959

                                                                                                                  1962

                                                                                                                         1965

                                                                                                                                1968

                                                                                                                                       1971

                                                                                                                                              1974

                                                                                                                                                     1977

                                                                                                                                                            1980

                                                                                                                                                                   1983

                                                                                                                                                                          1986

                                                                                                                                                                                 1989

                                                                                                                                                                                        1992

                                                                                                                                                                                               1995

                                                                                                                                                                                                      1998

                                                                                                                                                                                                             2001

                                                                                                                                                                                                                    2004

                                                                                                                                                                                                                           2007

                                                                                                                                                                                                                                  2010
                               -50


USDA / Economic Research Service
Farm Production Balance for U.S. farms, 1929 - 2011

                            500


                            450

                                                 U.S. Data
                            400


                            350
$ billions (2011 dollars)


                            300


                            250


                            200

                                                                                                                                                                               Cash receipts
                            150
                                                                                                                                                                               Production expenses
                                                                                                                                                                               Farm Production Balance

                            100


                            50


                             0
                                  1929

                                         1932
                                                1935
                                                       1938

                                                              1941
                                                                     1944

                                                                            1947

                                                                                   1950
                                                                                          1953

                                                                                                 1956

                                                                                                        1959

                                                                                                               1962

                                                                                                                      1965
                                                                                                                             1968

                                                                                                                                    1971
                                                                                                                                           1974

                                                                                                                                                  1977

                                                                                                                                                         1980
                                                                                                                                                                1983
                                                                                                                                                                       1986

                                                                                                                                                                              1989
                                                                                                                                                                                     1992

                                                                                                                                                                                            1995
                                                                                                                                                                                                   1998

                                                                                                                                                                                                          2001
                                                                                                                                                                                                                 2004
                                                                                                                                                                                                                        2007

                                                                                                                                                                                                                               2010
                            -50
USDA / Economic Research Service
$ billions (2011)


                                   0
                                       5
                                           10
                                                         15
                                                               20
                                                                            25
                      1949

                      1951

                      1953

                      1955

                      1957

                      1959

                      1961

                      1963
                                                                U.S. Data


                      1965

                      1967

                      1969

                      1971

                      1973


USDA / Economic Research Service
                      1975

                      1977

                      1979

                      1981

                      1983

                      1985

                      1987

                      1989

                      1991

                      1993

                      1995

                      1997

                      1999
                                                                                 Value of food reserved by U.S. farmers for home consumption, 1949 - 2009


                      2001

                      2003

                      2005

                      2007

                      2009
Sugar and Corn Sweetener Use in U.S., 1966 - 2008
                    160


                    140

                                                                                                                                          Sugar
                    120
                                                                                                                                          HFCS
pounds per person


                                                                                                                                          Glucose
                    100
                                                                                                                                          Dextrose

                    80                                                                                                                    All sweeteners


                    60


                    40


                    20


                     0
                          1966

                                 1968

                                        1970

                                               1972

                                                      1974

                                                             1976

                                                                    1978

                                                                           1980

                                                                                  1982

                                                                                         1984

                                                                                                1986

                                                                                                       1988

                                                                                                              1990

                                                                                                                     1992

                                                                                                                            1994

                                                                                                                                   1996

                                                                                                                                          1998

                                                                                                                                                 2000

                                                                                                                                                        2002

                                                                                                                                                               2004

                                                                                                                                                                      2006

                                                                                                                                                                             2008
USDA / Economic Research Service
U.S. Youth Who are Overweight
                   Percent by Age
Percent
   16
                                                            14.0%
  14

  12                                           10.7%         13%
  10
                                                 10.7%
   8

   6      4.6%
   4
          4.1%
   2

   0
          1963-70    1971-74      1976-80      1988-94        1999
                    Ages 6-11       Ages 12-17
 >95th percentile for BMI by age and sex, based on NHANES I reference data
  Source: Troiano RP, Flegal KM. Pediatrics 1998;101(3):497-504. NHANES
 1999, National Center for Health Statistics. Chart by Melinda Hemmelgarn
Consumption out of balance


   •   50% of U.S. public school students
         qualify for free / reduced lunch
   •   10% of households are ―food
         insecure‖
Source: USDA                   Mural: The Food Project
3,000 deaths
            from foodborne
          illness each year

Medical costs: $152 billion
Health suffers

   Medical costs of obesity are $174
      billion per year —


Source: CDC/Walters, Harvard Public Health/Colditz
Growing Power, Milwaukee
Direct Food Sales
Census of Agriculture
Organic Sales
Organic Valley
$ millions


       -
           100
                 200
                       300
                                400
                                          500
                                                600
                                                      700
                                                                                 800
1988

1989

1990

1991

1992

1993

1994

1995

1996

1997

1998

1999

2000

2001

2002

2003

2004
                                                                                       Organic Valley sales, 1988 - 2011


2005

2006

2007

2008

2009

2010
                                                            $716 million sales


2011
Black Hawk region, Iowa
UNI Local Food Project


           1998
       3 institutions
 buy $111,000 of local foods

            2009
      26 buy $2,600,000
Local Food Expenditures
                by the participating institutions in the
     Black Hawk County Area, Iowa 1998-2009


Northern Iowa Food & Farm Partnership
Jobs, Fruit & Veggies, and
        Black Hawk County region

If Black Hawk region residents
  purchased locally grown fruits
  and vegetables just 3 months out
  of the year:
• 475 new jobs
• $6.3 million in labor income
   added to local economy

David Swenson, ISU Economist
Will Allen, Growing Power, Milwaukee
Growing Power, Milwaukee
Greensgrow Gardens, Philadelphia
Pete Scherf — Michigan City, Indiana
Viroqua, Wisconsin
Viroqua, Wisconsin


• Economic Development
    Association buys building

• 100,000 square feet

• Regional food processing center
Viroqua Business Cluster


        Produce
      Distributor 1

                        Produce
                      Distributor 2

     Processors
                        TBD


     Bakery &
    Public Space
                        Nonprofits
Viroqua Business Cluster

                                           Hospital
             Produce
           Distributor 1
Root
cellar                       Produce
                           Distributor 2

Food      Processors                       Organic
                             TBD            Valley
co-op


Schools    Bakery &
          Public Space                      Amish
                             Nonprofits
                                           farmers
Viroqua, Wisconsin
U.S. Federal Policy


   Invest in communities

     rather than cash for
         commodities
Vision for local food economies


Build:
    Health
    Wealth
    Connection
    Capacity
―Finding Food in Farm Country‖


         www.crcworks.org
          (612) 869-8664


        kmeter@crcworks.org

Ken meter cashasta12.1

  • 1.
    Photo: Edible Shasta-Butte The role of local food in economic recovery in the Shasta/Lassen region Ken Meter Crossroads Resource Center (Minneapolis) California Center for Cooperative Development Growing Local Coalition Redding and Anderson, California Dan & Malinda Martin — Lazy 69 Farm July 10, 2012
  • 2.
    ―Finding Food inFarm Country‖ Studies plus Maui & Hawai’i 83 regions (incl. 10 states) in 30 states & one province
  • 3.
    Vision for localfood economies Build: Health Wealth Connection Capacity
  • 4.
    ―Local‖ foods maybe the best path toward economic recovery in U.S.
  • 5.
    ―Local‖ is ashorthand.... Photo: DSC
  • 6.
    Goal: to build Community-Based Food Systems Photo: DSC
  • 7.
    Business Clusters Kroger Athens Athens Farmers’ Market Farms Athens, Ohio ACENet Crumb’s Bakery Food processing businesses Casa Nueva
  • 8.
    Dix/Hall Farm —Pomeroy, Ohio
  • 9.
    Warren Taylor —Pomeroy, Ohio
  • 10.
    Kroger Athens 13 Independent Stores in Ohio 22 Whole Foods Truckers Jeni’s Splendid Ice Creams Snowville Creamery Local labor Equipment suppliers Utilities Dix/Hall farm Packaging material Hamm farm suppliers
  • 11.
  • 12.
    Business Clusters Jeni’s Splendid Ice Creams ―Our growth is based on Snowville’s growth.... We are always in communication with each other.‖ – Jeni Britton Bauer
  • 13.
  • 14.
    green energy electricity, fuel, wate r Strawberries Raspberries nanofiltered Blueberries skim milk Peaches Pears Apricots Jeni’s Splendid Milk: Sweet Corn Ice Creams Snowville Creamery Basil Honey etc: from various Ohio farms Local Employees Process own flavors Employees in season buy local
  • 15.
    Next steps New collaboration: •Snowville Creamery brings produce & milk to Columbus • Columbus Food Bank stores these foods at warehouse • The Greener Grocer sells these foods in retail store
  • 16.
    Next steps This isviewed as a step toward delivering fresh food to low-income consumers
  • 18.
    Finding Food inthe Shasta/Lassen Counties: Region Lassen Modoc Shasta Siskiyou Tehama Trinity Map: Southern California Equestrian Network
  • 19.
    The Shasta/Lassen Region • 344,116 residents • Receive $11 billion of income each year
  • 20.
    Personal income inShasta Region, 2001 - 2010 4.0 3.5 3.0 $ billions (2010) 2.5 Manufacturing Retail Professional / scientific 2.0 Health care & social assistance Government 1.5 Finance & Insurance Interest, dividend, rent 1.0 Transfer payments 0.5 - 2001 2002 2003 2004 2005 2006 2007 2008 2009 2010
  • 21.
    households - 2,000 4,000 6,000 8,000 10,000 12,000 14,000 16,000 Less than $10,000 $10,000 to $14,999 $15,000 to $19,999 Source: Federal Census $20,000 to $24,999 $25,000 to $29,999 $30,000 to $34,999 $35,000 to $39,999 $40,000 to $44,999 (29%) below 100,000 people 185% of poverty $45,000 to $49,999 $50,000 to $59,999 $60,000 to Household income in Shasta Region, 2006-2010 $74,999 $75,000 to $99,999 $100,000 to $124,999 $125,000 to $149,999 $150,000 to $199,999 $200,000 or more
  • 22.
    The Shasta/Lassen Region Food & Farm Economy • 5,159 farms • 6% of California’s farms Source: USDA Agriculture Census 2007 Photo: Edible Shasta—Butte
  • 23.
    The Shasta/Lassen Region Food & Farm Economy • 63% of farms sell less than $10,000 • 11% sell more than $100,000 Source: USDA Agriculture Census 2007
  • 24.
    The Shasta/Lassen Region Food & Farm Economy 54% of farms are less than 50 acres Photo: Edible Shasta—Butte
  • 25.
    The Shasta/Lassen Region Food& Farm Economy Cattle & Calves $105 Fruits, nuts & berries** 104 Forage (hay, etc.)** 58 Ornamentals** 49 Vegetables** 32 Milk 14 Wheat** 11 ** incomplete data
  • 26.
  • 27.
    the Shasta/Lassen Region Food & Farm Economy • 156 vegetable farms • over $32 million sales Source: USDA Agriculture Census 2007
  • 28.
    The Shasta/Lassen Region Food & Farm Economy • 1,002 farms sold over $104 million of fruit Source: USDA Agriculture Census 2007 Photo: Edible Shasta—Butte
  • 29.
    614 farms sell direct to consumers $2.2 million in sales 34% rise in farms 9% rise in sales 2002 - 2007 Source: Census of Agriculture 2007 Photo: Edible Shasta—Butte
  • 30.
    the Shasta/Lassen Region Food & Farm Economy • 97 farms sell organic products • $13 million in sales Photo: Edible Shasta—Butte
  • 31.
  • 32.
    Farm Production Balancein Shasta/Lassen Region, 1969-2010 0.7 0.6 Cash Receipts Production expenses 0.5 Balance $ billions (current) 0.4 0.3 0.2 0.1 0.0 1969 1971 1973 1975 1977 1979 1981 1983 1985 1987 1989 1991 1993 1995 1997 1999 2001 2003 2005 2007 2009 -0.1 Source: Bureau of Economic Analysis
  • 33.
    Farm Production Balancein Shasta/Lassen Region, 1969-2010 0.8 Cash receipts 0.7 Production expenses 0.6 Balance $ billions (2010 dollars) 0.5 0.4 0.3 0.2 0.1 0.0 1977 1969 1971 1973 1975 1979 1981 1983 1985 1987 1989 1991 1993 1995 1997 1999 2001 2003 2005 2007 2009 -0.1 Source: Bureau of Economic Analysis
  • 34.
    Farm Production Balancein Shasta/Lassen Region, 1969-2010 0.8 Cash receipts 0.7 Production expenses 0.6 Balance $ billions (2010 dollars) 0.5 0.4 0.3 0.2 $5 million less than 1969 0.1 0.0 1969 1971 1973 1975 1977 1979 1981 1983 1985 1987 1989 1991 1993 1995 1997 1999 2001 2003 2005 2007 2009 -0.1 $500 million gain since 1989 Source: Bureau of Economic Analysis
  • 35.
    The Shasta/Lassen Region Food & Farm Economy • Farmers produce $495 million of products per year And… • Spend $473 million to raise them Gain $22 million from production Averages for (1989-2010) Source: Bureau of Economic Analysis
  • 36.
    The Shasta/Lassen Region Food & Farm Economy Plus… • Farm families earn $35 million of other farm-related income • And receive $13 million in federal supports each year Source: Bureau of Economic Analysis
  • 37.
    Shasta/Lassen Region farm income by type, 1969-2010 0.25 0.20 Government Payments $ billions (2010 dollars) 0.15 Other Farm-Related Income Farm Production Balance 0.10 0.05 0.00 1969 1971 1973 1975 1977 1979 1981 1983 1985 1987 1989 1991 1993 1995 1997 1999 2001 2003 2005 2007 2009 -0.05 -0.10 Source: Bureau of Economic Analysis
  • 38.
  • 39.
    Crop and livestocksales in Shasta/Lassen Region, 1969-2010 0.6 0.5 Livestock $ billions (2010 dollars) Crops 0.4 0.3 0.2 0.1 0.0 1987 2001 1969 1971 1973 1975 1977 1979 1981 1983 1985 1989 1991 1993 1995 1997 1999 2003 2005 2007 2009 Source: Bureau of Economic Analysis
  • 40.
    33% of allfarms reported net losses in 2007
  • 41.
    Farm production expensesin Shasta/Lassen Region, 1969-2010 0.14 Feed purchased Livestock purchased 0.12 Seed purchased Fertlizer and Lime Petroleum products $ billions (2010 dollars) 0.10 Hired farm labor 0.08 0.06 0.04 0.02 0.00 1981 2007 1969 1971 1973 1975 1977 1979 1983 1985 1987 1989 1991 1993 1995 1997 1999 2001 2003 2005 2009 Source: Bureau of Economic Analysis
  • 42.
    $235 million ofthese farm inputs are sourced outside the region Source: Ken Meter using data from Agriculture Census 2007
  • 43.
    Using local inputs would reduce these losses Compost at Pleasantview Farm (Circleville)
  • 44.
    Also a regionof food consumers...
  • 45.
    Finding Food inFarm Country As farmers struggle... • Consumers buy $912 million of food each year • $800 million from outside region Source: Ken Meter using Bureau of Labor Statistics
  • 46.
    Finding Food inthe Shasta/Lassen Region Markets for food eaten at home millions Meats, poultry, fish, and eggs $ 116 Fruits & vegetables 98 Cereals and bakery products 68 Dairy products 57 ―Other,‖ incl. sweets, fats, & oils 193 Source: Census & BLS
  • 47.
    All told, theShasta/Lassen Region • Gains $22 million in production • Loses $235 million buying inputs • Loses $800 million buying food Potential wealth lost each year
  • 48.
    Finding Food inFarm Country Total loss is: • $1 billion each year! • more than double the value of all food products raised in region
  • 49.
    The good newsis... Photo: Edible Shasta—Butte
  • 50.
    Farm Production Balancein Current farm income compared to the Shasta/Lassen Region, 1969-2010 market Shasta/Lassen Region consumer 0.8 consumer market Cash receipts 0.7 Production expenses 0.6 Balance $ billions (2010 dollars) 0.5 0.4 0.3 0.2 0.1 0.0 1977 1969 1971 1973 1975 1979 1981 1983 1985 1987 1989 1991 1993 1995 1997 1999 2001 2003 2005 2007 2009 -0.1 Source: BEA and BLS
  • 51.
    The Shasta/Lassen Region Ifregion’s consumers bought $5 of their food directly from local farms each week... …farms would earn $89 million of new farm income
  • 52.
    The Shasta/Lassen Regionis not alone...
  • 53.
    Data from each county in the Shasta/Lassen Region Photos: Edible Shasta—Butte
  • 54.
    Farm Production Balancein Lassen County, California, 1969-2010 120 Cash receipts Production expenses 100 Balance $ millions (2010 dollars) 80 60 40 20 0 2003 1969 1971 1973 1975 1977 1979 1981 1983 1985 1987 1989 1991 1993 1995 1997 1999 2001 2005 2007 2009 -20 Bureau of Economic Analysis
  • 55.
    Farm Production Balancein Modoc County, California, 1969-2010 200 Cash receipts Production expenses 150 Balance $ millions (2010 dollars) 100 50 0 1993 1969 1971 1973 1975 1977 1979 1981 1983 1985 1987 1989 1991 1995 1997 1999 2001 2003 2005 2007 2009 -50 Bureau of Economic Analysis
  • 56.
    Farm Production Balancein Shasta County, California, 1969-2010 100 Cash receipts 80 Production expenses Balance $ millions (2010 dollars) 60 40 20 0 1993 1969 1971 1973 1975 1977 1979 1981 1983 1985 1987 1989 1991 1995 1997 1999 2001 2003 2005 2007 2009 -20 -40 Bureau of Economic Analysis
  • 57.
    Farm Production Balancein Siskiyou County, California, 1969-2010 250 Cash receipts Production expenses 200 Balance $ millions (2010 dollars) 150 100 50 0 1993 1969 1971 1973 1975 1977 1979 1981 1983 1985 1987 1989 1991 1995 1997 1999 2001 2003 2005 2007 2009 Bureau of Economic Analysis
  • 58.
    Farm Production Balancein Tehama County, California, 1969-2010 250 Cash receipts Production expenses 200 Balance $ millions (2010 dollars) 150 100 50 0 1989 1969 1971 1973 1975 1977 1979 1981 1983 1985 1987 1991 1993 1995 1997 1999 2001 2003 2005 2007 2009 -50 -100 Bureau of Economic Analysis
  • 59.
    Farm Production Balancein Trinity County, California, 1969-2010 10 Cash receipts Production expenses 8 Balance 6 $ millions (2010 dollars) 4 2 0 1995 2005 1969 1971 1973 1975 1977 1979 1981 1983 1985 1987 1989 1991 1993 1997 1999 2001 2003 2007 2009 -2 -4 -6 Bureau of Economic Analysis
  • 60.
    State of California Source:USDA Agriculture Census 2007
  • 61.
    Top Farm Productsin California Top Farm Products in California, 2010 Grapes 10% Almonds Cattle & Calves 9% Ornamentals 7% 12% Strawberries 6% Dairy Lettuce 19% 5% Other Tomatoes 18% 4% Pistachios Walnuts 4% Rice 3% 3% Economic Research Service (2010)
  • 62.
    Farm Production Balancein California, 1969-2010 45 Cash receipts 40 Production expenses Balance 35 $ billions (2010 dollars) 30 25 20 15 10 5 0 2001 1969 1971 1973 1975 1977 1979 1981 1983 1985 1987 1989 1991 1993 1995 1997 1999 2003 2005 2007 2009 Bureau of Economic Analysis
  • 63.
  • 64.
    Farm production balancefor U.S. farms, 1929 -2011 400 350 U.S. Data Cash receipts 300 Production expenses Farm Production Balance $ billions (current dollars) 250 200 150 100 50 0 1929 1932 1935 1938 1941 1944 1947 1950 1953 1956 1959 1962 1965 1968 1971 1974 1977 1980 1983 1986 1989 1992 1995 1998 2001 2004 2007 2010 -50 USDA / Economic Research Service
  • 65.
    Farm Production Balancefor U.S. farms, 1929 - 2011 500 450 U.S. Data 400 350 $ billions (2011 dollars) 300 250 200 Cash receipts 150 Production expenses Farm Production Balance 100 50 0 1929 1932 1935 1938 1941 1944 1947 1950 1953 1956 1959 1962 1965 1968 1971 1974 1977 1980 1983 1986 1989 1992 1995 1998 2001 2004 2007 2010 -50 USDA / Economic Research Service
  • 66.
    $ billions (2011) 0 5 10 15 20 25 1949 1951 1953 1955 1957 1959 1961 1963 U.S. Data 1965 1967 1969 1971 1973 USDA / Economic Research Service 1975 1977 1979 1981 1983 1985 1987 1989 1991 1993 1995 1997 1999 Value of food reserved by U.S. farmers for home consumption, 1949 - 2009 2001 2003 2005 2007 2009
  • 68.
    Sugar and CornSweetener Use in U.S., 1966 - 2008 160 140 Sugar 120 HFCS pounds per person Glucose 100 Dextrose 80 All sweeteners 60 40 20 0 1966 1968 1970 1972 1974 1976 1978 1980 1982 1984 1986 1988 1990 1992 1994 1996 1998 2000 2002 2004 2006 2008 USDA / Economic Research Service
  • 69.
    U.S. Youth Whoare Overweight Percent by Age Percent 16 14.0% 14 12 10.7% 13% 10 10.7% 8 6 4.6% 4 4.1% 2 0 1963-70 1971-74 1976-80 1988-94 1999 Ages 6-11 Ages 12-17 >95th percentile for BMI by age and sex, based on NHANES I reference data Source: Troiano RP, Flegal KM. Pediatrics 1998;101(3):497-504. NHANES 1999, National Center for Health Statistics. Chart by Melinda Hemmelgarn
  • 70.
    Consumption out ofbalance • 50% of U.S. public school students qualify for free / reduced lunch • 10% of households are ―food insecure‖ Source: USDA Mural: The Food Project
  • 71.
    3,000 deaths from foodborne illness each year Medical costs: $152 billion
  • 72.
    Health suffers Medical costs of obesity are $174 billion per year — Source: CDC/Walters, Harvard Public Health/Colditz
  • 73.
  • 74.
  • 75.
  • 76.
  • 77.
  • 78.
    $ millions - 100 200 300 400 500 600 700 800 1988 1989 1990 1991 1992 1993 1994 1995 1996 1997 1998 1999 2000 2001 2002 2003 2004 Organic Valley sales, 1988 - 2011 2005 2006 2007 2008 2009 2010 $716 million sales 2011
  • 79.
  • 80.
    UNI Local FoodProject 1998 3 institutions buy $111,000 of local foods 2009 26 buy $2,600,000
  • 81.
    Local Food Expenditures by the participating institutions in the Black Hawk County Area, Iowa 1998-2009 Northern Iowa Food & Farm Partnership
  • 82.
    Jobs, Fruit &Veggies, and Black Hawk County region If Black Hawk region residents purchased locally grown fruits and vegetables just 3 months out of the year: • 475 new jobs • $6.3 million in labor income added to local economy David Swenson, ISU Economist
  • 83.
    Will Allen, GrowingPower, Milwaukee
  • 85.
  • 86.
  • 87.
  • 88.
  • 89.
  • 90.
    Pete Scherf —Michigan City, Indiana
  • 91.
  • 92.
    Viroqua, Wisconsin • EconomicDevelopment Association buys building • 100,000 square feet • Regional food processing center
  • 93.
    Viroqua Business Cluster Produce Distributor 1 Produce Distributor 2 Processors TBD Bakery & Public Space Nonprofits
  • 94.
    Viroqua Business Cluster Hospital Produce Distributor 1 Root cellar Produce Distributor 2 Food Processors Organic TBD Valley co-op Schools Bakery & Public Space Amish Nonprofits farmers
  • 95.
  • 96.
    U.S. Federal Policy Invest in communities rather than cash for commodities
  • 97.
    Vision for localfood economies Build: Health Wealth Connection Capacity
  • 98.
    ―Finding Food inFarm Country‖ www.crcworks.org (612) 869-8664 kmeter@crcworks.org