Download to read offline

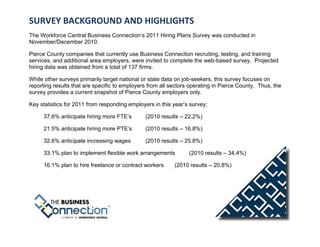
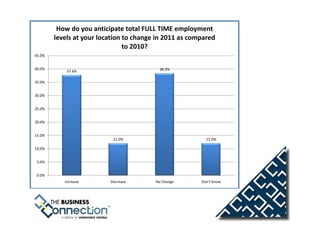
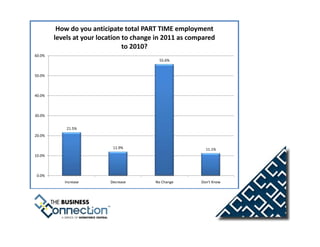
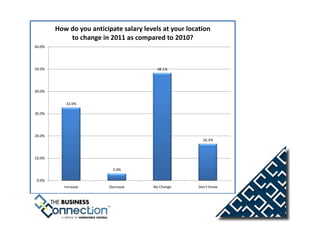


The survey found that Pierce County employers are more optimistic about hiring and compensation levels in 2011 compared to 2010. Specifically: - 37.6% of employers anticipate hiring more full-time employees in 2011, up from 22.2% in 2010. - The net outlook for full-time hiring stands at 25.6%, a significant increase over 2010. - 32.6% of employers plan to increase wages, up from 25.8% in 2010. - The net outlook for salary levels is 29.6%, markedly higher than the 2010 level. - Employers do not intend to reduce part-time needs despite planned full-time increases, signaling that overall hiring will increase substantially


