Download as PDF, PPTX
![References (cont’d)
5. R. Desimone and J. Duncan, “Neural Mechanisms of Selective Visual Attention,”
Annual Review of Neurosciences, vol. 18, pp. 193–222, 1995.
6. P. Duggirala, Excel Auditing Functions [Spreadsheet Risk Management – Part 3
of 4], 2012, accessed December 2012. [Online]. Available:
http://chandoo.org/wp/2012/01/18/excel-auditing-functions/
7. G. Engels and M. Erwig, “ClassSheets: automatic generation of spreadsheet
applications from object-oriented specifications,” in Proceedings of the 20th
IEEE/ACM International Conference on Automated Software Engineering. ACM,
2005, pp. 124–133.
8. J. F. Raffensperger, The Art of the Spreadsheet, 2008, accessed December 2012.
[Online]. Available: http://john.raffensperger.org/john/ArtOfTheSpreadsheet/
9. J. K. Doyle and D. N. Ford, “Mental Models Concepts for System Dynamics
Research,” System Dynamics Review, vol. 14, no. 1, pp. 3–29, 1998.
Kankuzi, Sajaniemi VL/HCC 2014 1.8.2014 20](https://image.slidesharecdn.com/kankuzisajaniemivlhcc2014presentationfinal-140829042551-phpapp02/85/Visualizing-the-Problem-Domain-for-Spreadsheet-Users-A-Mental-Model-Perspective-20-320.jpg)

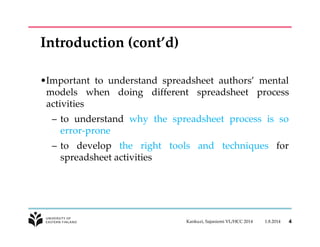
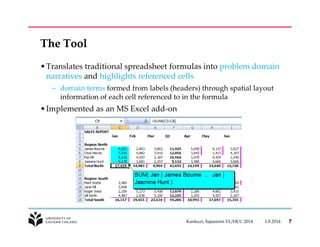
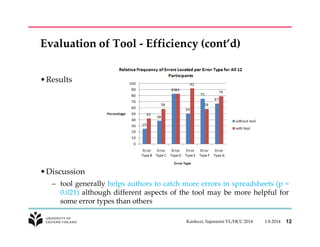
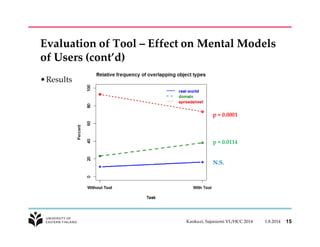
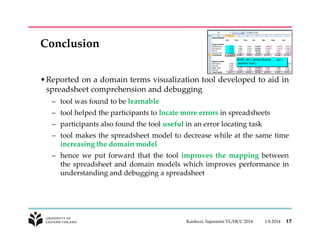
The document discusses the development and evaluation of a spreadsheet understanding and debugging tool aimed at improving the mental models of users. The tool translates spreadsheet formulas into problem domain narratives, making it easier for authors to locate errors and understand relationships within their spreadsheets. Evaluation results indicated that the tool enhanced usability by increasing the accuracy of error detection and shifting focus from spreadsheet-specific to domain-specific understanding.


