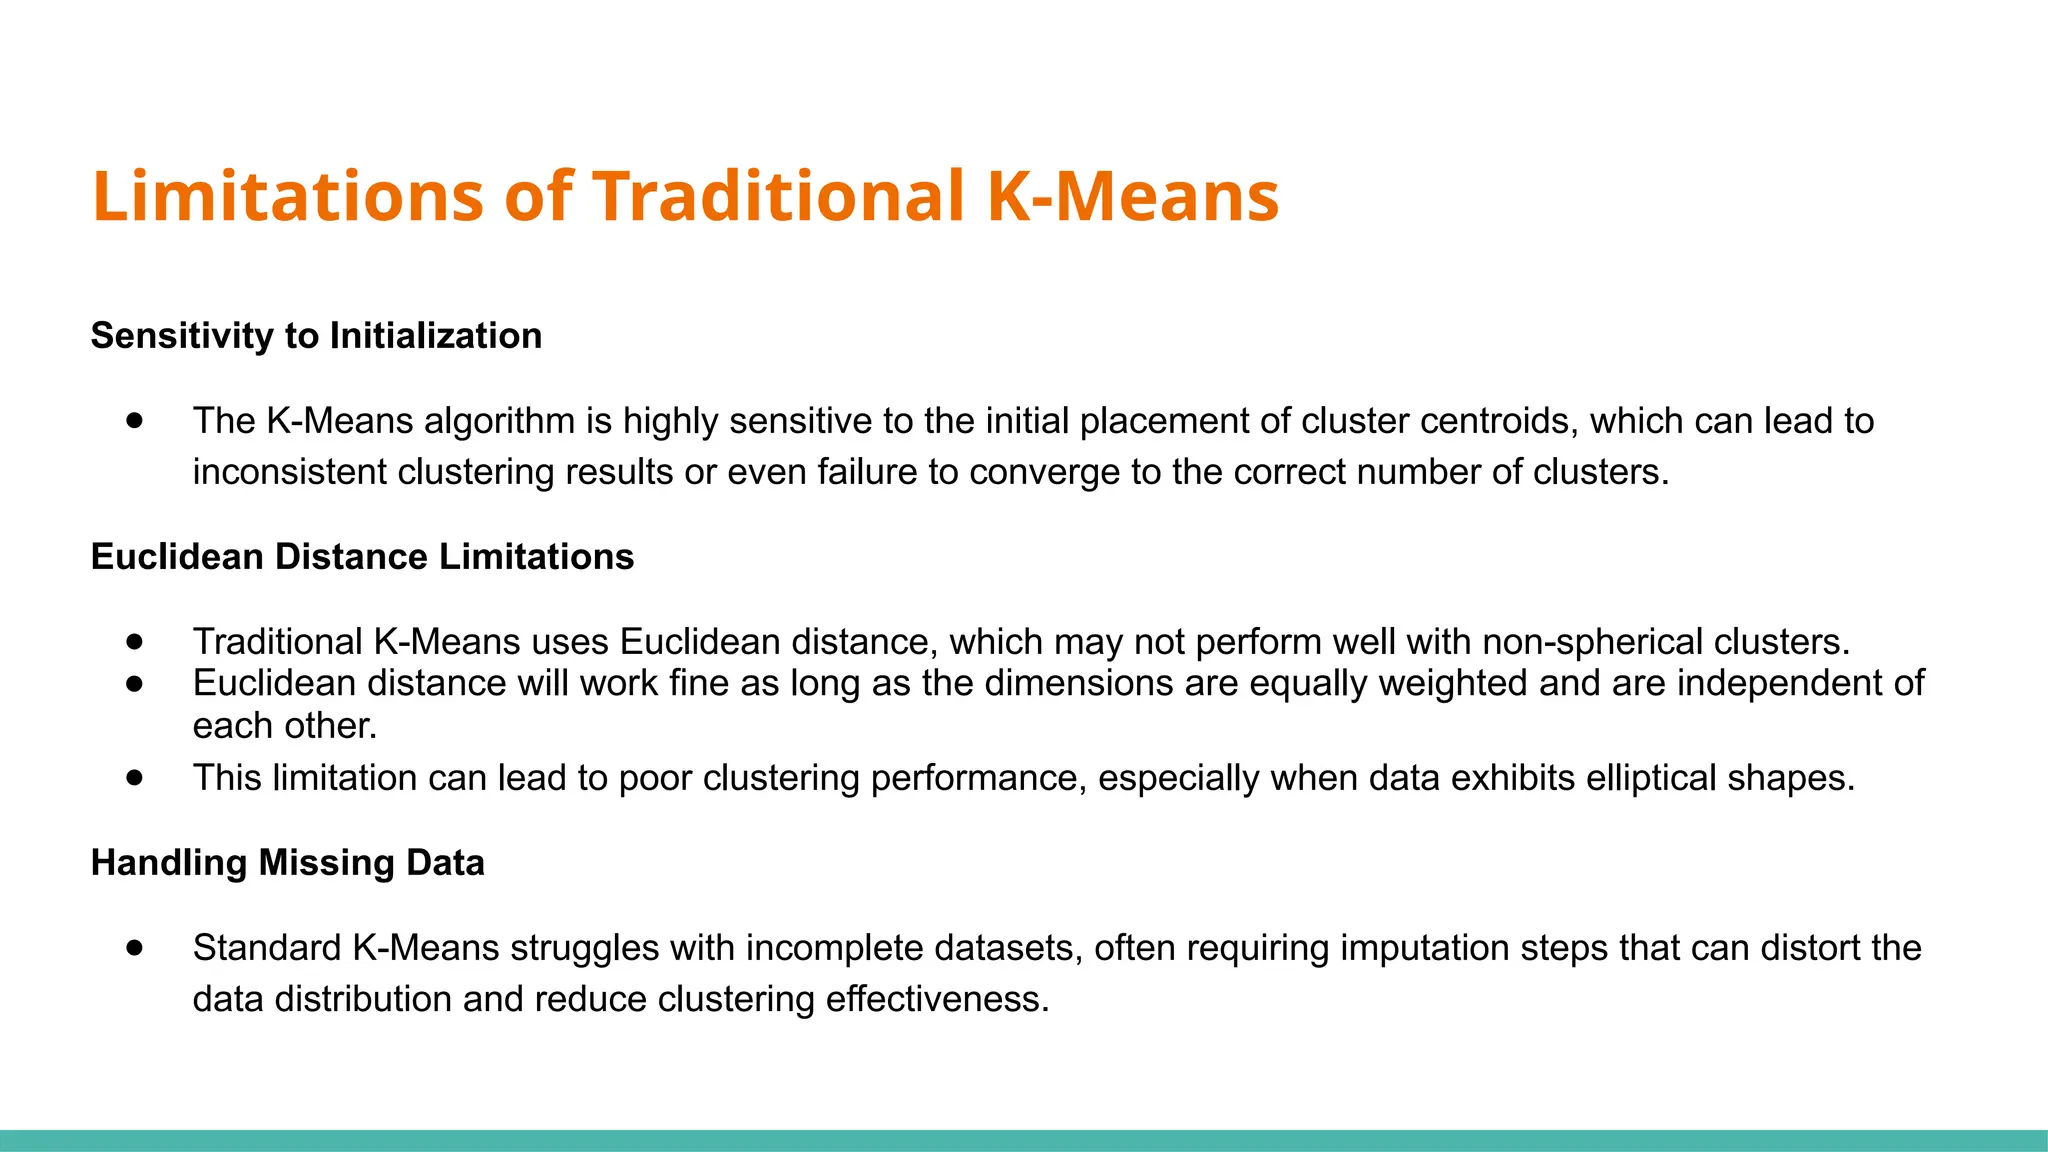
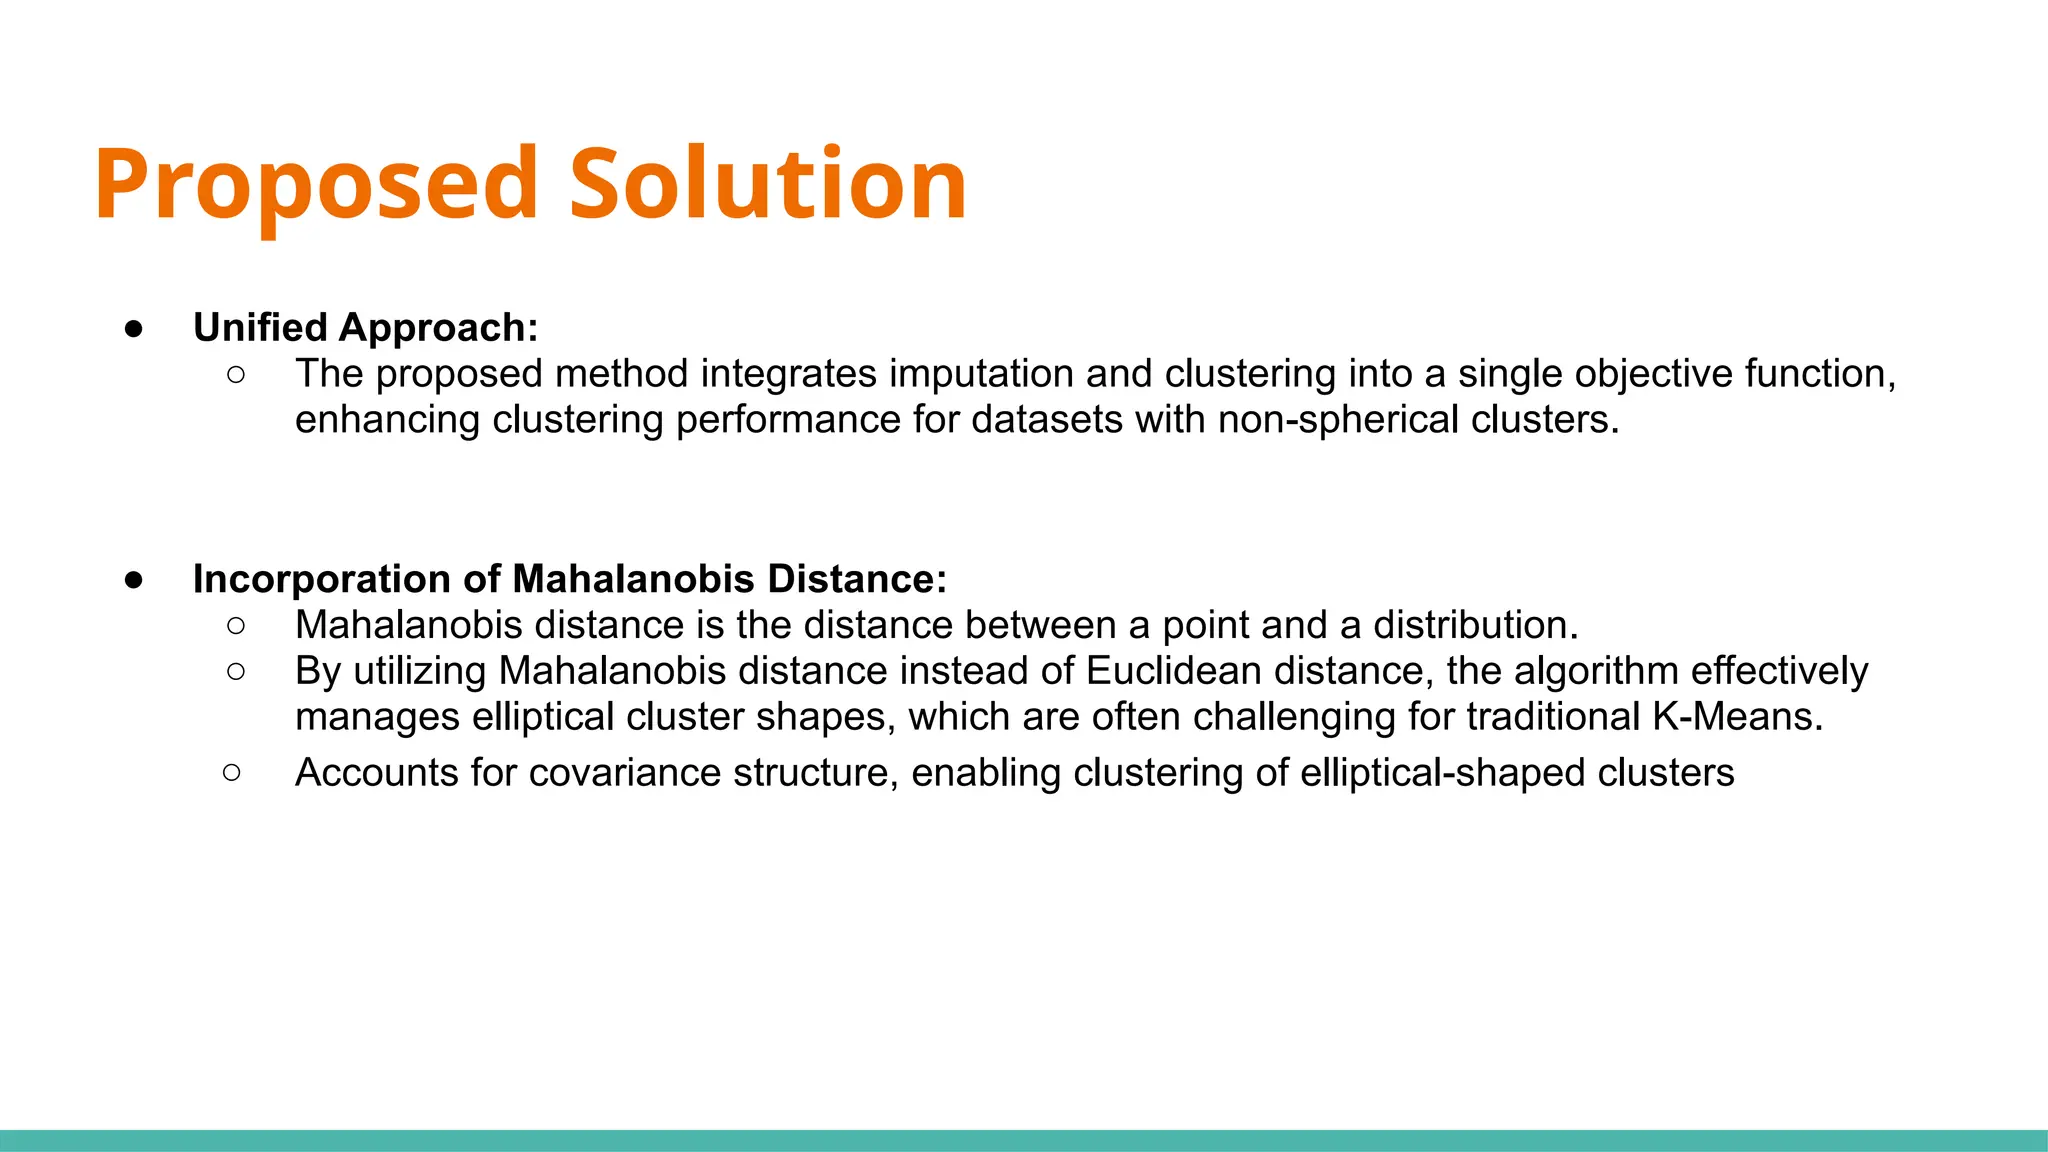
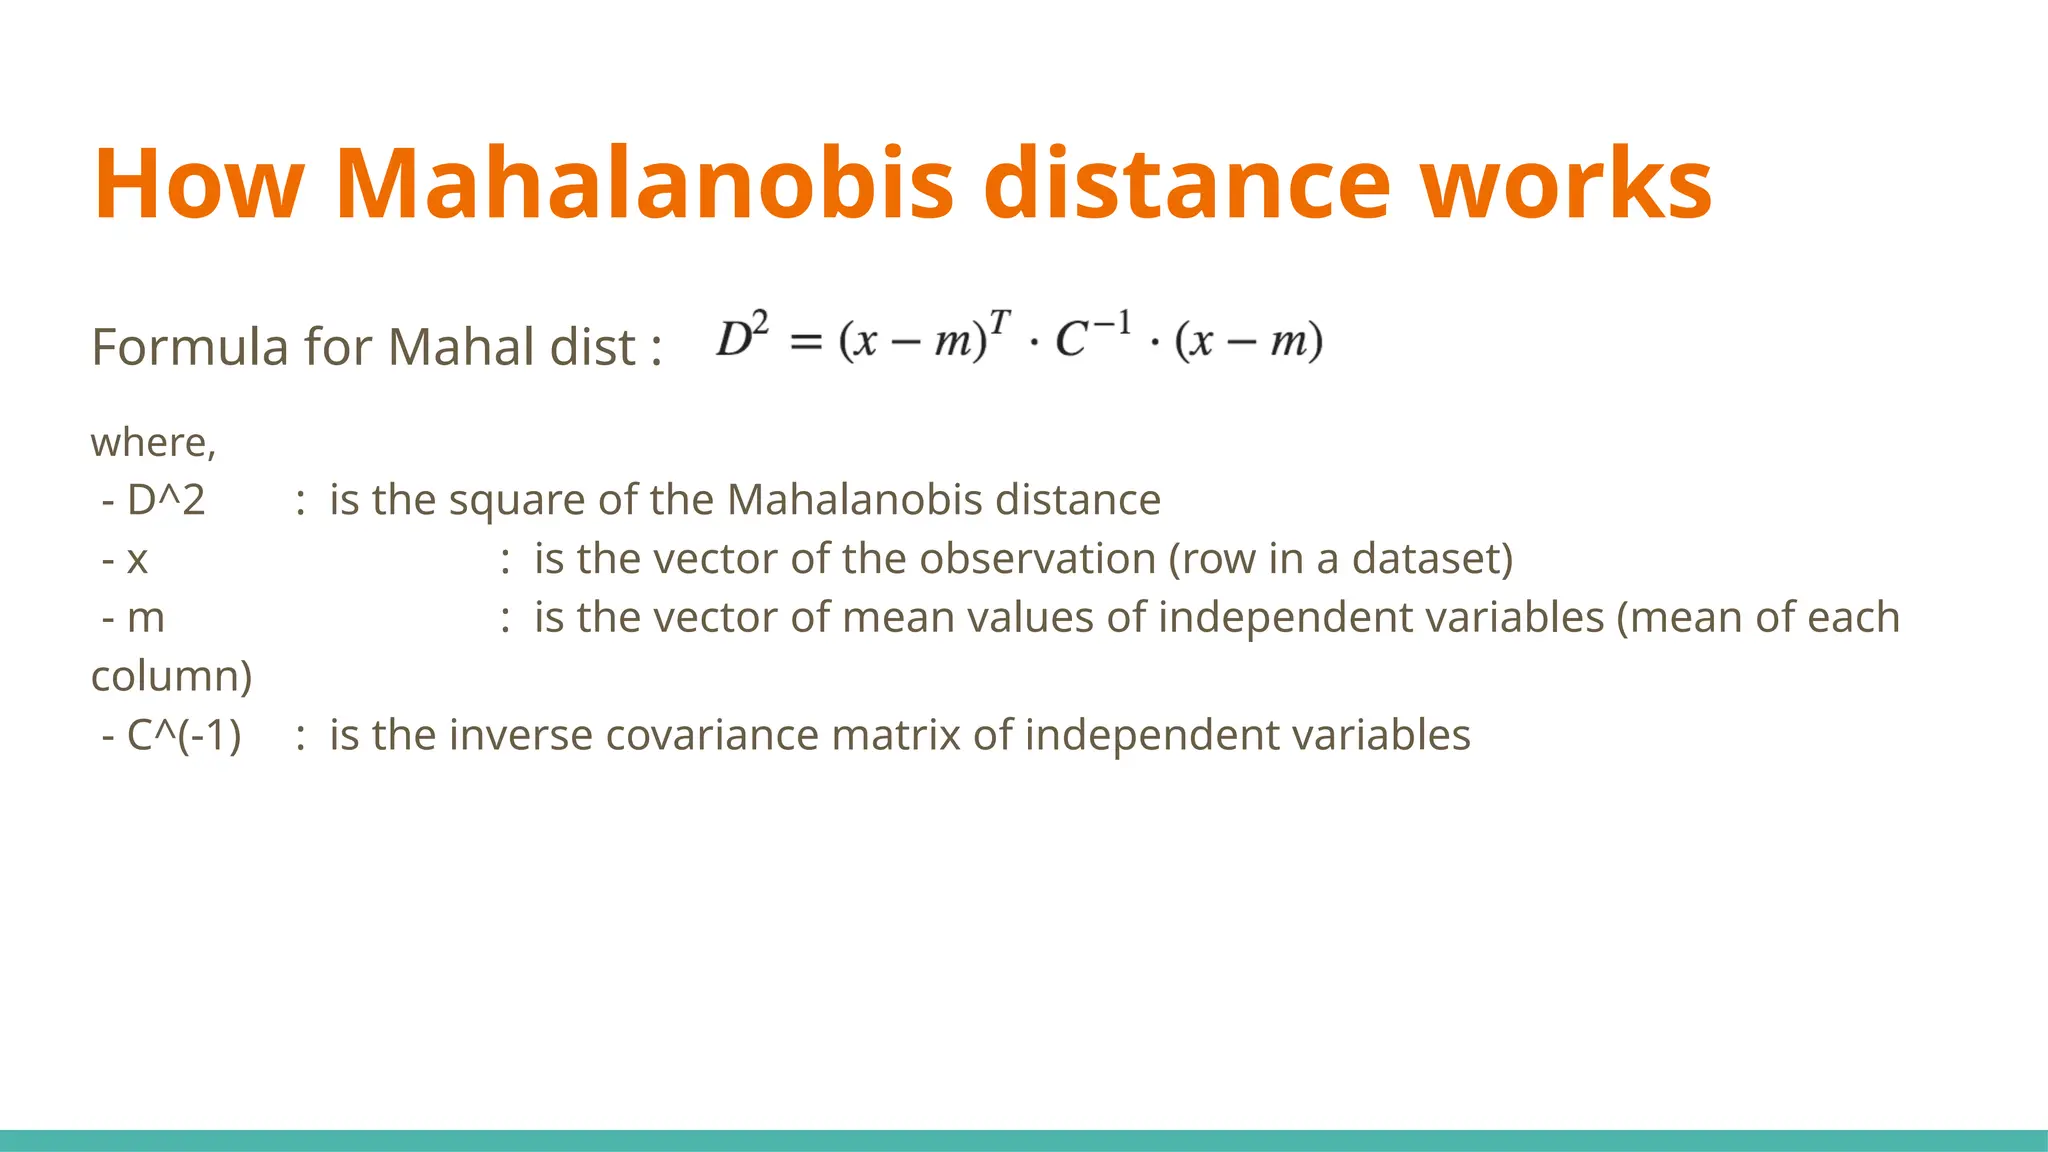
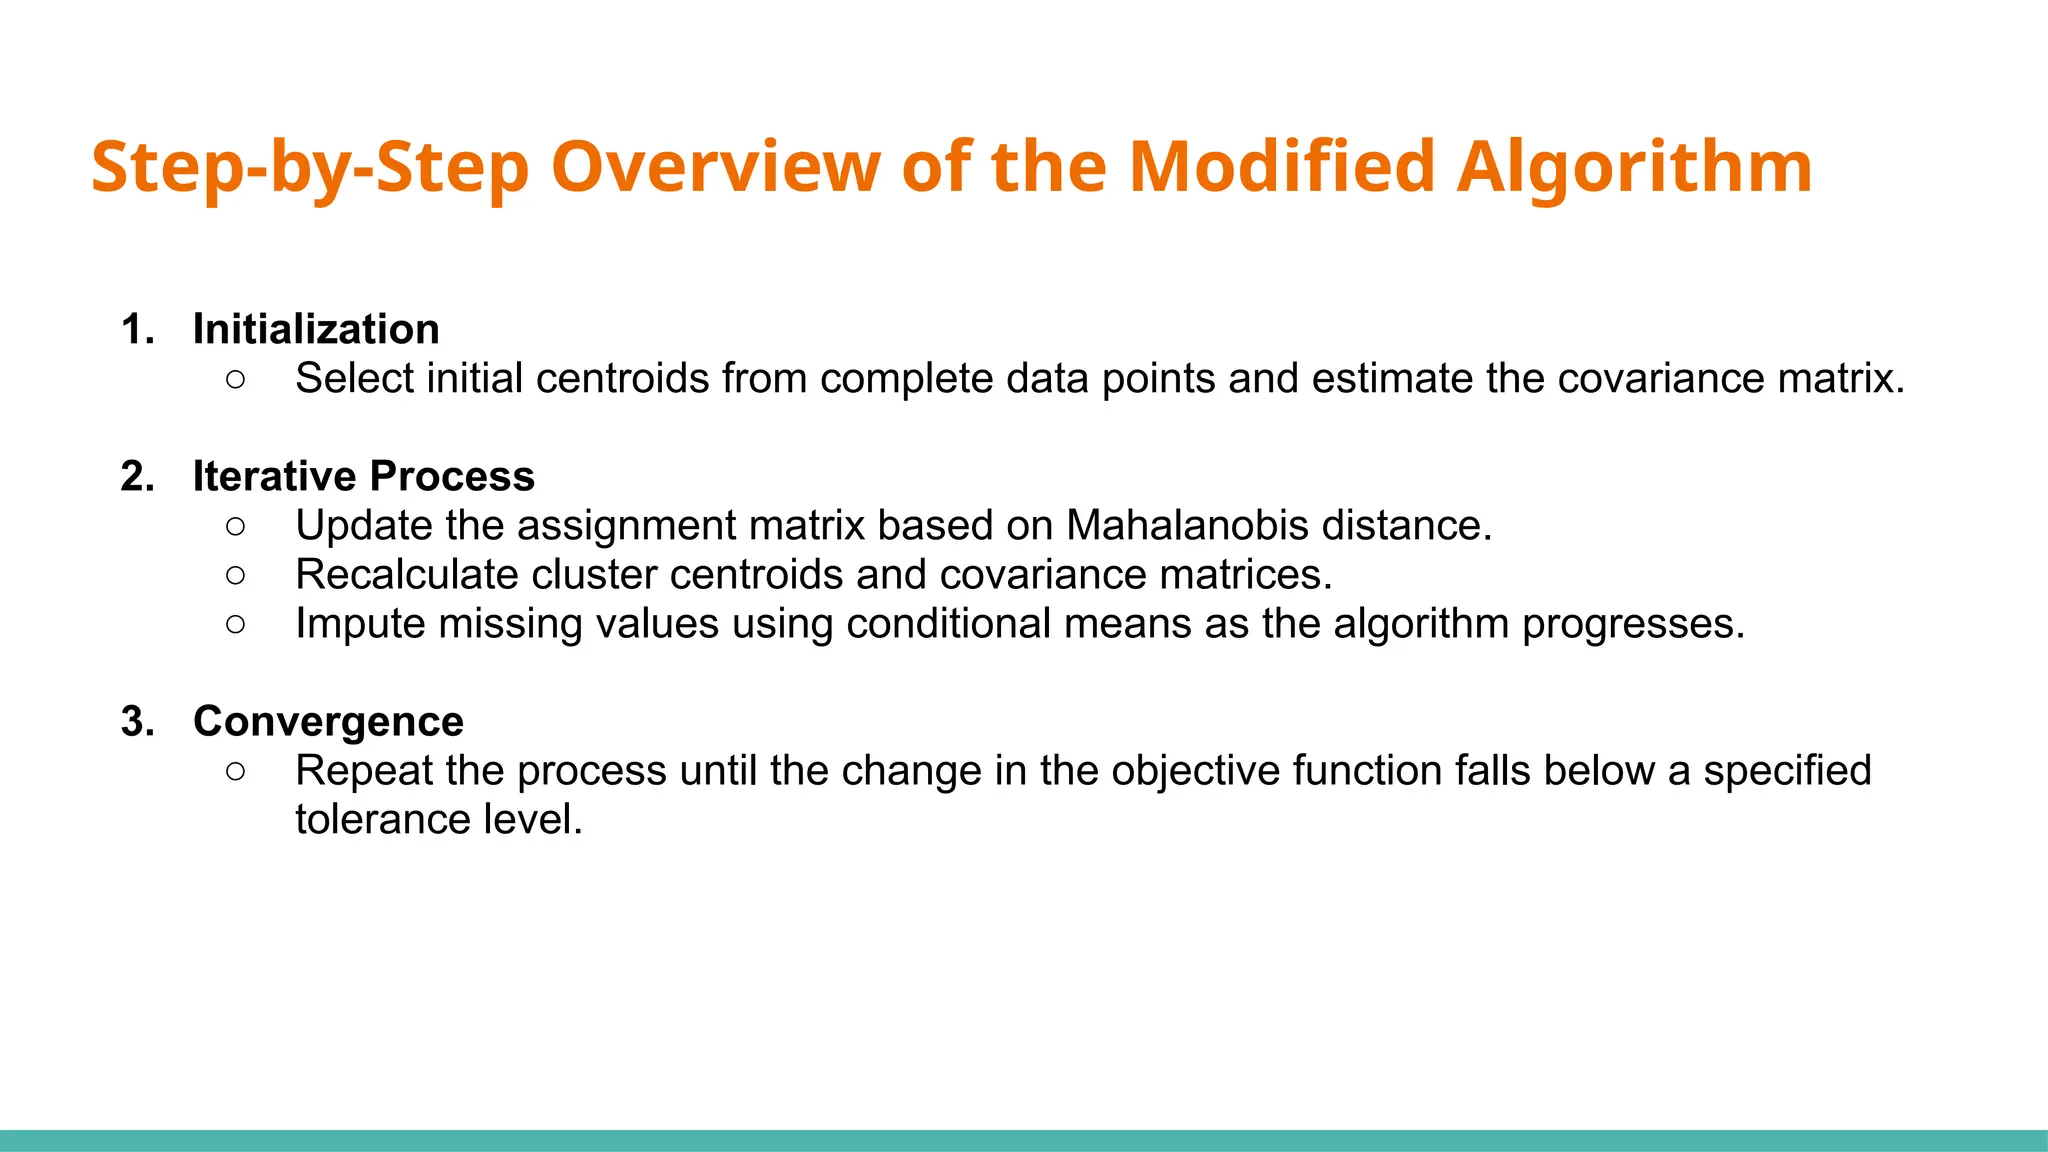
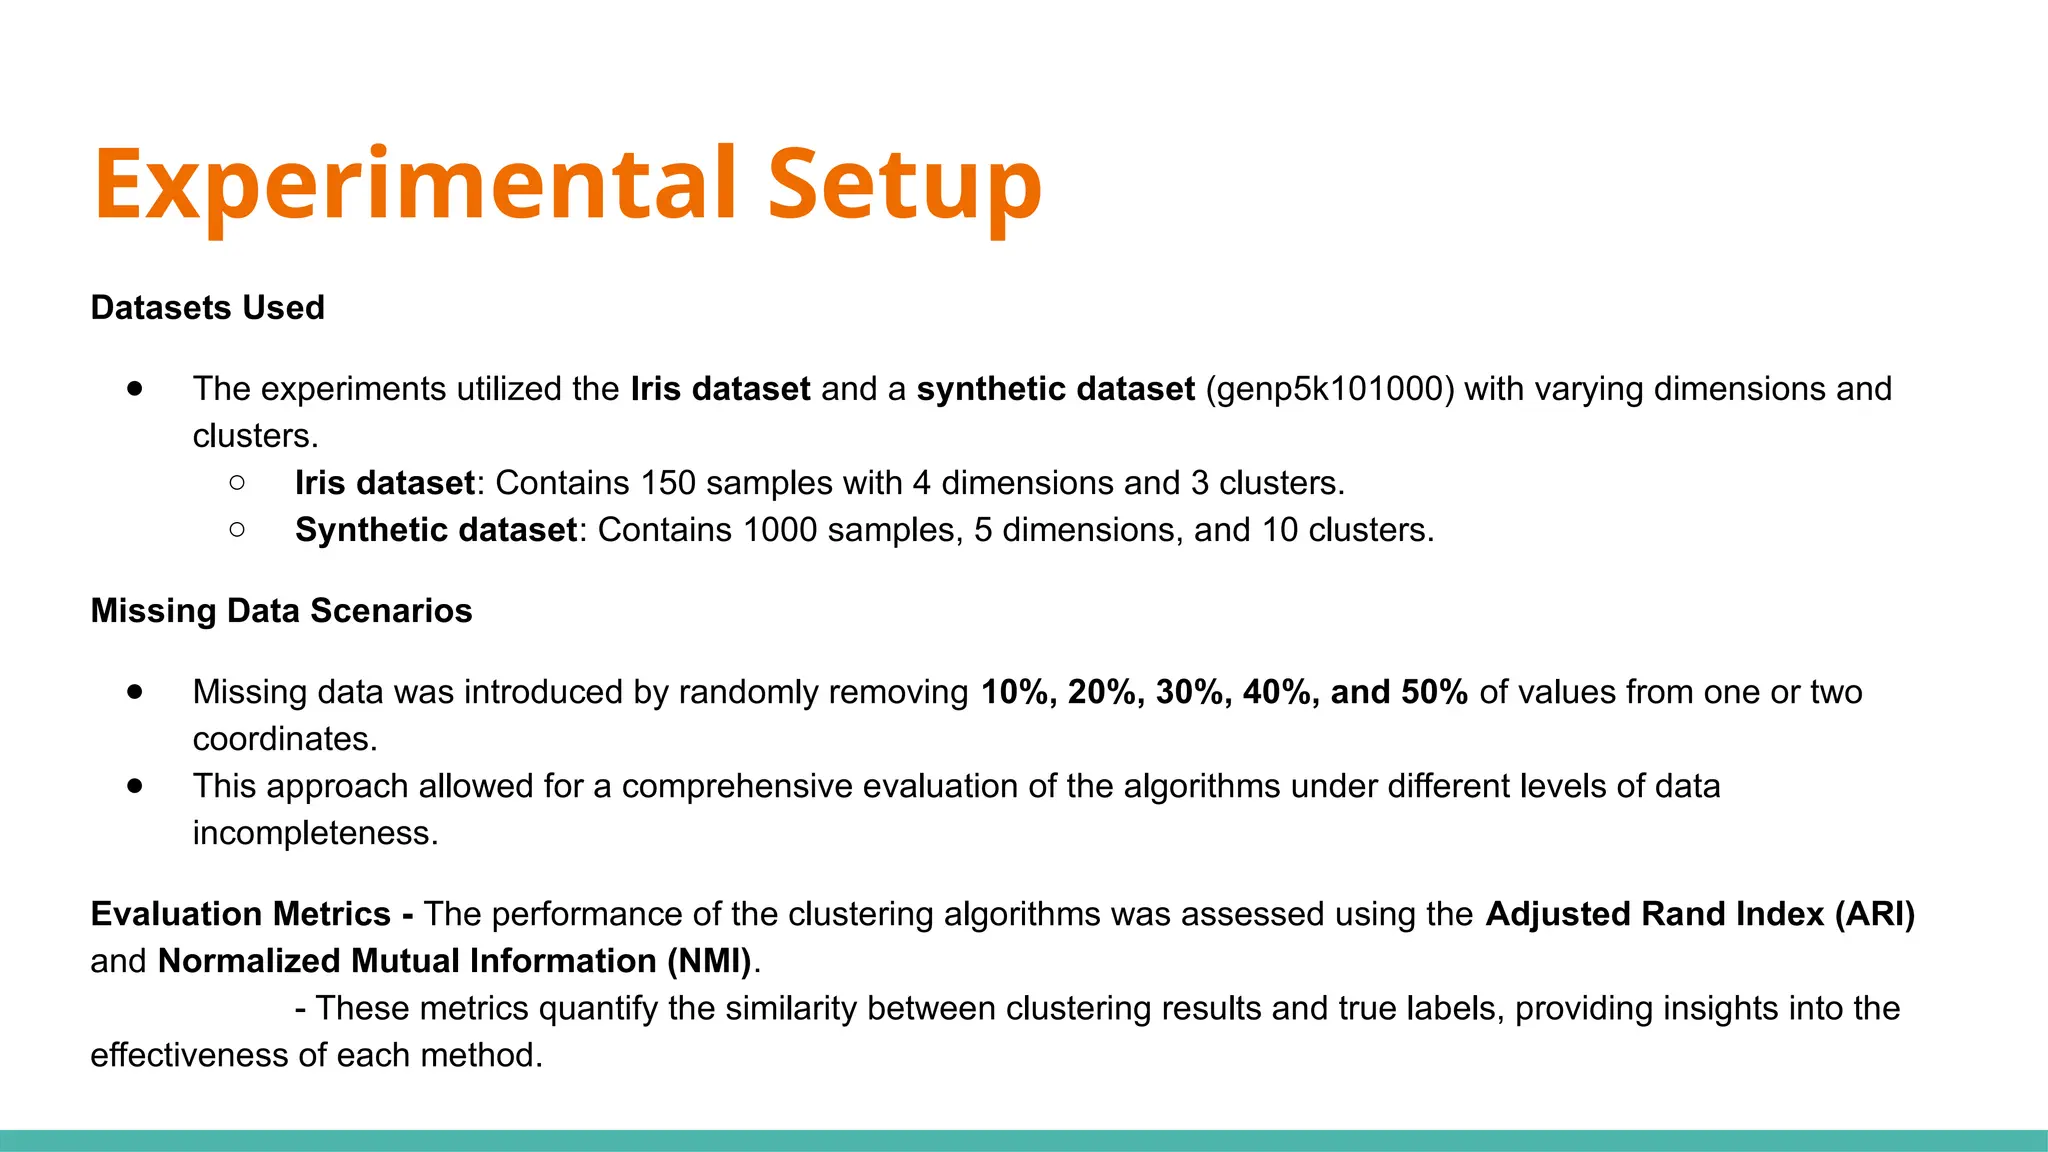
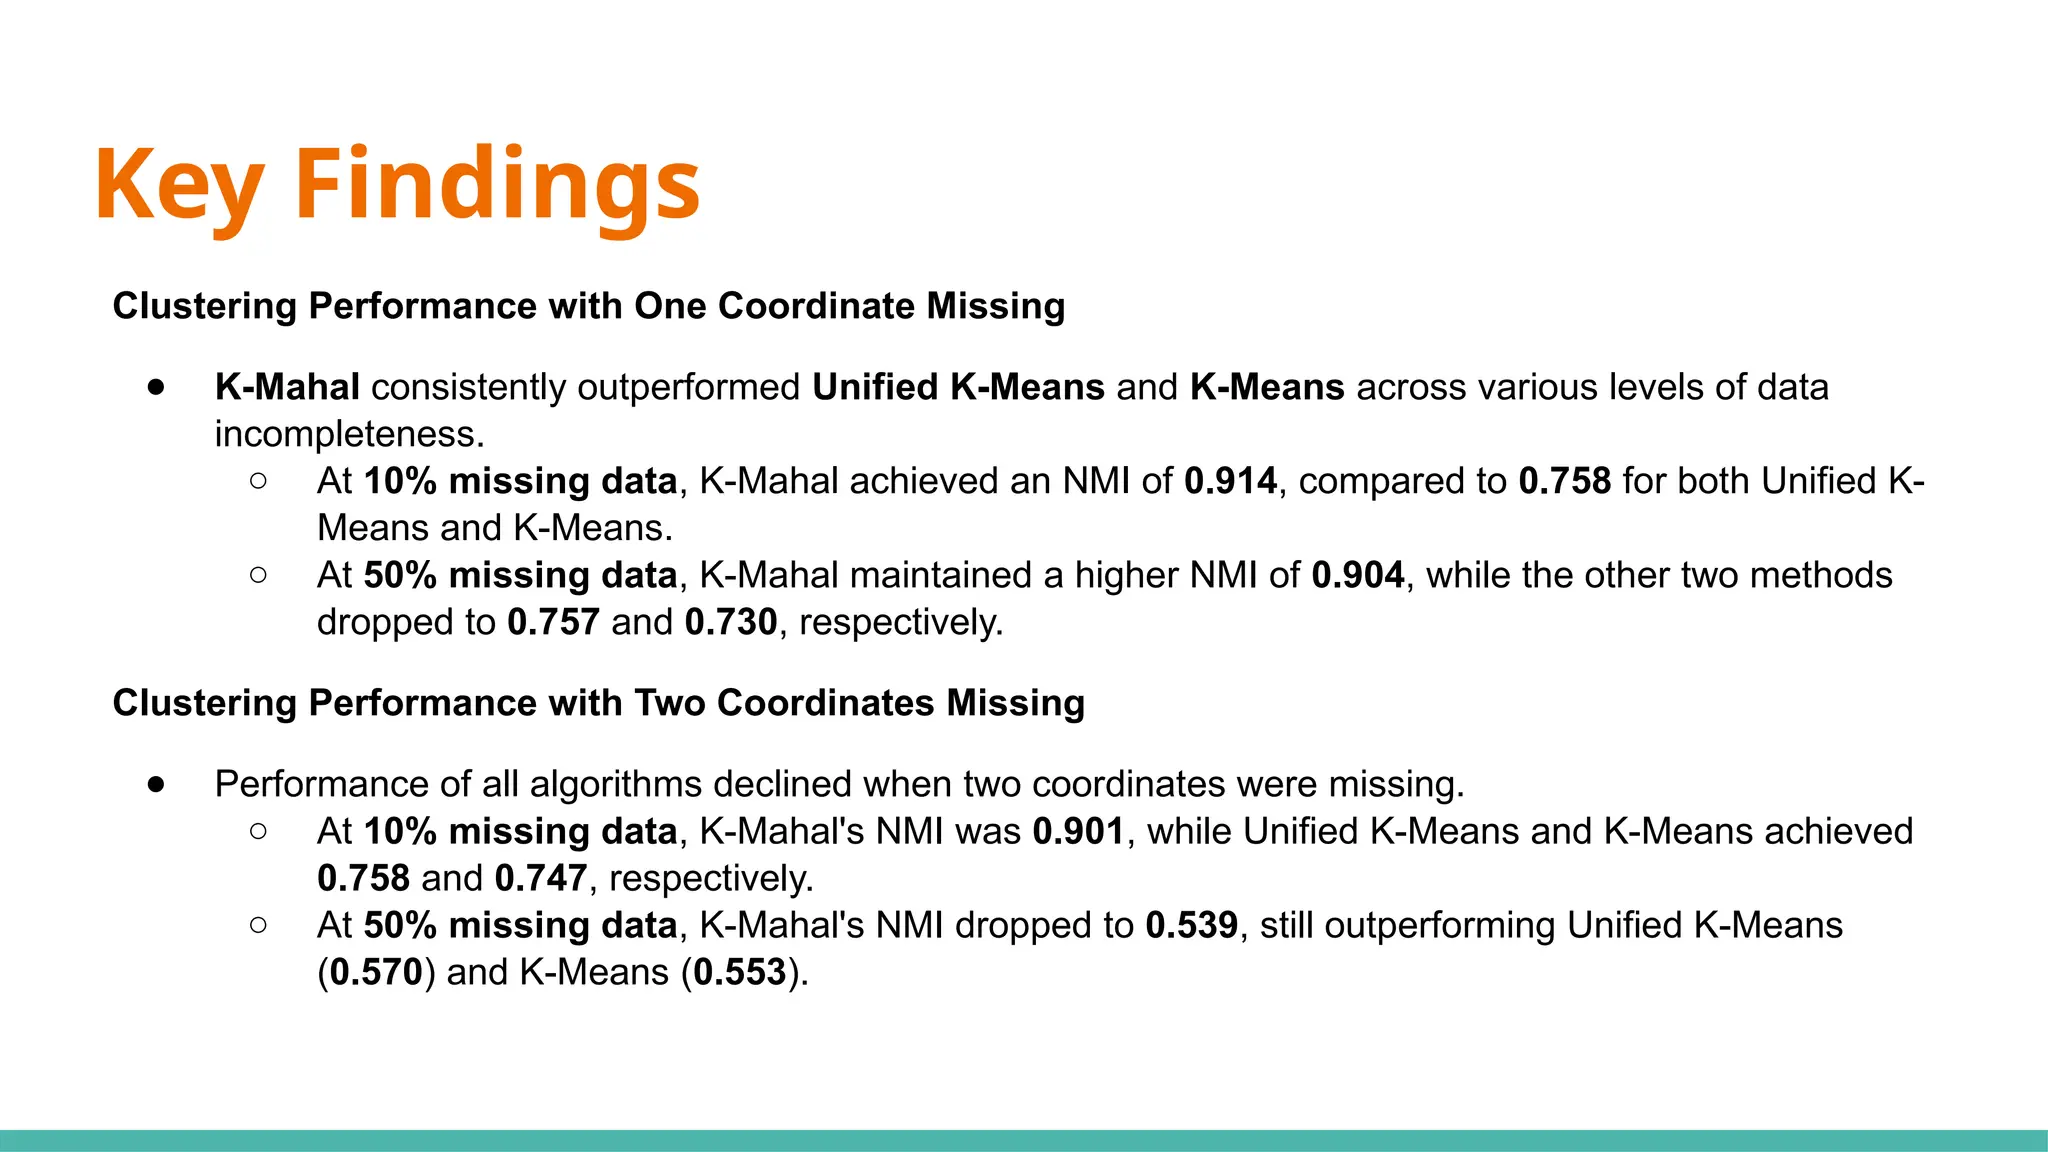
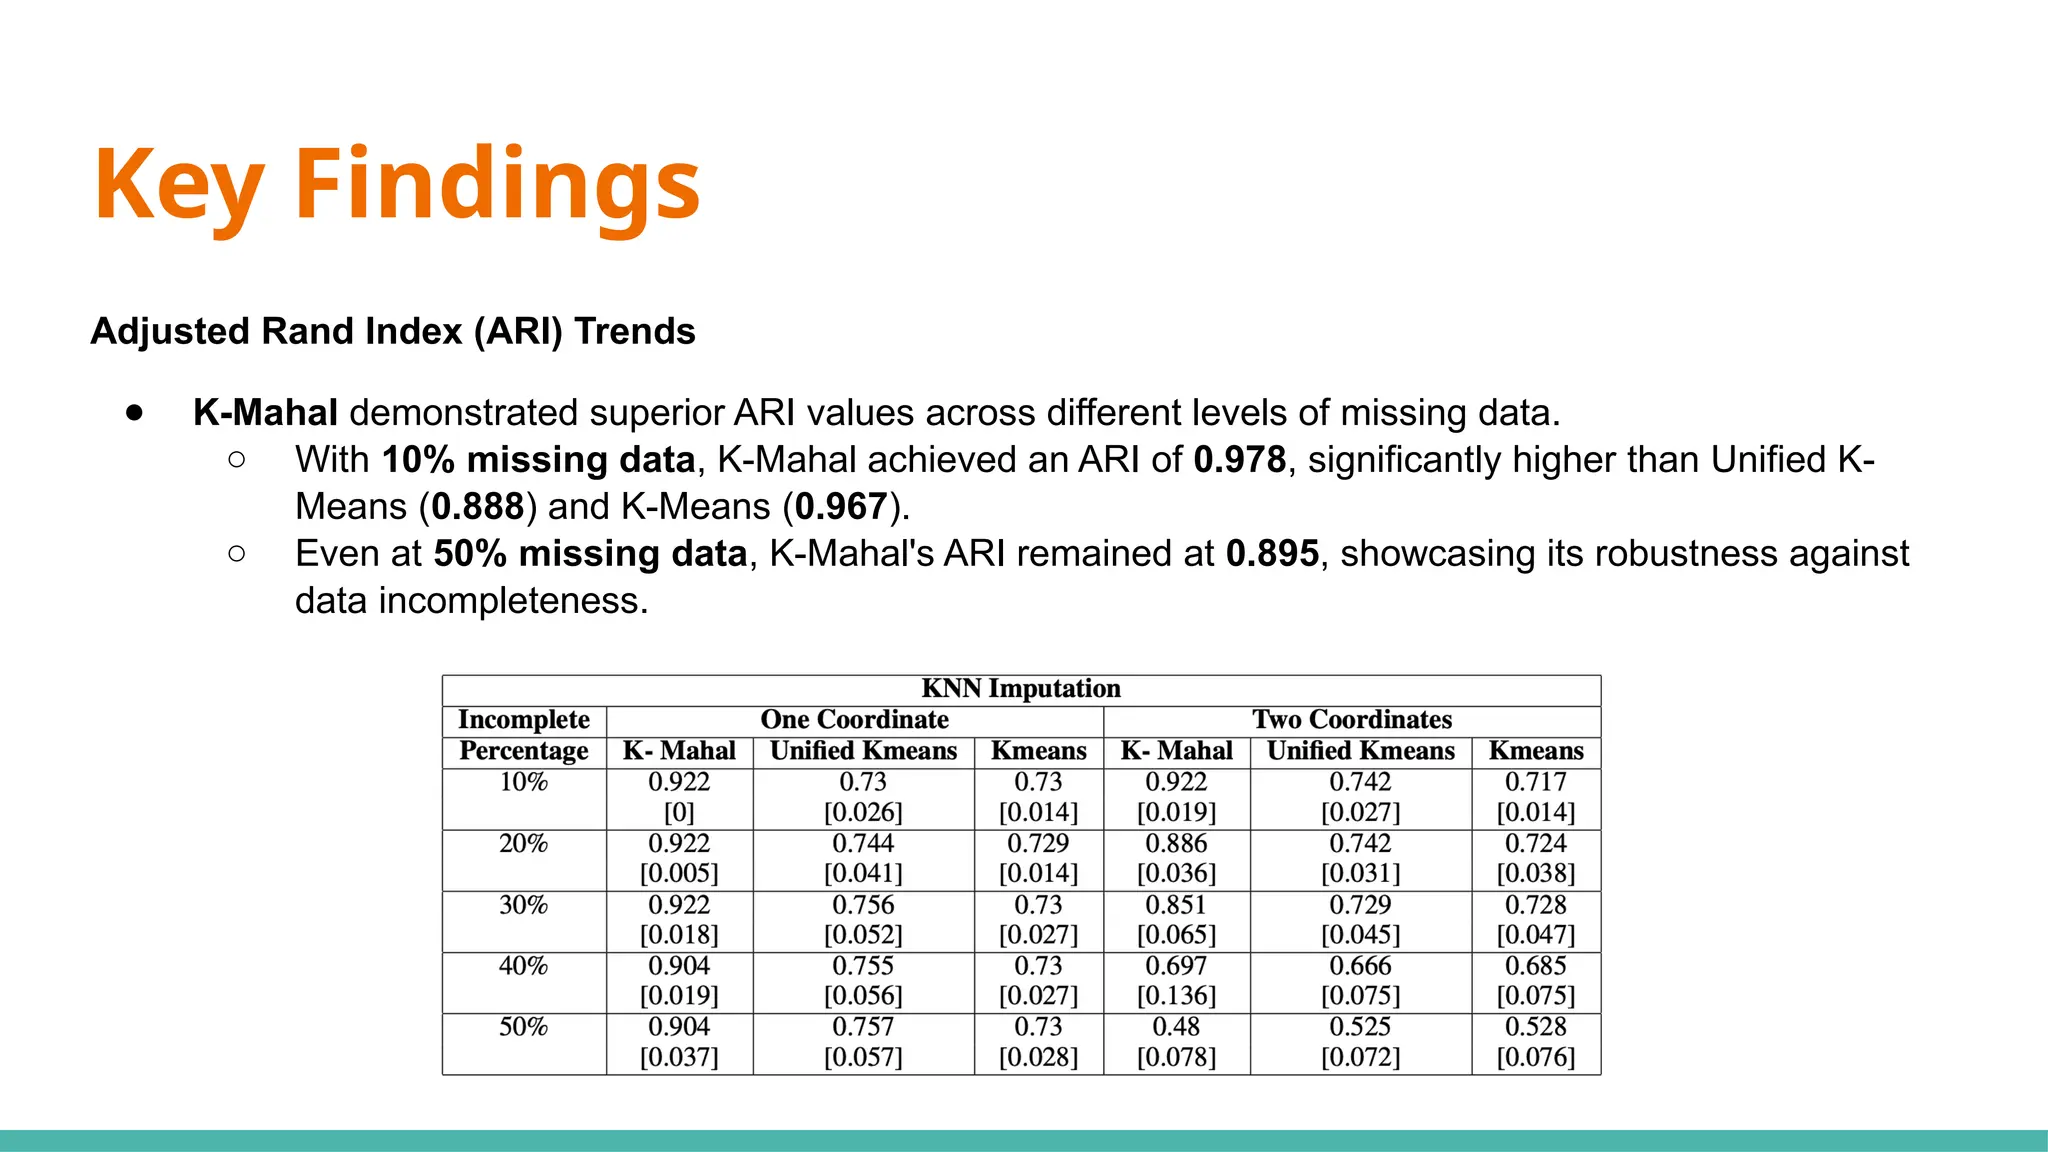
K-Means Clustering with Incomplete Data
Using Mahalanobis Distance
Authors: Lovis Kwasi Armah & Igor Melnykov
Publication Date: November 5, 2024
Presented By: Rushabh Runwal
● K-Means Clustering is an unsupervised
machine learning algorithm used to group
unlabeled data into clusters based on
similarity.
● Applications of K means clustering:
○ In computer vision, it is employed for object
detection and image processing as well as
algorithms in computer security helping detect
Distributed Denial of Service (DDoS) attacks.
○ In health and social sciences, it is used for data
summarization and segmentation, among other
applications.
Introduction to K Means Clustering
● The K-Means algorithm follows these steps:
○ Initialization: Randomly select k initial centroids.
○ Assignment: Assign each data point to the nearest centroid based on the Euclidean
distance.
○ Update: Recalculate the centroids as the mean of all data points assigned to each cluster.
○ Iteration: Repeat the assignment and update steps until the centroids no longer change
or a maximum number of iterations is reached
Introduction to K Means Clustering
Sensitivity to Initialization
● The K-Means algorithm is highly sensitive to the initial placement of cluster centroids, which can lead to
inconsistent clustering results or even failure to converge to the correct number of clusters.
Euclidean Distance Limitations
● Traditional K-Means uses Euclidean distance, which may not perform well with non-spherical clusters.
● Euclidean distance will work fine as long as the dimensions are equally weighted and are independent of
each other.
● This limitation can lead to poor clustering performance, especially when data exhibits elliptical shapes.
Handling Missing Data
● Standard K-Means struggles with incomplete datasets, often requiring imputation steps that can distort the
data distribution and reduce clustering effectiveness.
Limitations of Traditional K-Means
Proposed Solution
● Unified Approach:
○ The proposed method integrates imputation and clustering into a single objective function,
enhancing clustering performance for datasets with non-spherical clusters.
● Incorporation of Mahalanobis Distance:
○ Mahalanobis distance is the distance between a point and a distribution.
○ By utilizing Mahalanobis distance instead of Euclidean distance, the algorithm effectively
manages elliptical cluster shapes, which are often challenging for traditional K-Means.
○ Accounts for covariance structure, enabling clustering of elliptical-shaped clusters
How Mahalanobis distance works
Formula for Mahal dist :
where,
- D^2 : is the square of the Mahalanobis distance
- x : is the vector of the observation (row in a dataset)
- m : is the vector of mean values of independent variables (mean of each
column)
- C^(-1) : is the inverse covariance matrix of independent variables
Step-by-Step Overview of the Modified Algorithm
1. Initialization
○ Select initial centroids from complete data points and estimate the covariance matrix.
2. Iterative Process
○ Update the assignment matrix based on Mahalanobis distance.
○ Recalculate cluster centroids and covariance matrices.
○ Impute missing values using conditional means as the algorithm progresses.
3. Convergence
○ Repeat the process until the change in the objective function falls below a specified
tolerance level.
Experimental Setup
Datasets Used
● The experiments utilized the Iris dataset and a synthetic dataset (genp5k101000) with varying dimensions and
clusters.
○ Iris dataset: Contains 150 samples with 4 dimensions and 3 clusters.
○ Synthetic dataset: Contains 1000 samples, 5 dimensions, and 10 clusters.
Missing Data Scenarios
● Missing data was introduced by randomly removing 10%, 20%, 30%, 40%, and 50% of values from one or two
coordinates.
● This approach allowed for a comprehensive evaluation of the algorithms under different levels of data
incompleteness.
Evaluation Metrics - The performance of the clustering algorithms was assessed using the Adjusted Rand Index (ARI)
and Normalized Mutual Information (NMI).
- These metrics quantify the similarity between clustering results and true labels, providing insights into the
effectiveness of each method.
Key Findings
Clustering Performance with One Coordinate Missing
● K-Mahal consistently outperformed Unified K-Means and K-Means across various levels of data
incompleteness.
○ At 10% missing data, K-Mahal achieved an NMI of 0.914, compared to 0.758 for both Unified K-
Means and K-Means.
○ At 50% missing data, K-Mahal maintained a higher NMI of 0.904, while the other two methods
dropped to 0.757 and 0.730, respectively.
Clustering Performance with Two Coordinates Missing
● Performance of all algorithms declined when two coordinates were missing.
○ At 10% missing data, K-Mahal's NMI was 0.901, while Unified K-Means and K-Means achieved
0.758 and 0.747, respectively.
○ At 50% missing data, K-Mahal's NMI dropped to 0.539, still outperforming Unified K-Means
(0.570) and K-Means (0.553).
Key Findings
Adjusted Rand Index (ARI) Trends
● K-Mahal demonstrated superior ARI values across different levels of missing data.
○ With 10% missing data, K-Mahal achieved an ARI of 0.978, significantly higher than Unified K-
Means (0.888) and K-Means (0.967).
○ Even at 50% missing data, K-Mahal's ARI remained at 0.895, showcasing its robustness against
data incompleteness.
Applications
Healthcare:
● K-Mahal can be used to cluster patient data with missing values, enabling more effective patient segmentation and
personalized treatment plans.
● This is particularly important in medical datasets, where incomplete information is common due to reasons like
patient non-compliance or data entry errors.
Finance:
● In financial analysis, K-Mahal can help identify customer segments for targeted marketing campaigns, even with
incomplete customer data.
● This capability allows financial institutions to make informed decisions, thereby improving customer relationship
management.
Image Processing:
● K-Mahal can be applied to image segmentation tasks where pixel data may be missing or corrupted.
● By clustering incomplete image data effectively, it enhances image analysis and object detection processes.
Conclusion and Future Work
Research Outcomes
● The study demonstrated that K-Mahal, which integrates Mahalanobis distance with a unified approach to imputation
and clustering, significantly outperforms traditional K-Means and Unified K-Means algorithms, especially in
scenarios with incomplete data.
○ For example, K-Mahal achieved an Adjusted Rand Index (ARI) of 0.978 at 10% missing data, compared to
0.888 for Unified K-Means and 0.967 for K-Means.
Potential Improvements
● Future work could focus on developing specialized imputation techniques tailored for elliptical clusters, potentially
further enhancing the performance of K-Mahal with higher levels of missing data.
● This could involve exploring advanced methods like multiple imputation or regression imputation to better
estimate missing values.
Broader Implications
● The findings suggest that integrating imputation directly into clustering algorithms can lead to more robust and
reliable clustering outcomes, particularly in fields where data incompleteness is common, such as healthcare and
finance.
Key References
1. Ahmed, M., Seraj, R., & Islam, S. M. S. (2020). The k-means algorithm: A comprehensive survey
and performance evaluation. Electronics, 9(8), 1295.
2. Dempster, A. P., Laird, N. M., & Rubin, D. B. (1977). Maximum likelihood from incomplete data via
the EM algorithm. Journal of the Royal Statistical Society: Series B (Methodological), 39(1), 1–22.
3. Melnykov, I., & Melnykov, V. (2014). On k-means algorithm with the use of Mahalanobis distances.
Statistics & Probability Letters, 84, 88–95.
4. Little, R. J. A., & Rubin, D. B. (2002). Statistical Analysis with Missing Data. John Wiley & Sons.
5. Wang, S., et al. (2019). K-means clustering with incomplete data. IEEE Access, 7, 69162–69171.
6. Strehl, A., & Ghosh, J. (2002). Cluster ensembles—a knowledge reuse framework for combining
multiple partitions. Journal of Machine Learning Research, 3, 583–617.

K-Means Clustering with Incomplete Data _Using Mahalanobis Distance.pptx

  • 1.
    K-Means Clustering withIncomplete Data Using Mahalanobis Distance Authors: Lovis Kwasi Armah & Igor Melnykov Publication Date: November 5, 2024 Presented By: Rushabh Runwal
  • 2.
    ● K-Means Clusteringis an unsupervised machine learning algorithm used to group unlabeled data into clusters based on similarity. ● Applications of K means clustering: ○ In computer vision, it is employed for object detection and image processing as well as algorithms in computer security helping detect Distributed Denial of Service (DDoS) attacks. ○ In health and social sciences, it is used for data summarization and segmentation, among other applications. Introduction to K Means Clustering
  • 3.
    ● The K-Meansalgorithm follows these steps: ○ Initialization: Randomly select k initial centroids. ○ Assignment: Assign each data point to the nearest centroid based on the Euclidean distance. ○ Update: Recalculate the centroids as the mean of all data points assigned to each cluster. ○ Iteration: Repeat the assignment and update steps until the centroids no longer change or a maximum number of iterations is reached Introduction to K Means Clustering
  • 4.
    Sensitivity to Initialization ●The K-Means algorithm is highly sensitive to the initial placement of cluster centroids, which can lead to inconsistent clustering results or even failure to converge to the correct number of clusters. Euclidean Distance Limitations ● Traditional K-Means uses Euclidean distance, which may not perform well with non-spherical clusters. ● Euclidean distance will work fine as long as the dimensions are equally weighted and are independent of each other. ● This limitation can lead to poor clustering performance, especially when data exhibits elliptical shapes. Handling Missing Data ● Standard K-Means struggles with incomplete datasets, often requiring imputation steps that can distort the data distribution and reduce clustering effectiveness. Limitations of Traditional K-Means
  • 5.
    Proposed Solution ● UnifiedApproach: ○ The proposed method integrates imputation and clustering into a single objective function, enhancing clustering performance for datasets with non-spherical clusters. ● Incorporation of Mahalanobis Distance: ○ Mahalanobis distance is the distance between a point and a distribution. ○ By utilizing Mahalanobis distance instead of Euclidean distance, the algorithm effectively manages elliptical cluster shapes, which are often challenging for traditional K-Means. ○ Accounts for covariance structure, enabling clustering of elliptical-shaped clusters
  • 6.
    How Mahalanobis distanceworks Formula for Mahal dist : where, - D^2 : is the square of the Mahalanobis distance - x : is the vector of the observation (row in a dataset) - m : is the vector of mean values of independent variables (mean of each column) - C^(-1) : is the inverse covariance matrix of independent variables
  • 7.
    Step-by-Step Overview ofthe Modified Algorithm 1. Initialization ○ Select initial centroids from complete data points and estimate the covariance matrix. 2. Iterative Process ○ Update the assignment matrix based on Mahalanobis distance. ○ Recalculate cluster centroids and covariance matrices. ○ Impute missing values using conditional means as the algorithm progresses. 3. Convergence ○ Repeat the process until the change in the objective function falls below a specified tolerance level.
  • 8.
    Experimental Setup Datasets Used ●The experiments utilized the Iris dataset and a synthetic dataset (genp5k101000) with varying dimensions and clusters. ○ Iris dataset: Contains 150 samples with 4 dimensions and 3 clusters. ○ Synthetic dataset: Contains 1000 samples, 5 dimensions, and 10 clusters. Missing Data Scenarios ● Missing data was introduced by randomly removing 10%, 20%, 30%, 40%, and 50% of values from one or two coordinates. ● This approach allowed for a comprehensive evaluation of the algorithms under different levels of data incompleteness. Evaluation Metrics - The performance of the clustering algorithms was assessed using the Adjusted Rand Index (ARI) and Normalized Mutual Information (NMI). - These metrics quantify the similarity between clustering results and true labels, providing insights into the effectiveness of each method.
  • 9.
    Key Findings Clustering Performancewith One Coordinate Missing ● K-Mahal consistently outperformed Unified K-Means and K-Means across various levels of data incompleteness. ○ At 10% missing data, K-Mahal achieved an NMI of 0.914, compared to 0.758 for both Unified K- Means and K-Means. ○ At 50% missing data, K-Mahal maintained a higher NMI of 0.904, while the other two methods dropped to 0.757 and 0.730, respectively. Clustering Performance with Two Coordinates Missing ● Performance of all algorithms declined when two coordinates were missing. ○ At 10% missing data, K-Mahal's NMI was 0.901, while Unified K-Means and K-Means achieved 0.758 and 0.747, respectively. ○ At 50% missing data, K-Mahal's NMI dropped to 0.539, still outperforming Unified K-Means (0.570) and K-Means (0.553).
  • 10.
    Key Findings Adjusted RandIndex (ARI) Trends ● K-Mahal demonstrated superior ARI values across different levels of missing data. ○ With 10% missing data, K-Mahal achieved an ARI of 0.978, significantly higher than Unified K- Means (0.888) and K-Means (0.967). ○ Even at 50% missing data, K-Mahal's ARI remained at 0.895, showcasing its robustness against data incompleteness.
  • 11.
    Applications Healthcare: ● K-Mahal canbe used to cluster patient data with missing values, enabling more effective patient segmentation and personalized treatment plans. ● This is particularly important in medical datasets, where incomplete information is common due to reasons like patient non-compliance or data entry errors. Finance: ● In financial analysis, K-Mahal can help identify customer segments for targeted marketing campaigns, even with incomplete customer data. ● This capability allows financial institutions to make informed decisions, thereby improving customer relationship management. Image Processing: ● K-Mahal can be applied to image segmentation tasks where pixel data may be missing or corrupted. ● By clustering incomplete image data effectively, it enhances image analysis and object detection processes.
  • 12.
    Conclusion and FutureWork Research Outcomes ● The study demonstrated that K-Mahal, which integrates Mahalanobis distance with a unified approach to imputation and clustering, significantly outperforms traditional K-Means and Unified K-Means algorithms, especially in scenarios with incomplete data. ○ For example, K-Mahal achieved an Adjusted Rand Index (ARI) of 0.978 at 10% missing data, compared to 0.888 for Unified K-Means and 0.967 for K-Means. Potential Improvements ● Future work could focus on developing specialized imputation techniques tailored for elliptical clusters, potentially further enhancing the performance of K-Mahal with higher levels of missing data. ● This could involve exploring advanced methods like multiple imputation or regression imputation to better estimate missing values. Broader Implications ● The findings suggest that integrating imputation directly into clustering algorithms can lead to more robust and reliable clustering outcomes, particularly in fields where data incompleteness is common, such as healthcare and finance.
  • 13.
    Key References 1. Ahmed,M., Seraj, R., & Islam, S. M. S. (2020). The k-means algorithm: A comprehensive survey and performance evaluation. Electronics, 9(8), 1295. 2. Dempster, A. P., Laird, N. M., & Rubin, D. B. (1977). Maximum likelihood from incomplete data via the EM algorithm. Journal of the Royal Statistical Society: Series B (Methodological), 39(1), 1–22. 3. Melnykov, I., & Melnykov, V. (2014). On k-means algorithm with the use of Mahalanobis distances. Statistics & Probability Letters, 84, 88–95. 4. Little, R. J. A., & Rubin, D. B. (2002). Statistical Analysis with Missing Data. John Wiley & Sons. 5. Wang, S., et al. (2019). K-means clustering with incomplete data. IEEE Access, 7, 69162–69171. 6. Strehl, A., & Ghosh, J. (2002). Cluster ensembles—a knowledge reuse framework for combining multiple partitions. Journal of Machine Learning Research, 3, 583–617.

Editor's Notes

  • #5 if the dimensions (columns in your dataset) are correlated to one another, which is typically the case in real-world datasets, the Euclidean distance between a point and the center of the points (distribution) can give little or misleading information about how close a point really is to the cluster.