Downloaded 48 times


![40
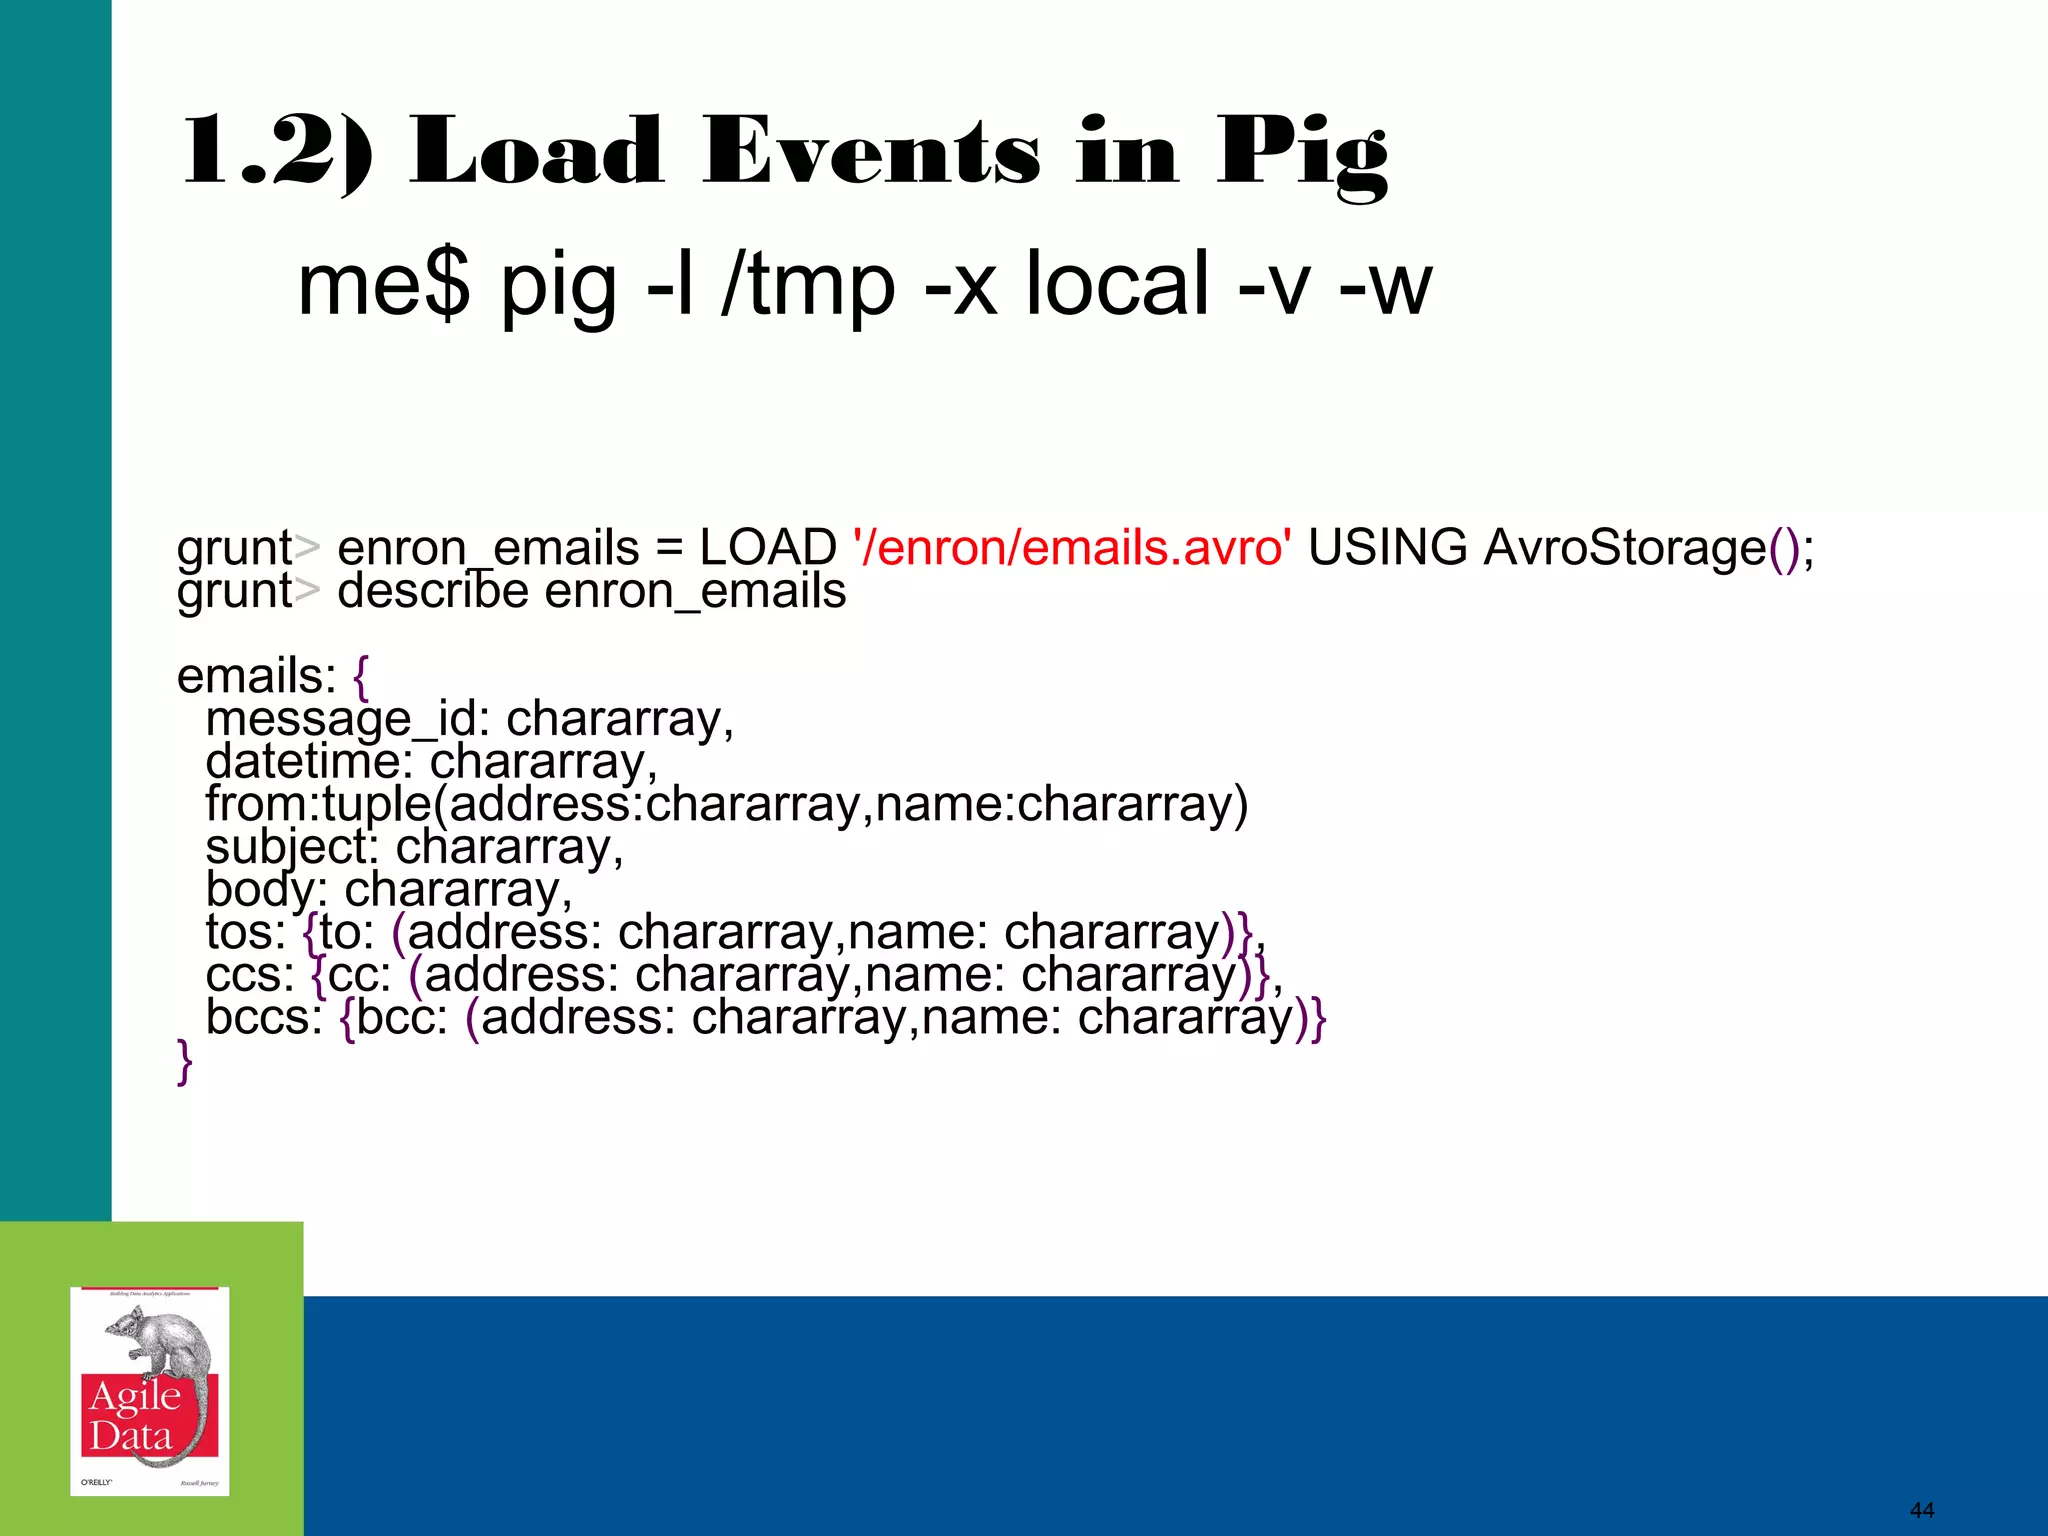
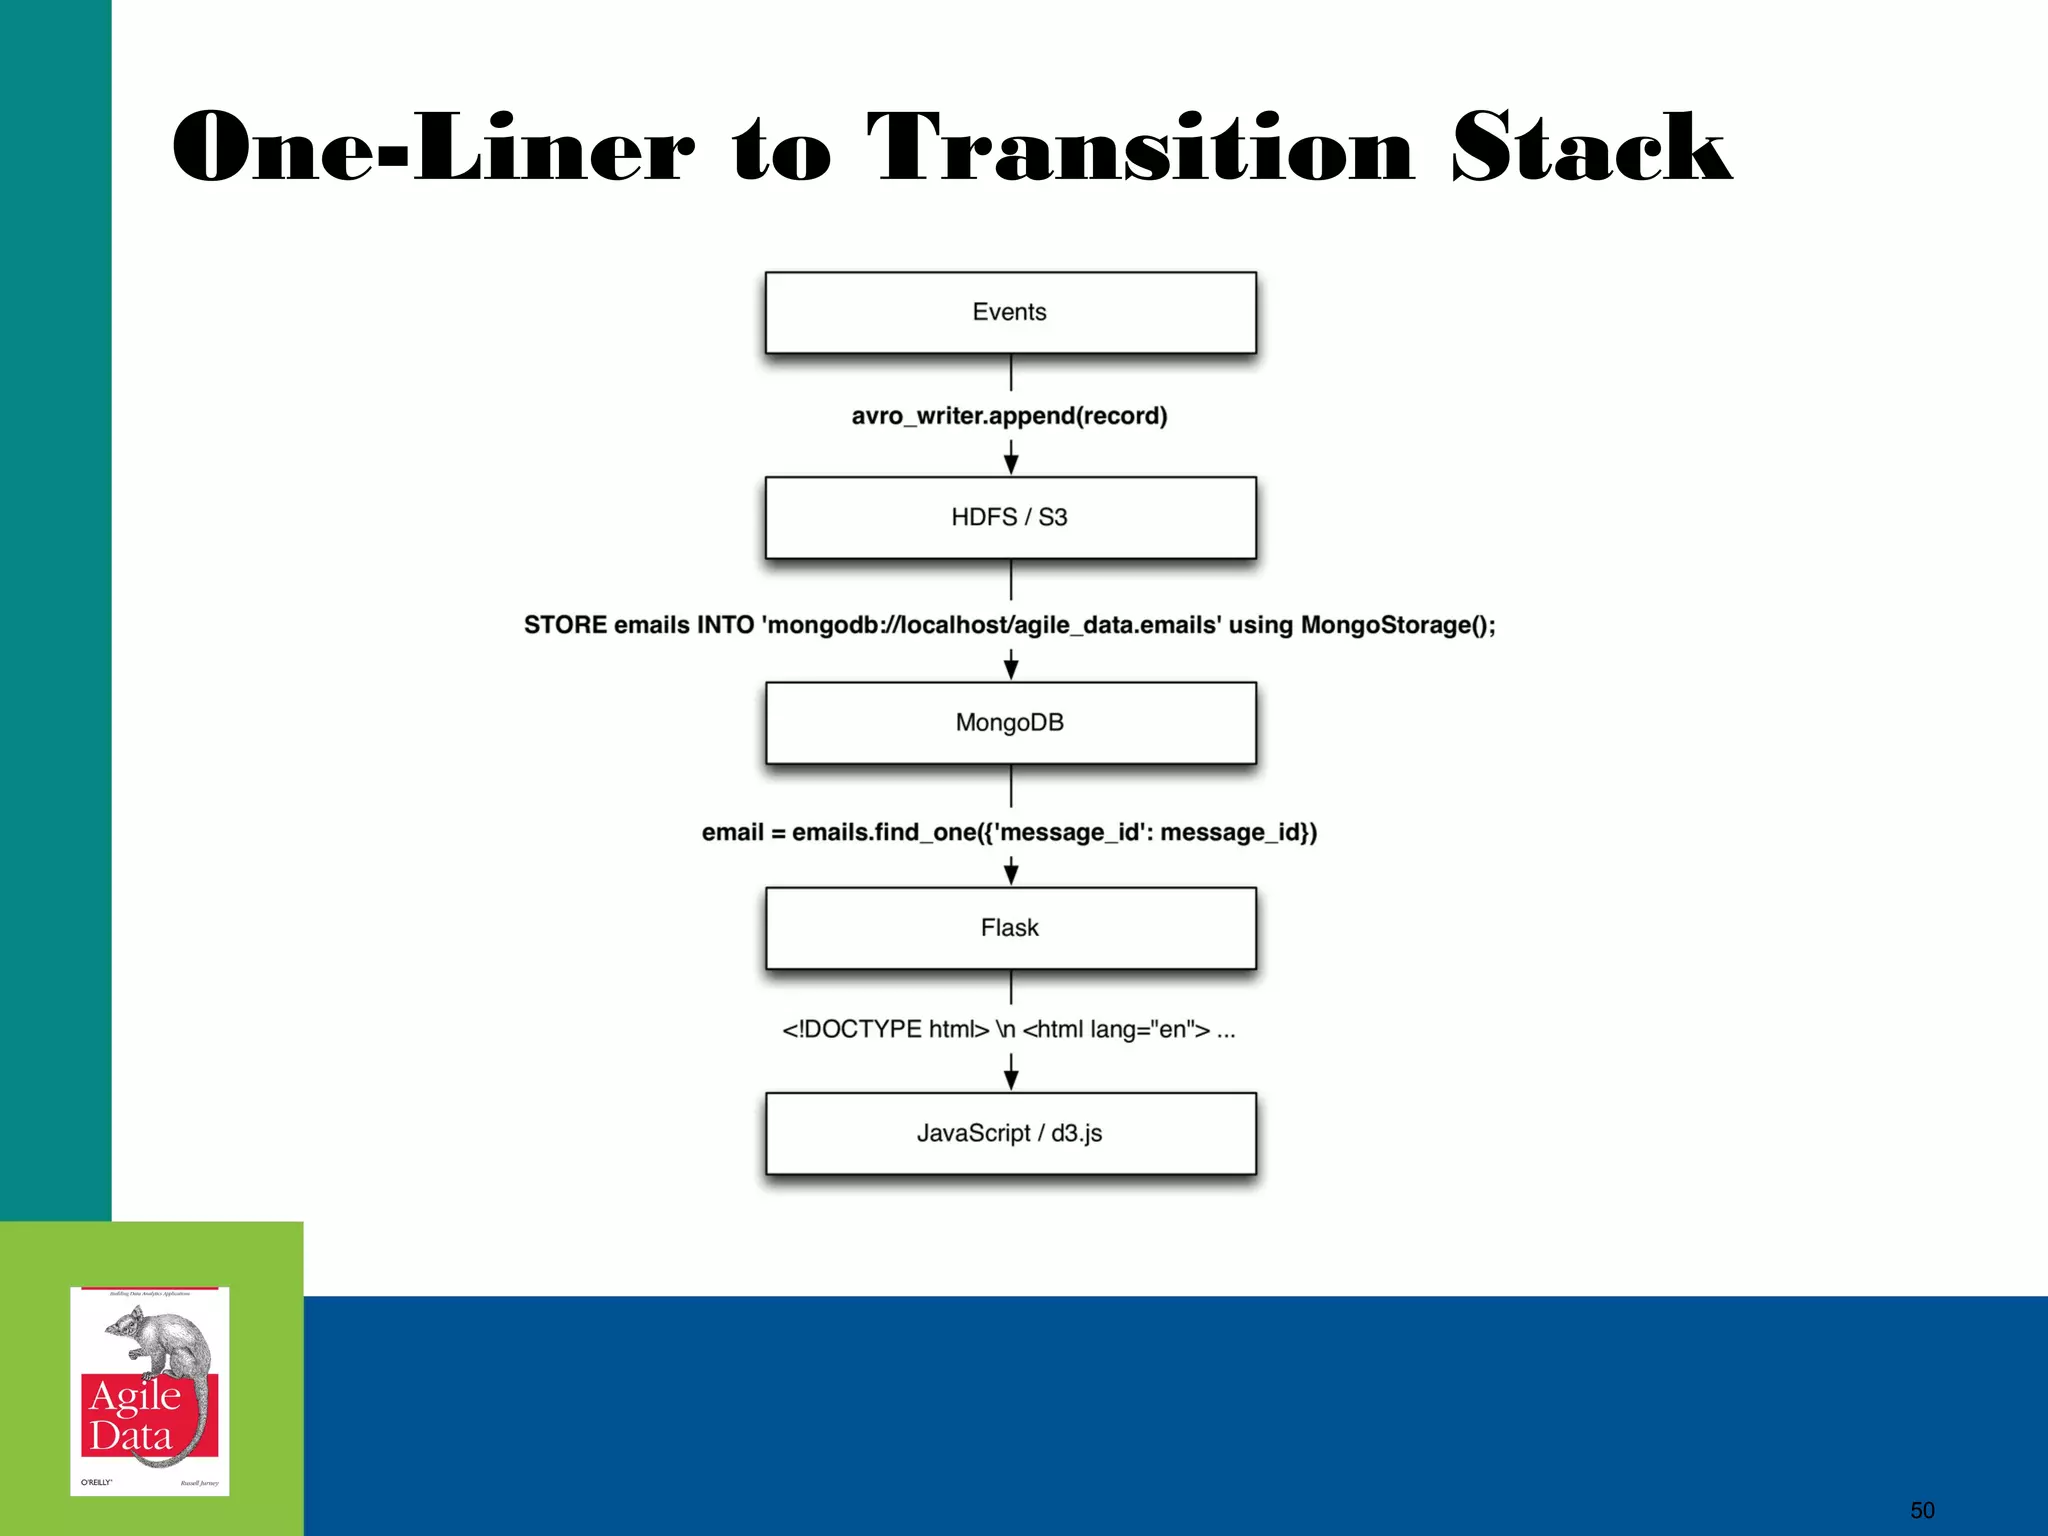
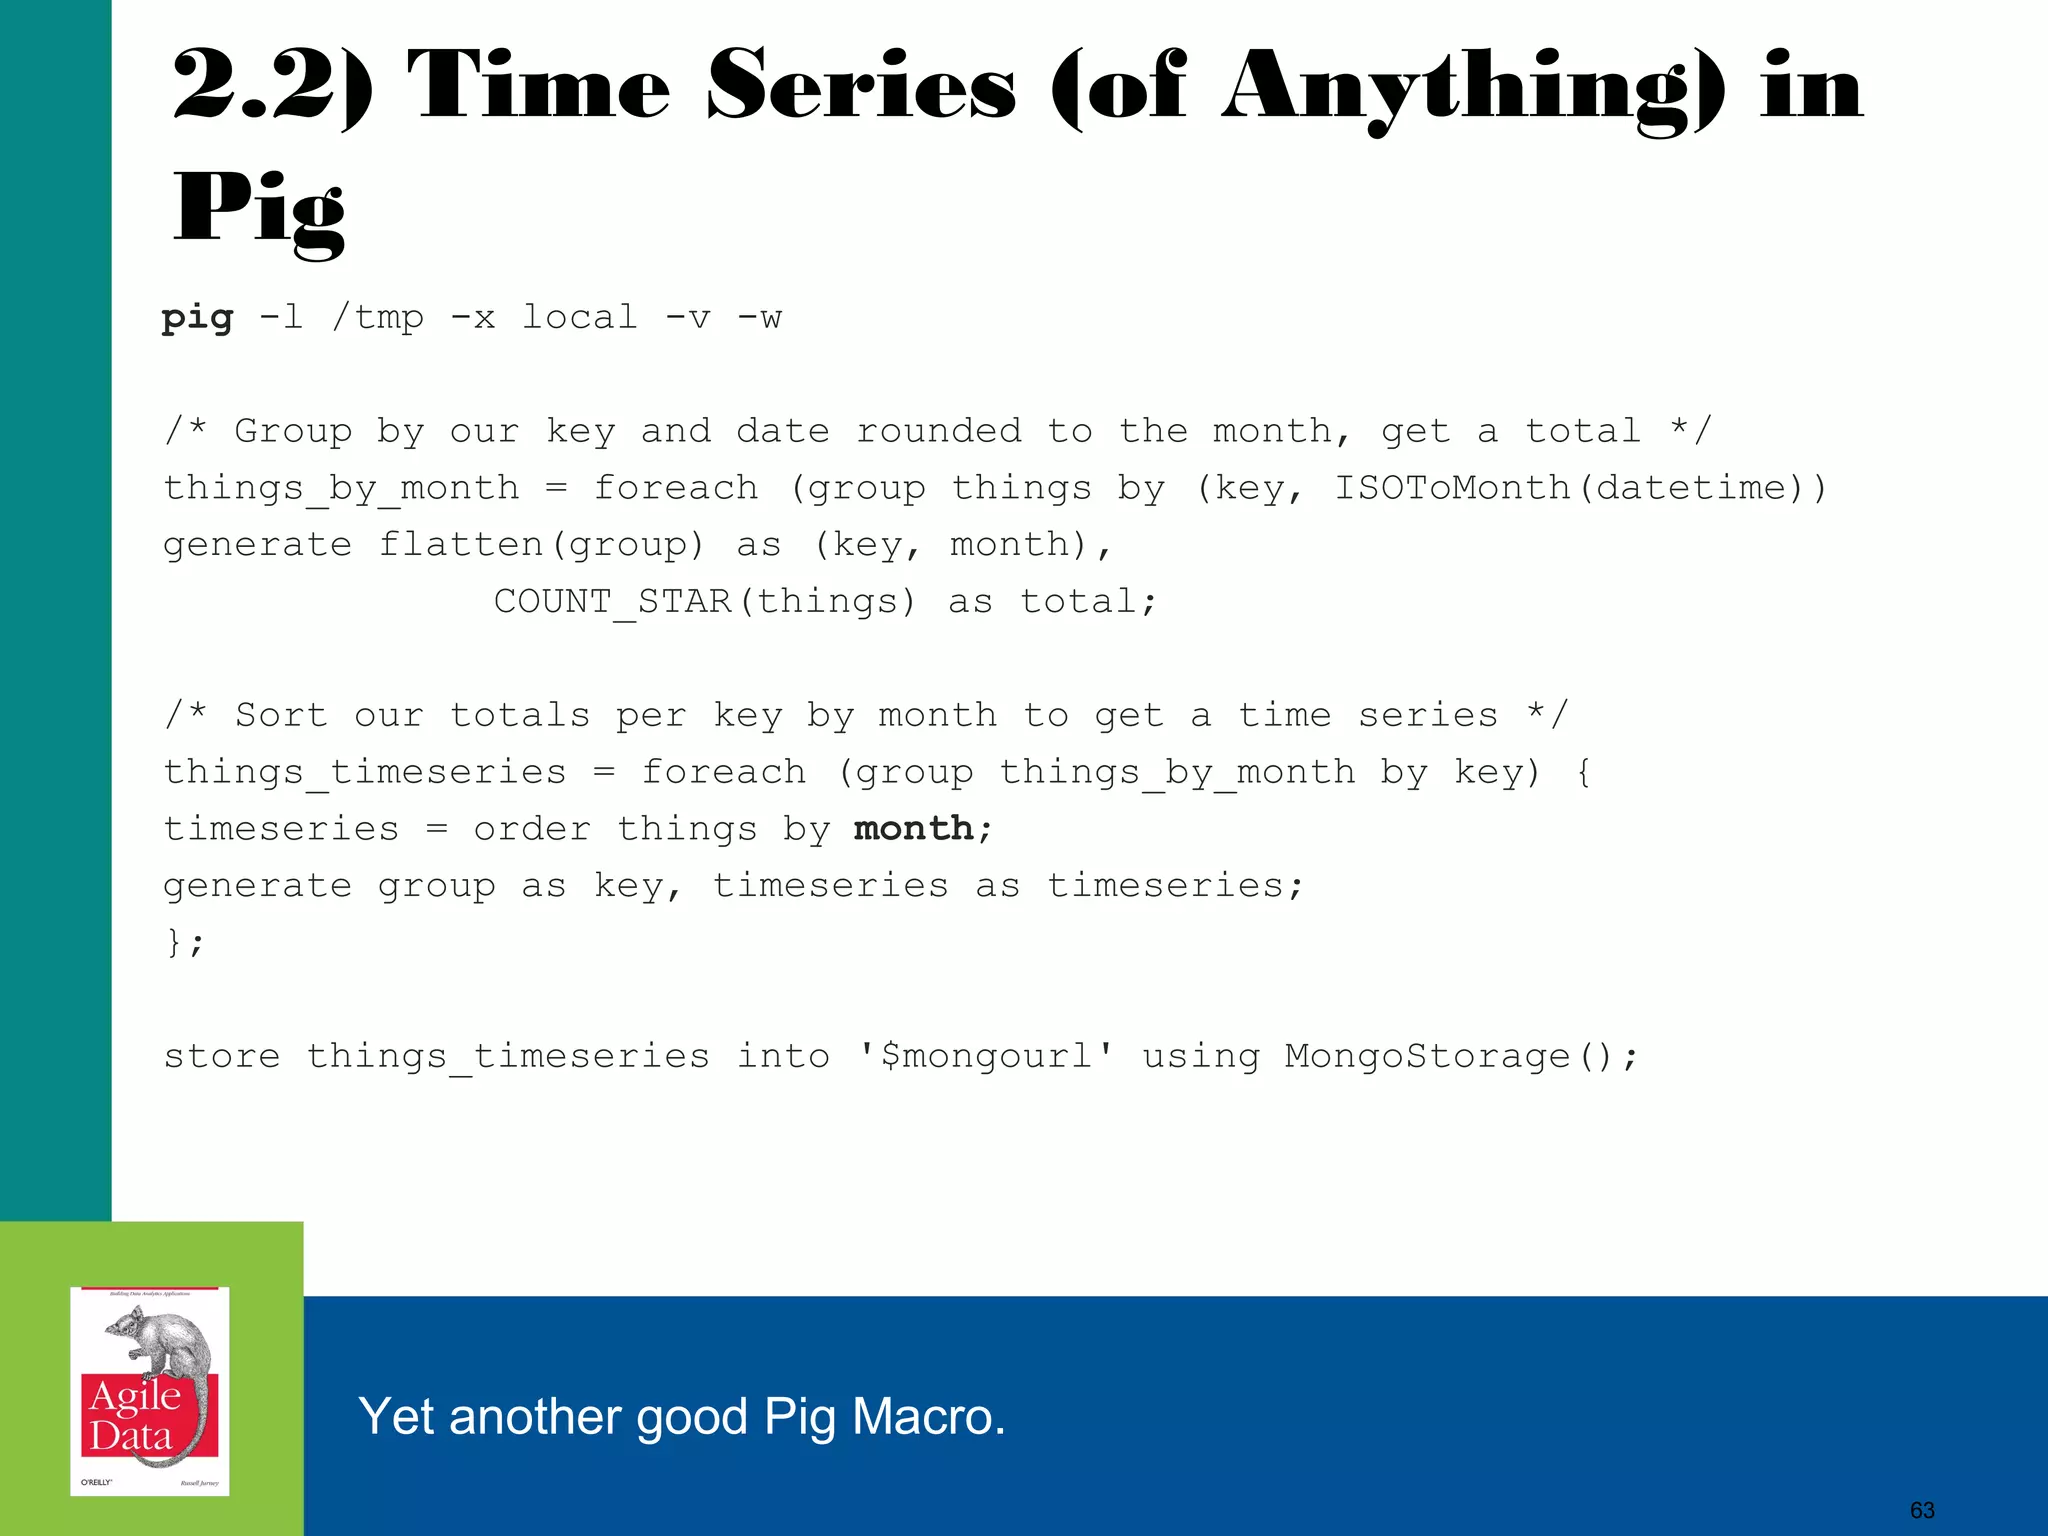
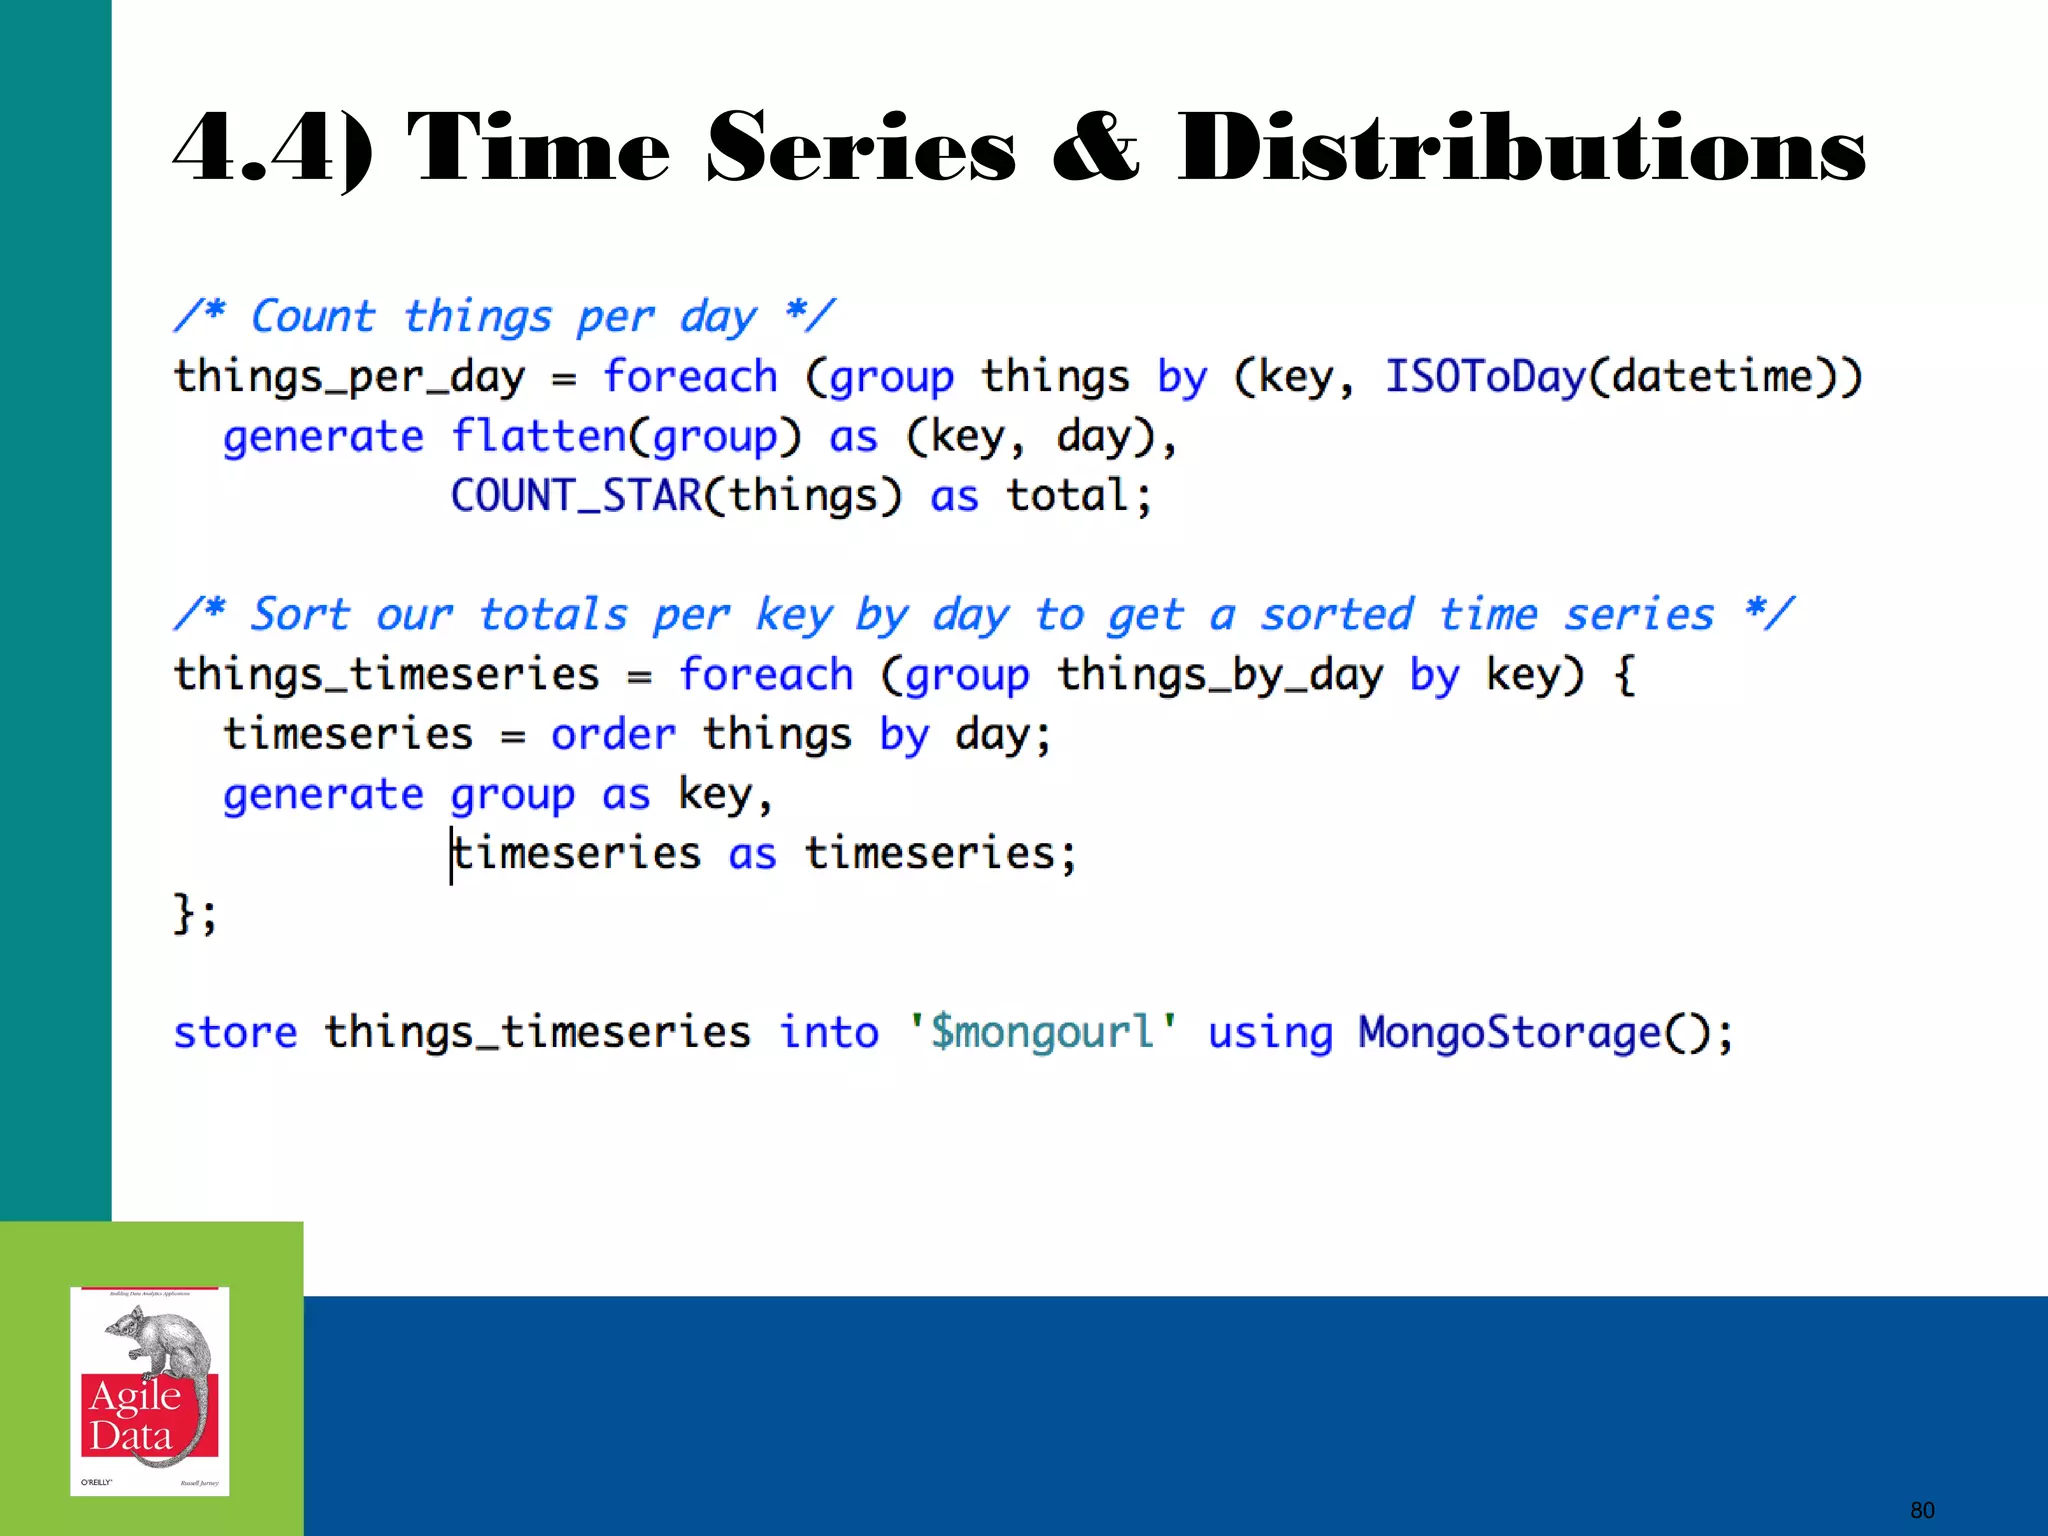
0.2) Serialize Events From
Streamsclass GmailSlurper(object):
...
def init_imap(self, username, password):
self.username = username
self.password = password
try:
imap.shutdown()
except:
pass
self.imap = imaplib.IMAP4_SSL('imap.gmail.com', 993)
self.imap.login(username, password)
self.imap.is_readonly = True
...
def write(self, record):
self.avro_writer.append(record)
...
def slurp(self):
if(self.imap and self.imap_folder):
for email_id in self.id_list:
(status, email_hash, charset) = self.fetch_email(email_id)
if(status == 'OK' and charset and 'thread_id' in email_hash and 'froms' in email_hash):
print email_id, charset, email_hash['thread_id']
self.write(email_hash)
Scrape your own gmail in Python and Ruby.
40](https://image.slidesharecdn.com/jurneyjune26205210a-140425125833-phpapp02/75/Agile-Data-Science-Building-Hadoop-Analytics-Applications-40-2048.jpg)


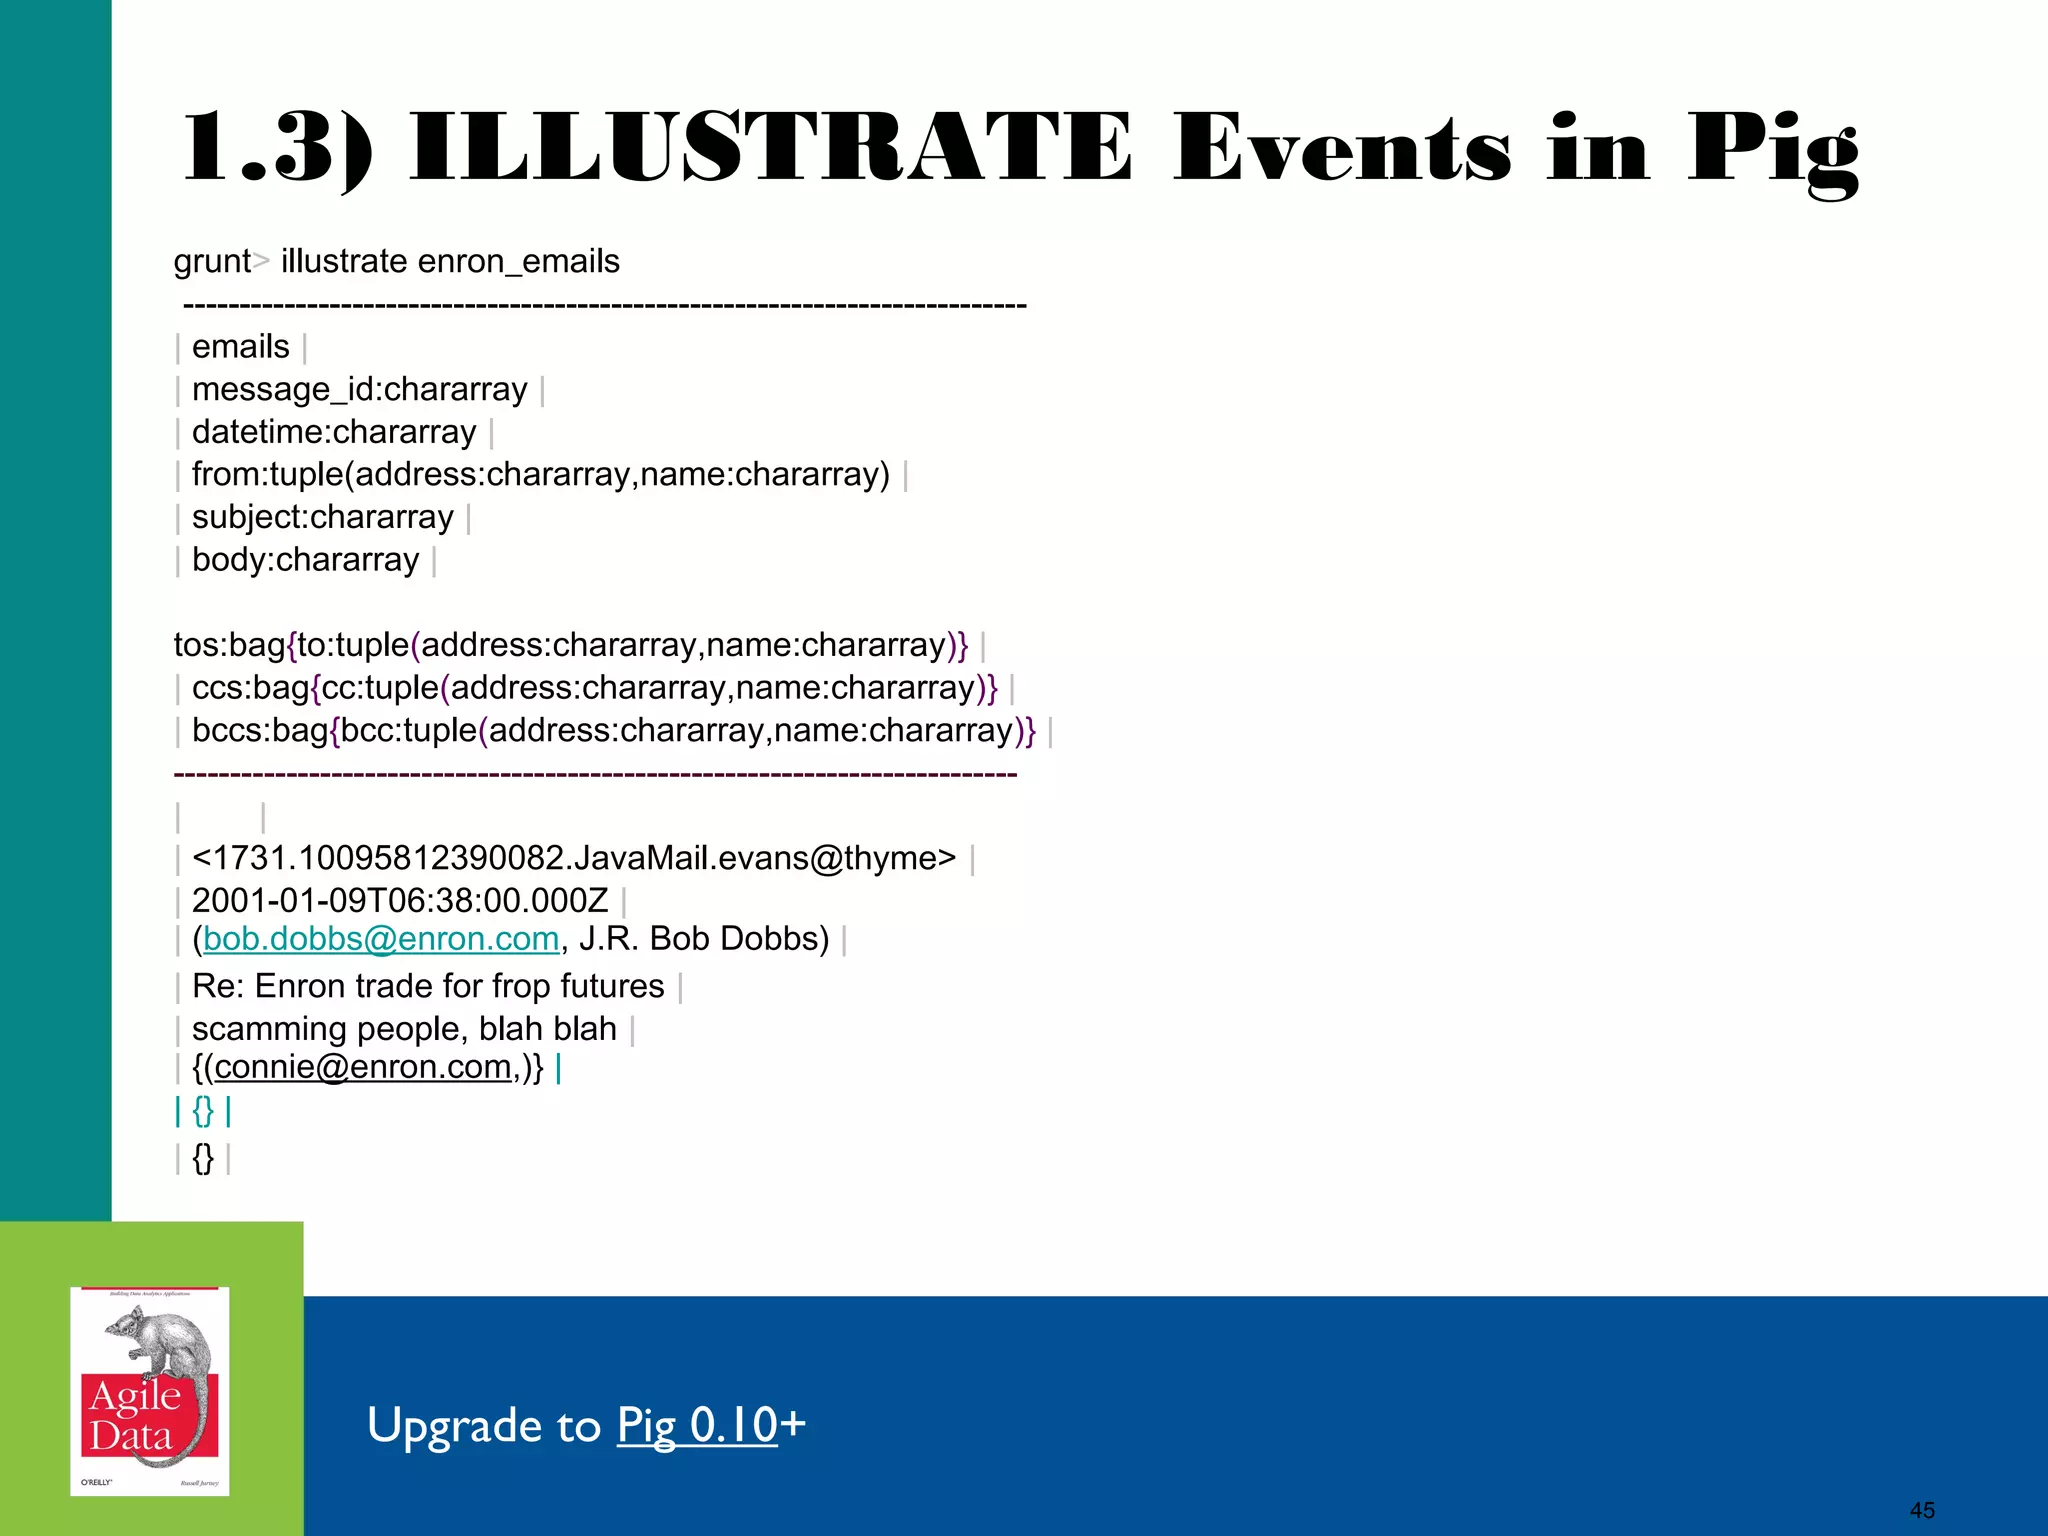
![43
1.1) Cat Avro Serialized Events
me$ cat_avro ~/Data/enron.avro
{
u'bccs': [],
u'body': u'scamming people, blah blah',
u'ccs': [], u'date': u'2000-08-28T01:50:00.000Z',
u'from': {u'address': u'bob.dobbs@enron.com', u'name': None},
u'message_id': u'<1731.10095812390082.JavaMail.evans@thyme>',
u'subject': u'Re: Enron trade for frop futures',
u'tos': [
{u'address': u'connie@enron.com', u'name': None}
]
}
Get cat_avro in python, ruby
43](https://image.slidesharecdn.com/jurneyjune26205210a-140425125833-phpapp02/75/Agile-Data-Science-Building-Hadoop-Analytics-Applications-43-2048.jpg)
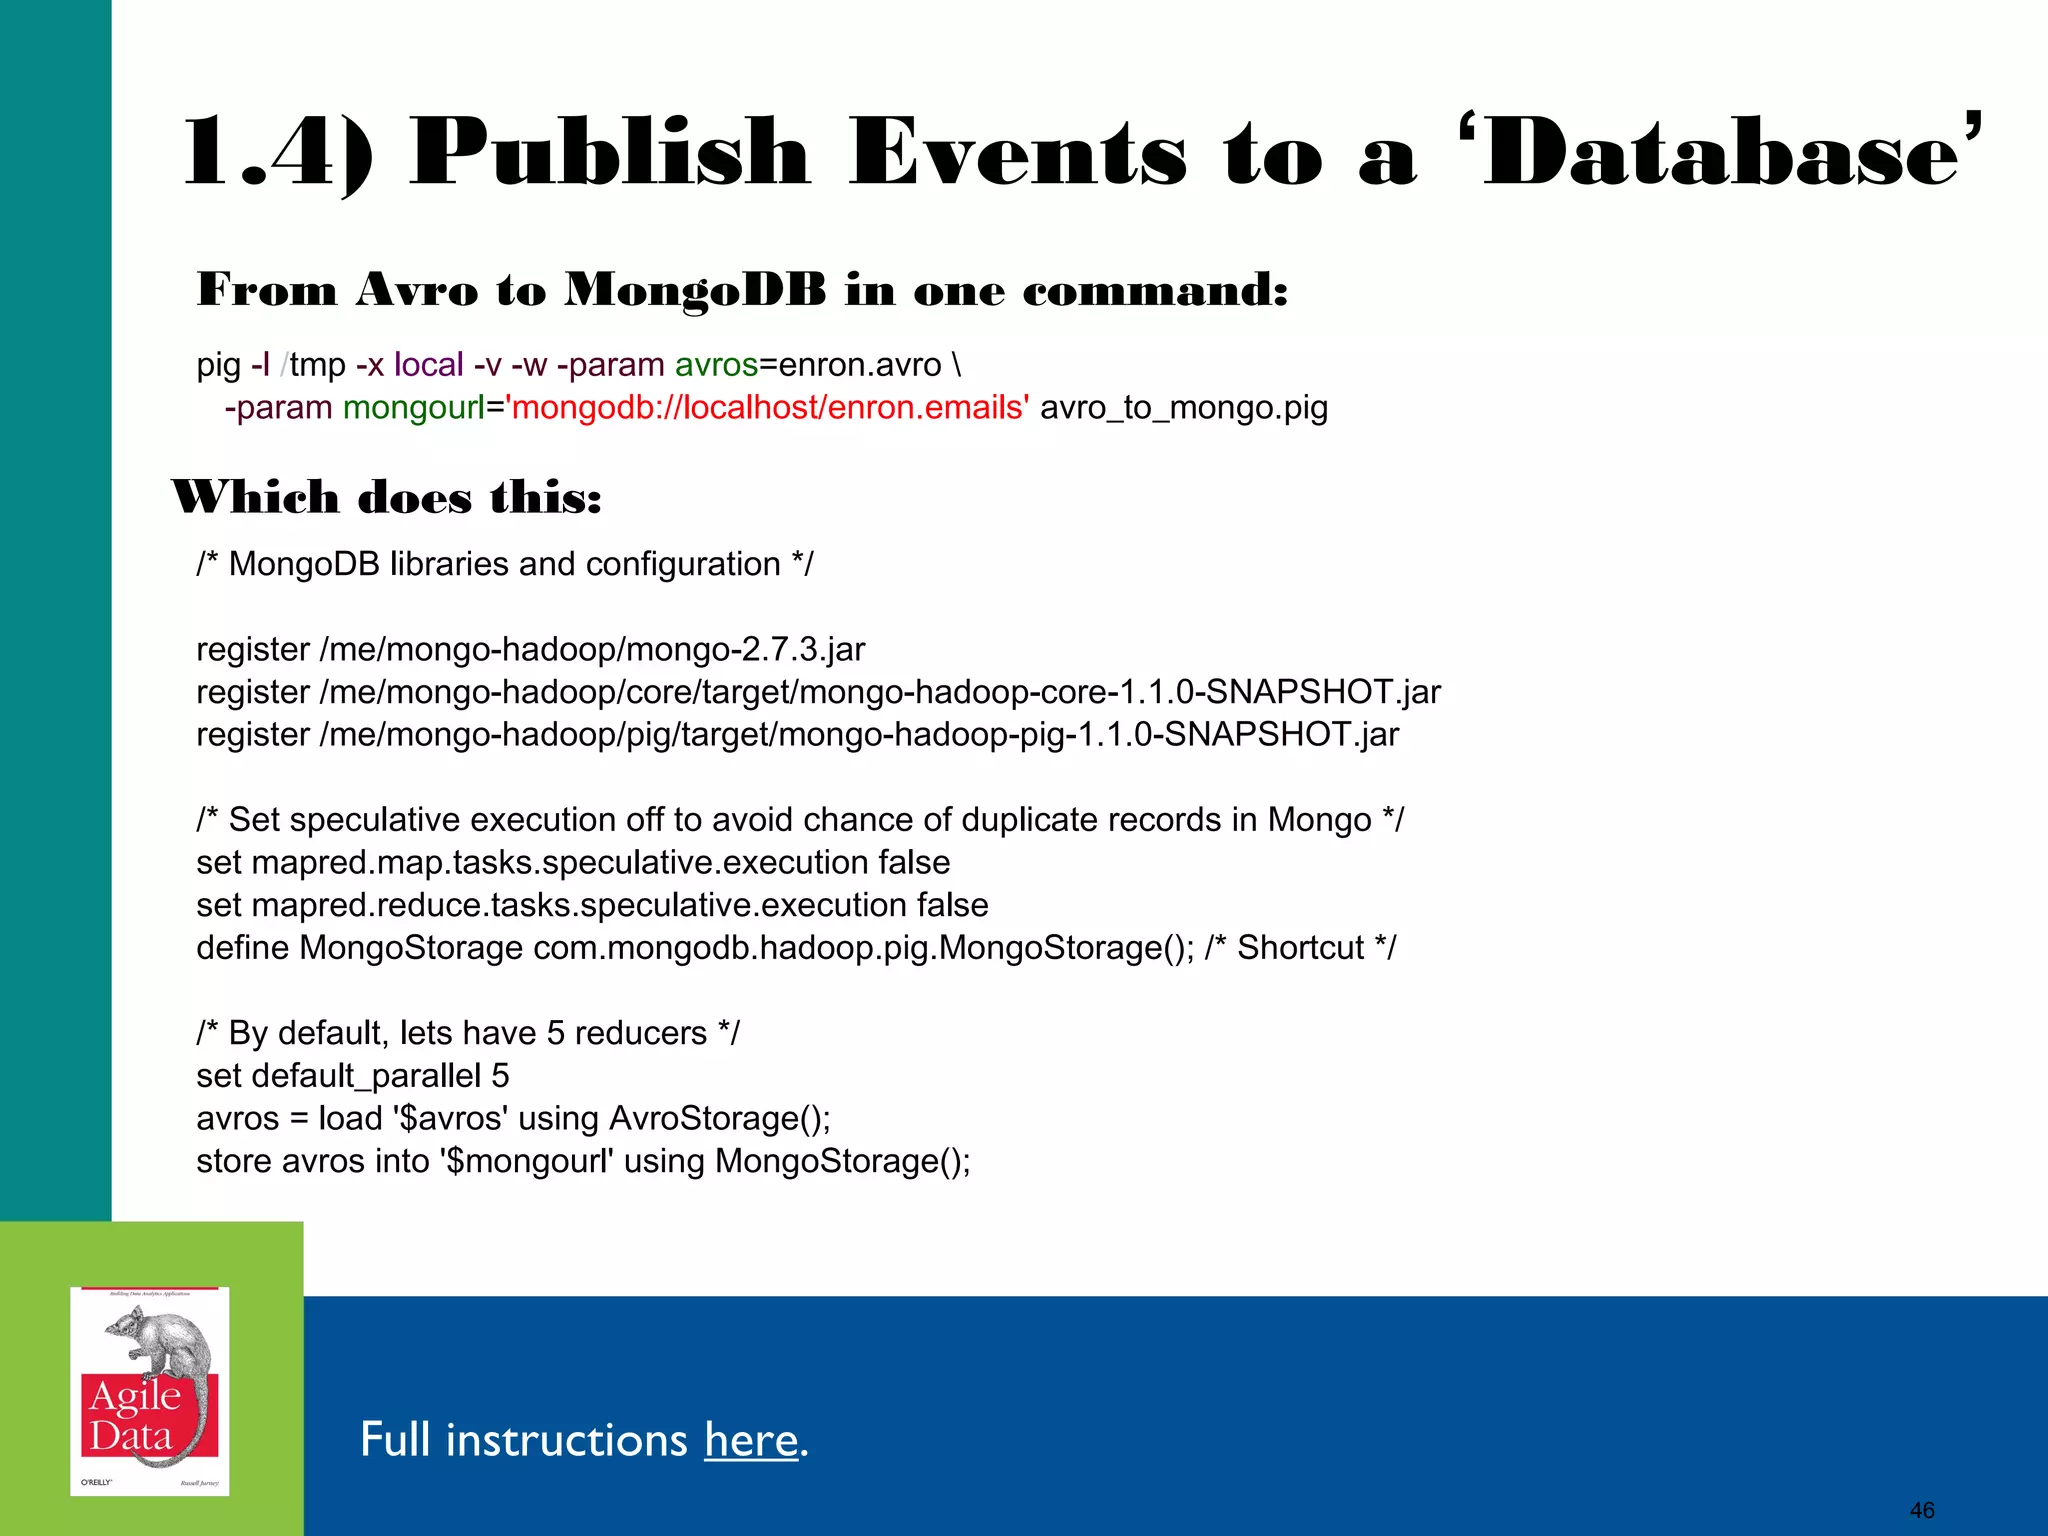
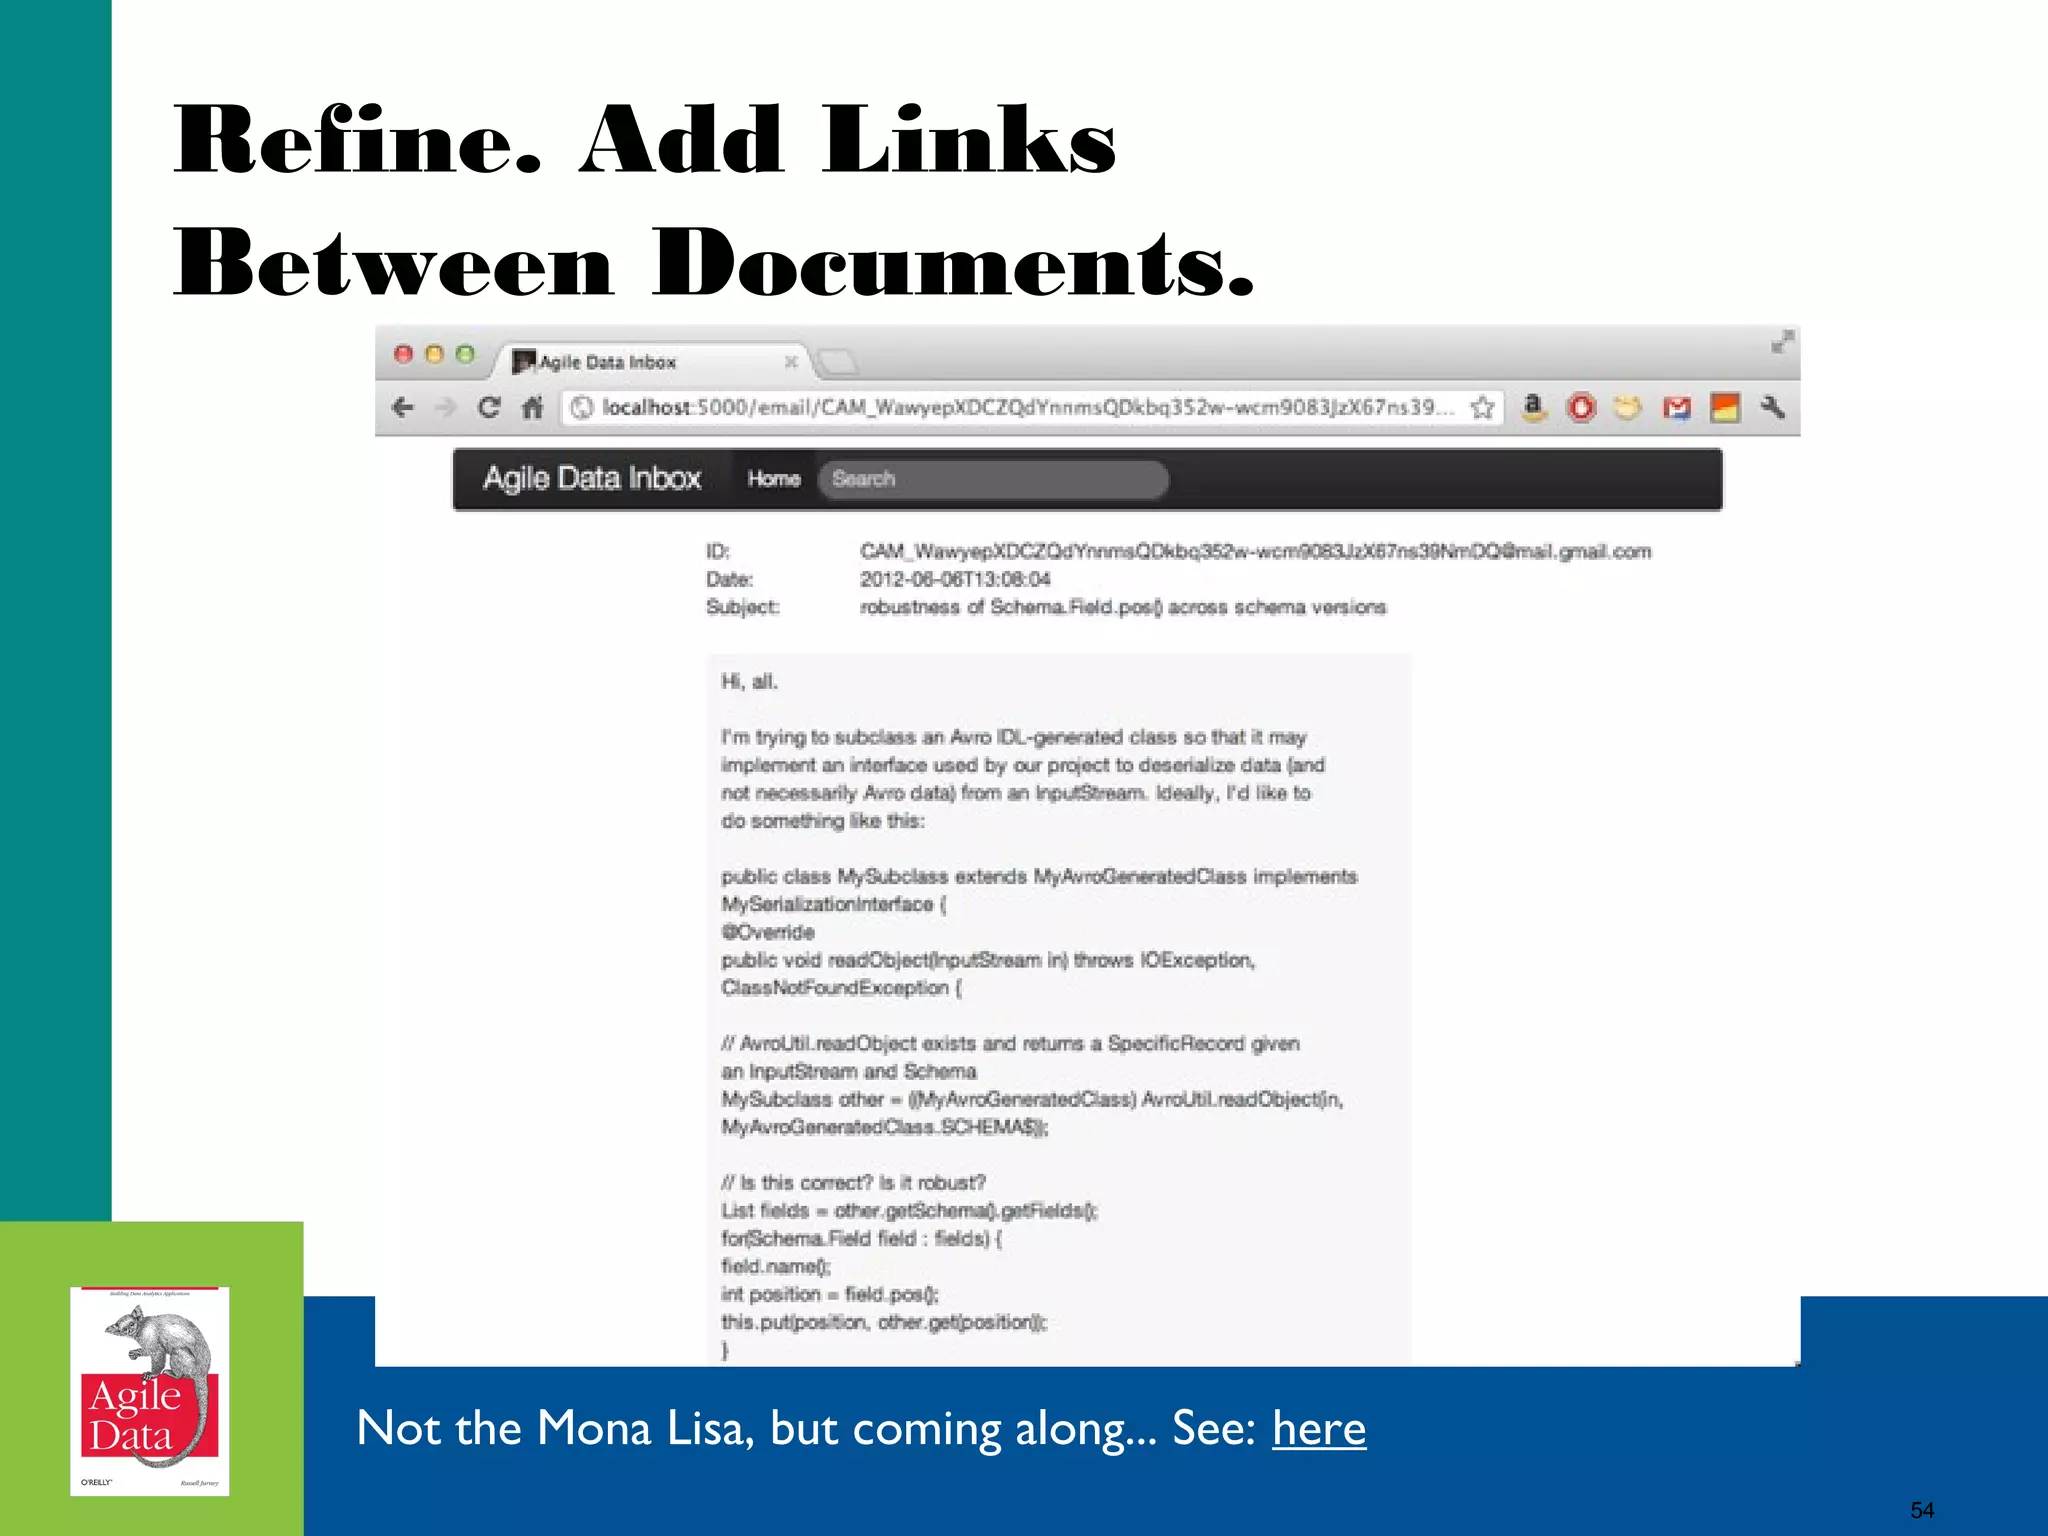
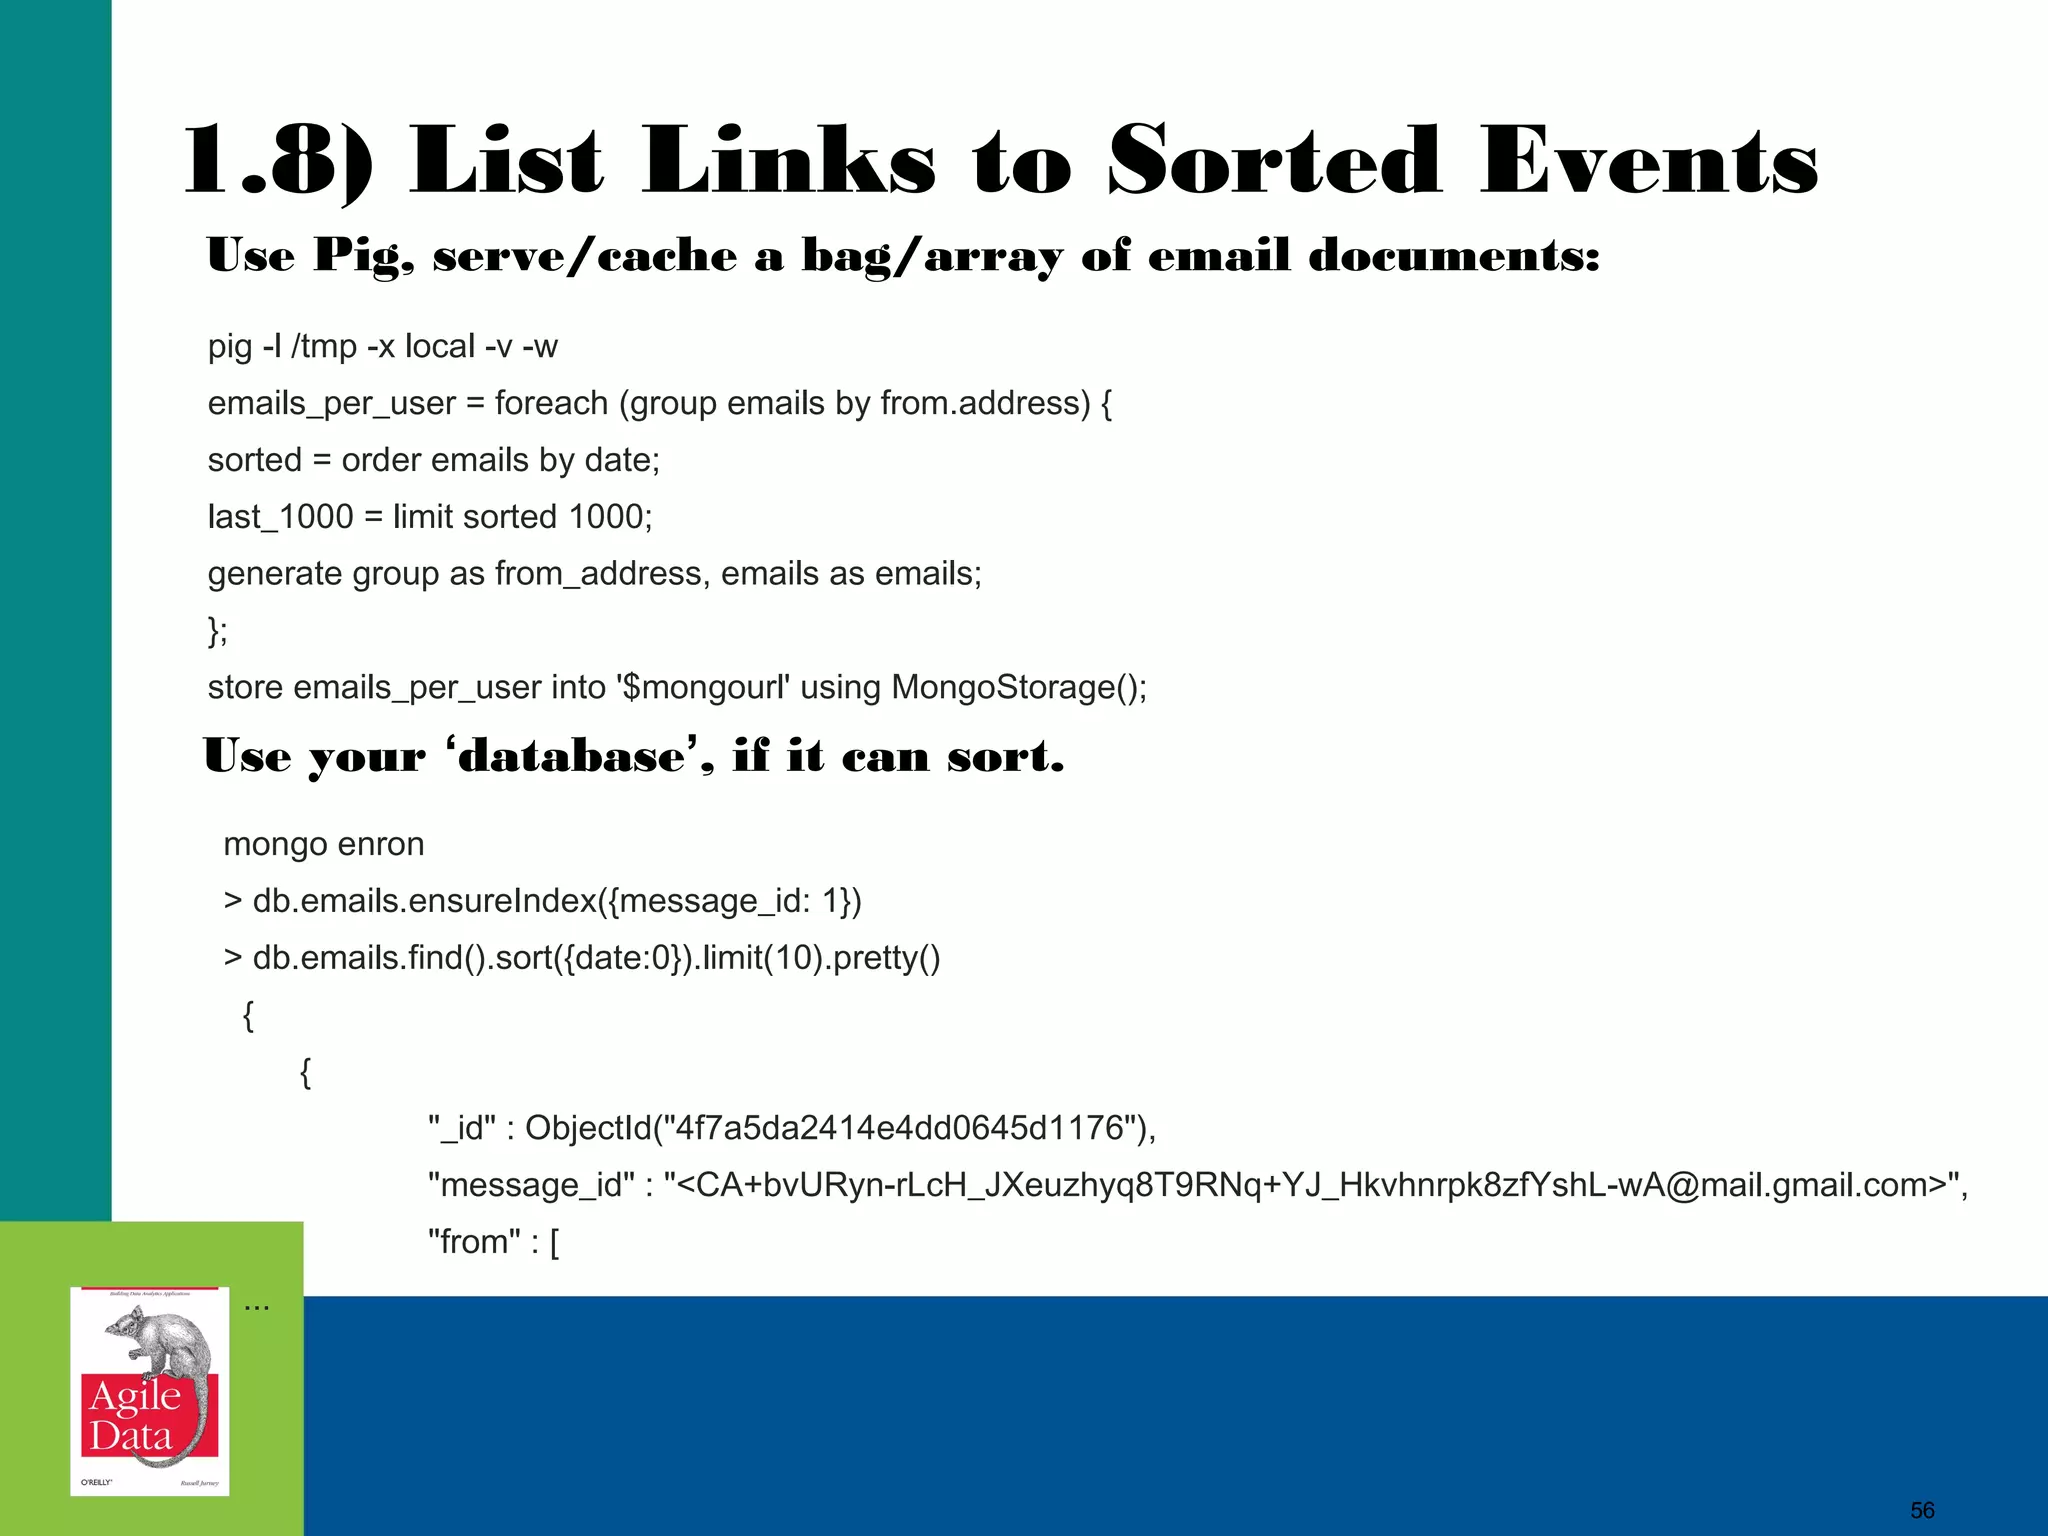
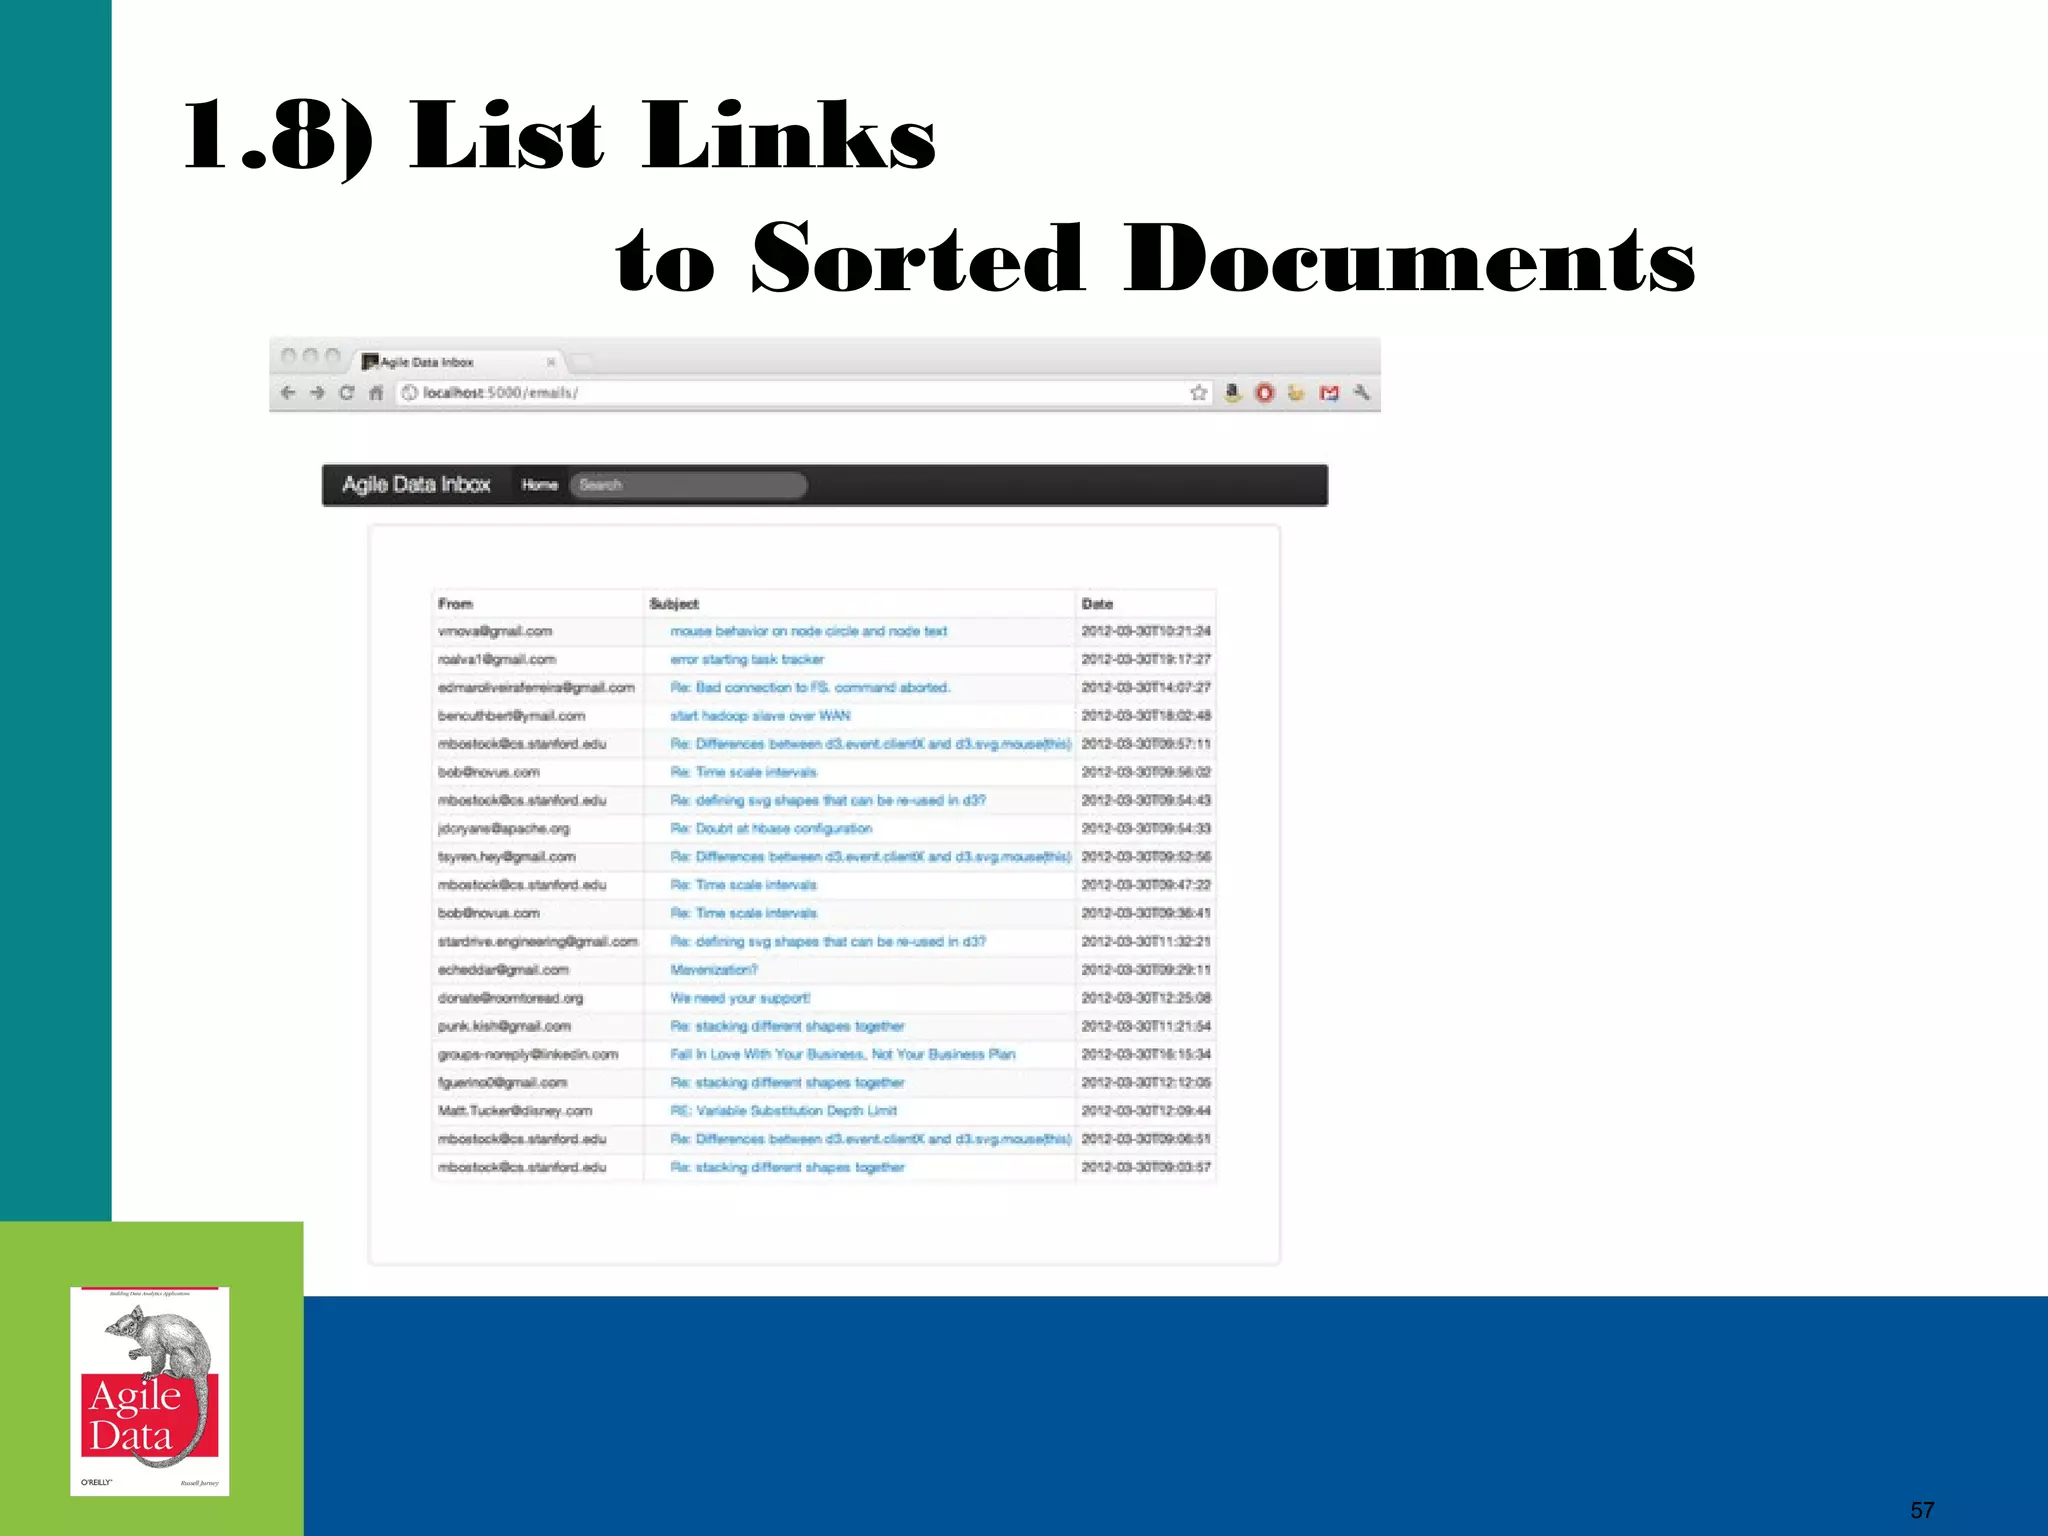
![47
1.5) Check Events in ‘Database’
$ mongo enron
MongoDB shell version: 2.0.2
connecting to: enron
show collections
Emails
system.indexes
>db.emails.findOne({message_id: "<1731.10095812390082.JavaMail.evans@thyme>"})
{
"_id" : ObjectId("502b4ae703643a6a49c8d180"),
"message_id" : "<1731.10095812390082.JavaMail.evans@thyme>",
"date" : "2001-01-09T06:38:00.000Z",
"from" : { "address" : "bob.dobbs@enron.com", "name" : "J.R. Bob Dobbs" },
"subject" : Re: Enron trade for frop futures,
"body" : "Scamming more people...",
"tos" : [ { "address" : "connie@enron", "name" : null } ],
"ccs" : [ ],
"bccs" : [ ]
}
47](https://image.slidesharecdn.com/jurneyjune26205210a-140425125833-phpapp02/75/Agile-Data-Science-Building-Hadoop-Analytics-Applications-47-2048.jpg)
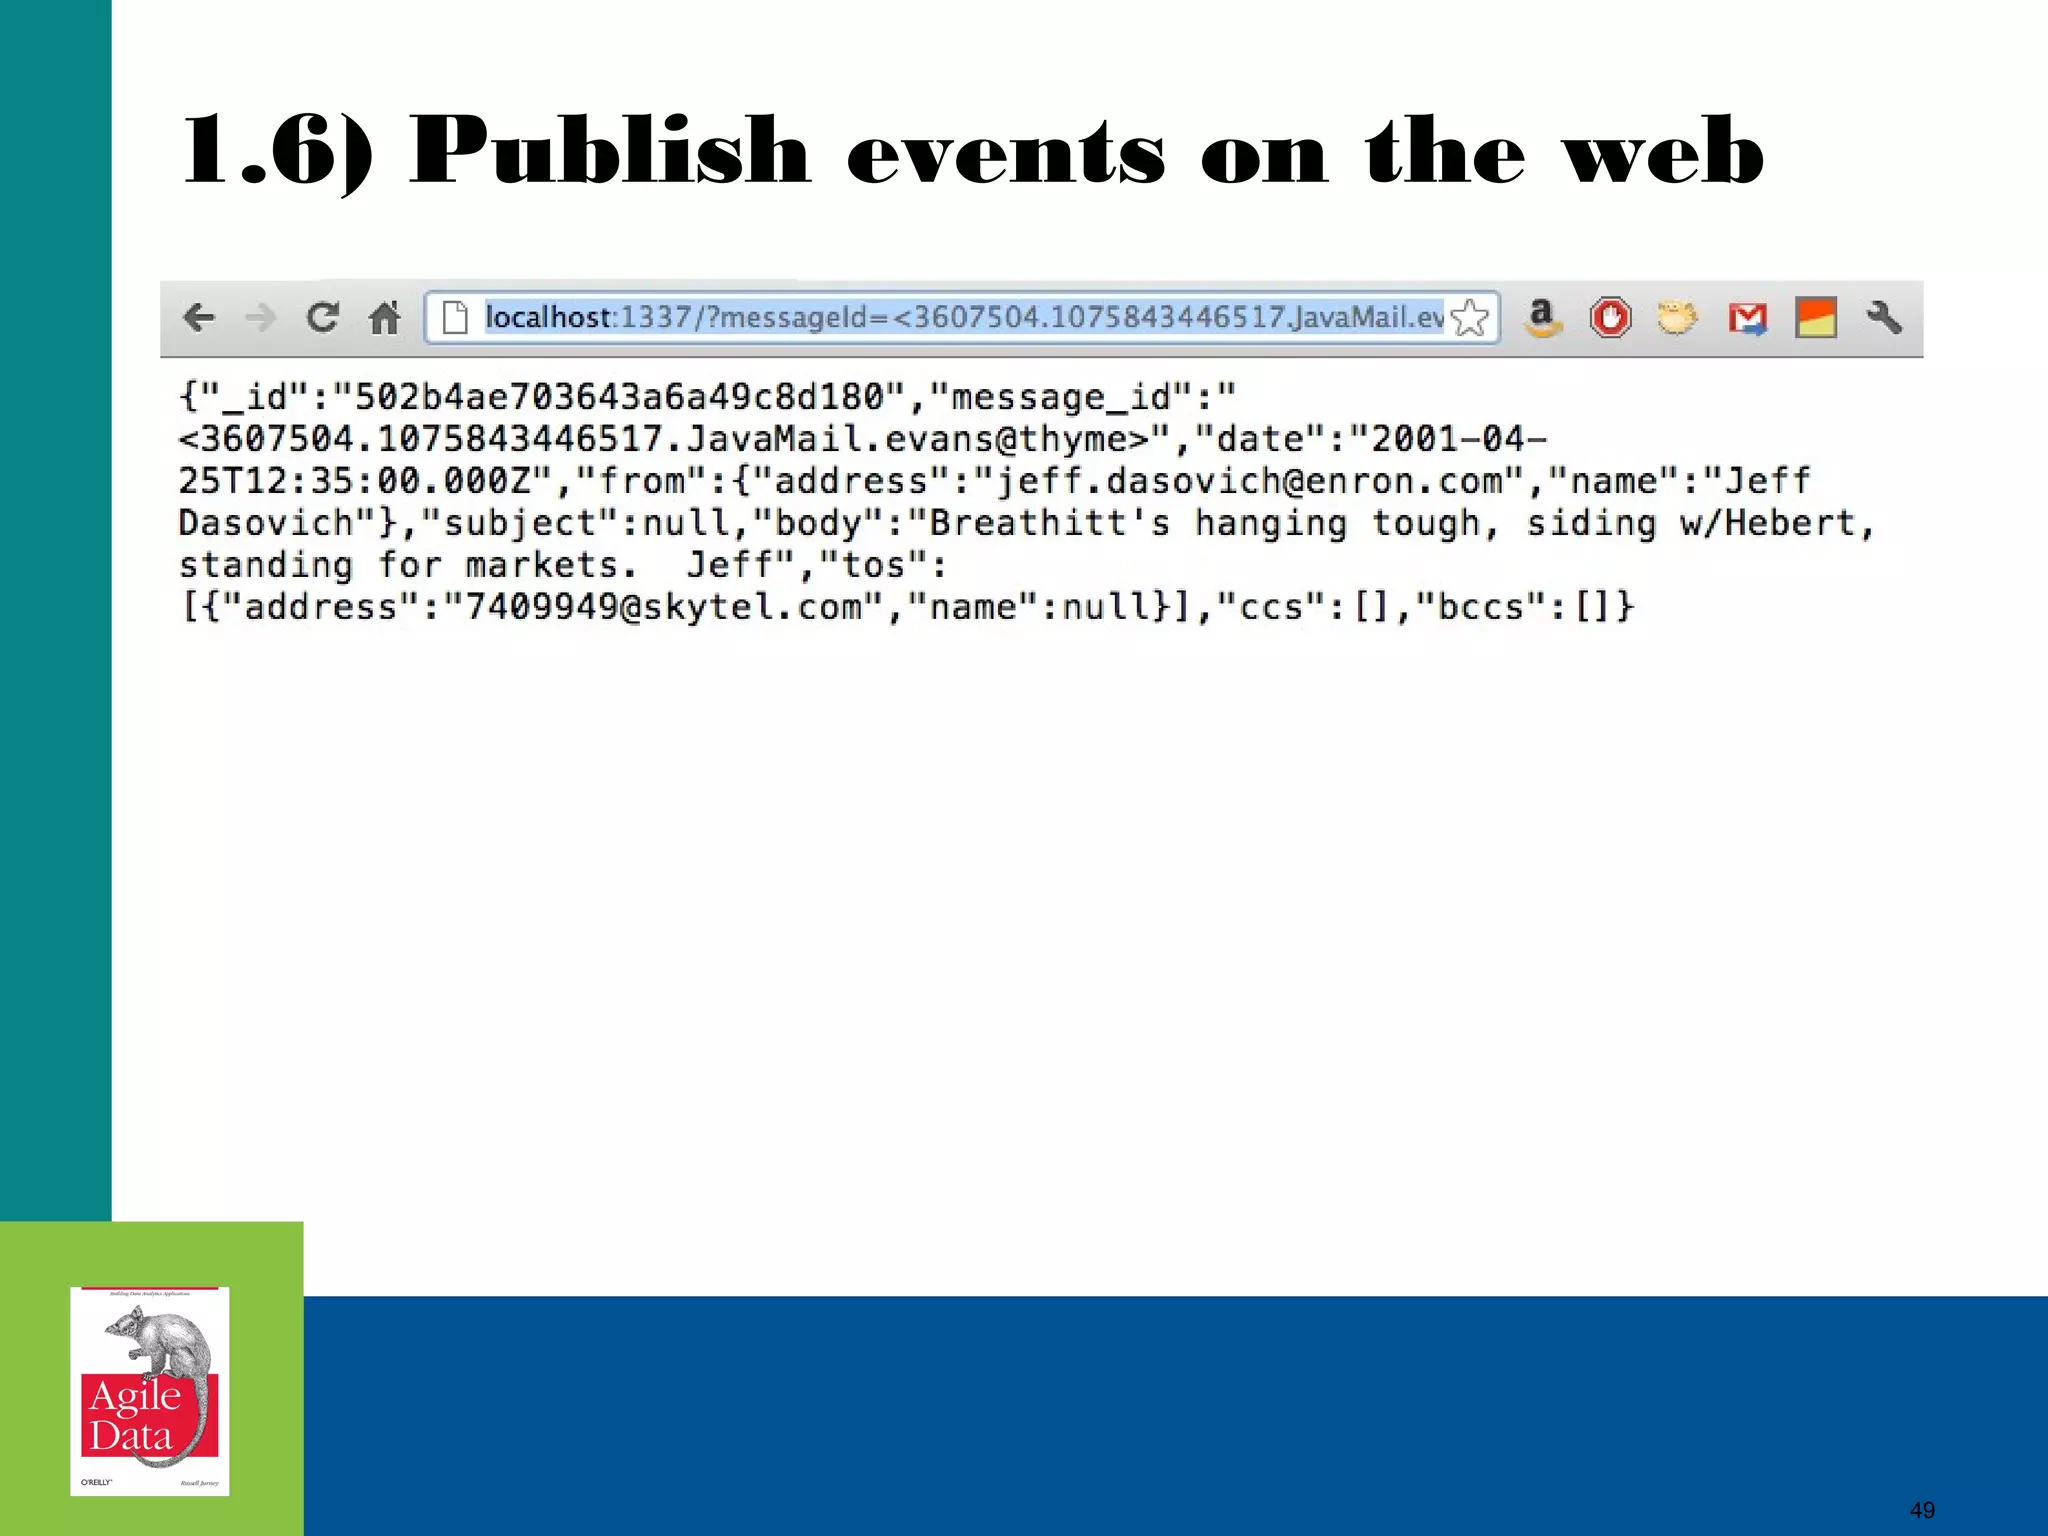
![48
1.6) Publish Events on the Web
require 'rubygems'
require 'sinatra'
require 'mongo'
require 'json'
connection = Mongo::Connection.new
database = connection['agile_data']
collection = database['emails']
get '/email/:message_id' do |message_id|
data = collection.find_one({:message_id => message_id})
JSON.generate(data)
end
48](https://image.slidesharecdn.com/jurneyjune26205210a-140425125833-phpapp02/75/Agile-Data-Science-Building-Hadoop-Analytics-Applications-48-2048.jpg)

![52
1.7) Wrap Events with Bootstrap
<link href="/static/bootstrap/docs/assets/css/bootstrap.css" rel="stylesheet">
</head>
<body>
<div class="container" style="margin-top: 100px;">
<table class="table table-striped table-bordered table-condensed">
<thead>
{% for key in data['keys'] %}
<th>{{ key }}</th>
{% endfor %}
</thead>
<tbody>
<tr>
{% for value in data['values'] %}
<td>{{ value }}</td>
{% endfor %}
</tr>
</tbody>
</table>
</div>
</body>
Complete example here with code here.
52](https://image.slidesharecdn.com/jurneyjune26205210a-140425125833-phpapp02/75/Agile-Data-Science-Building-Hadoop-Analytics-Applications-52-2048.jpg)


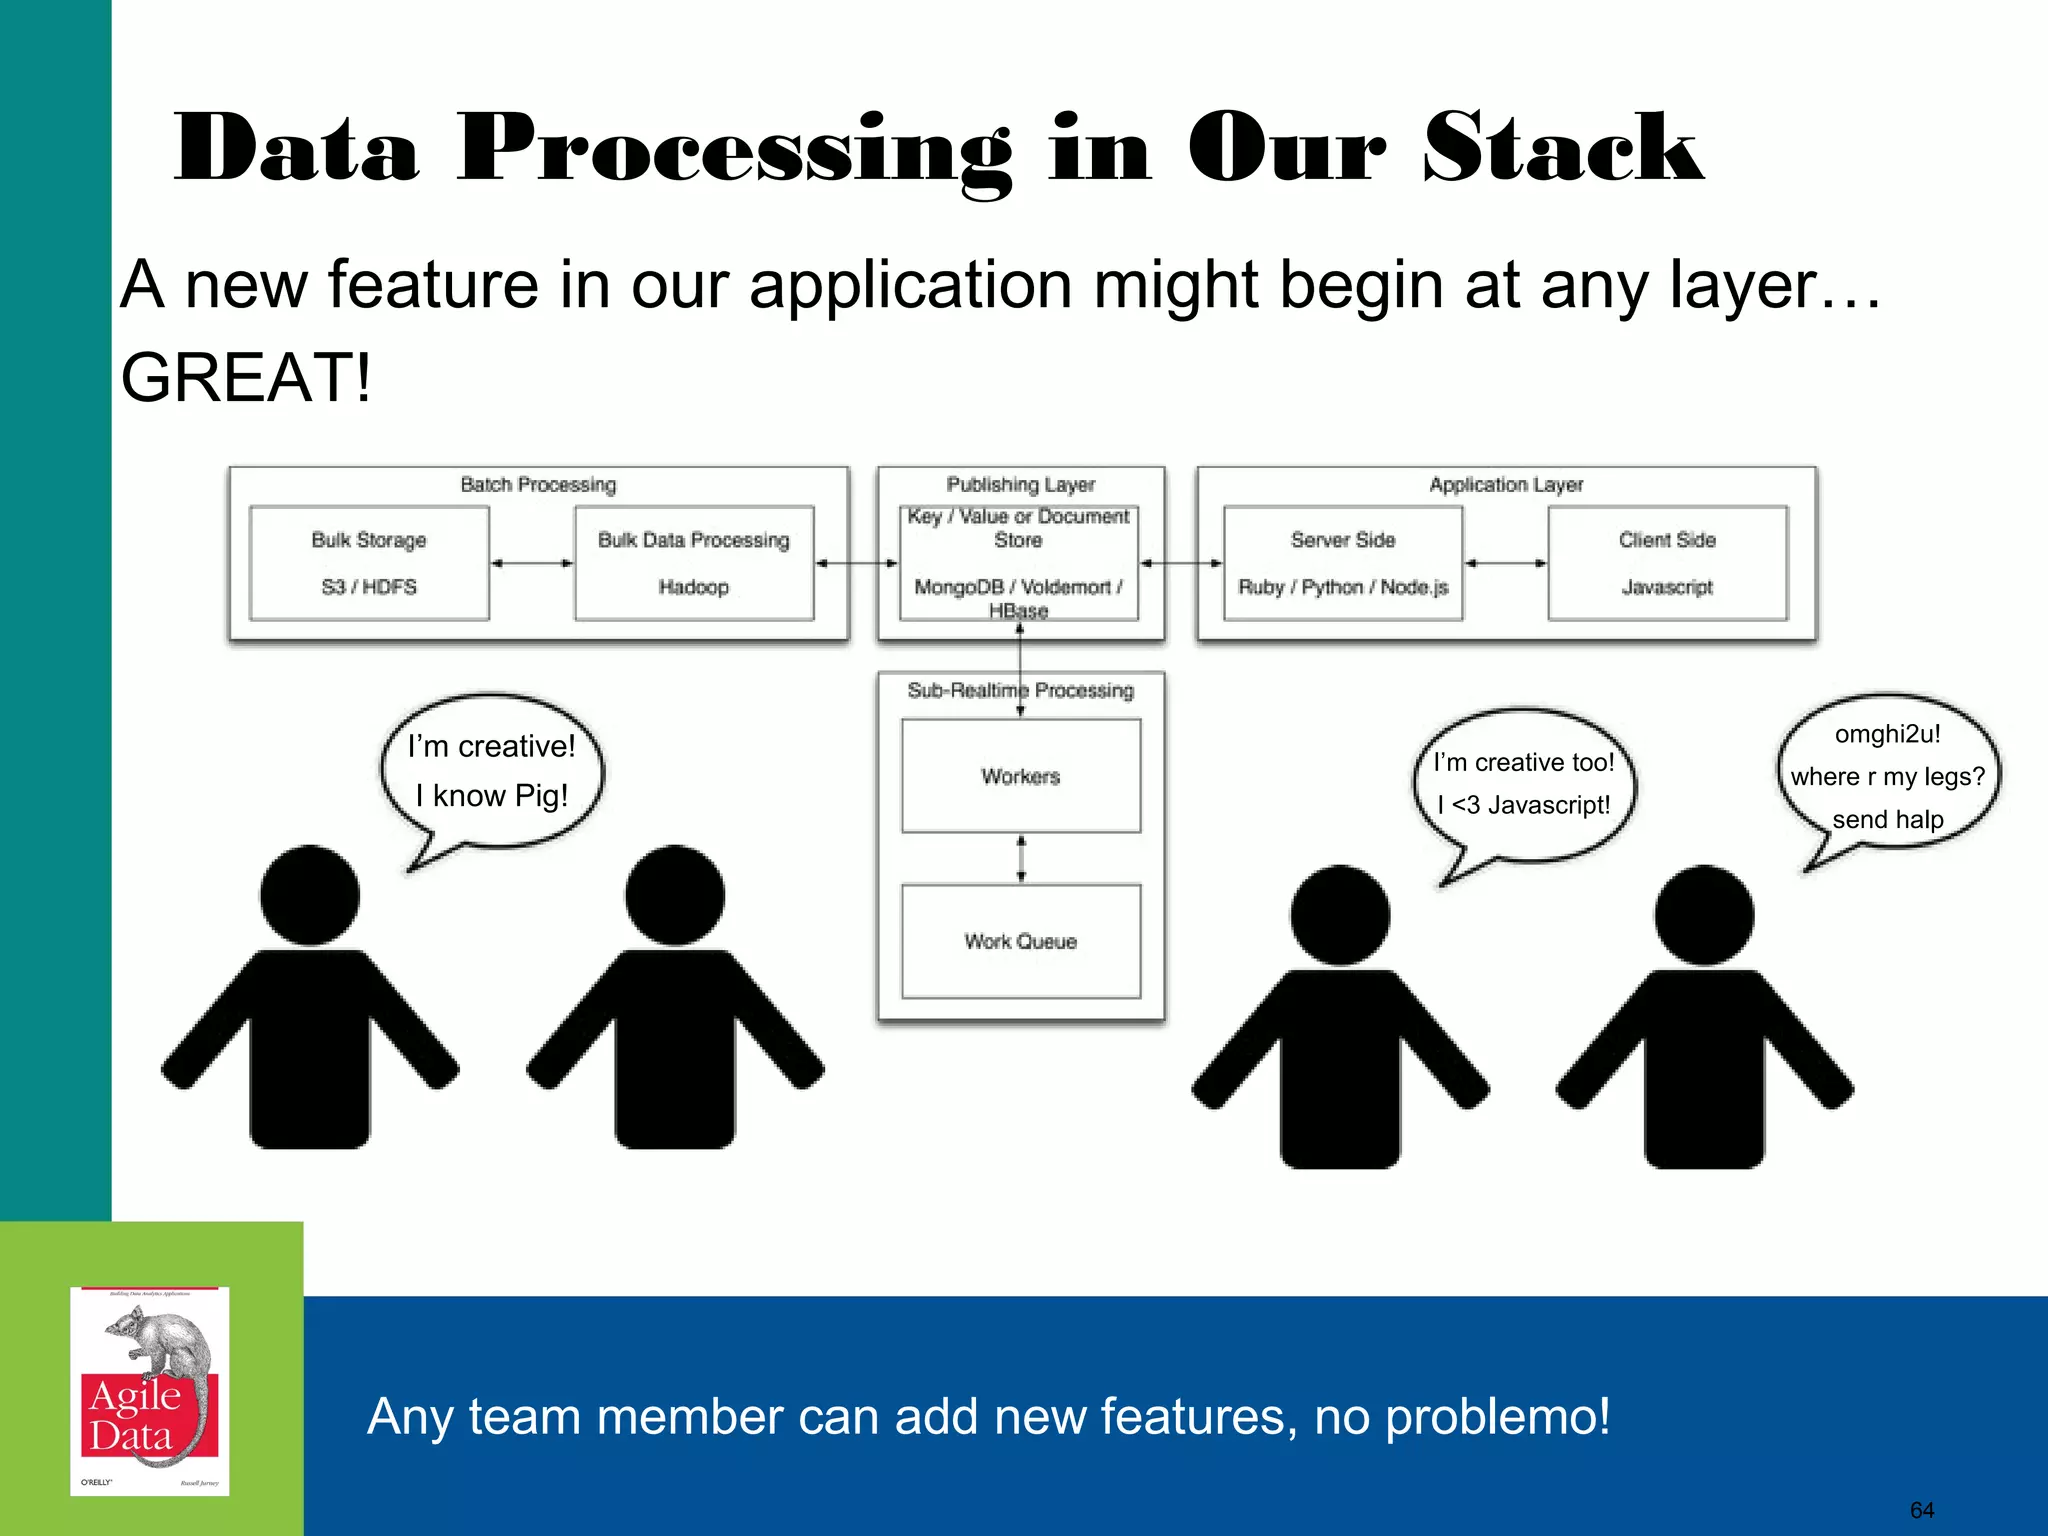
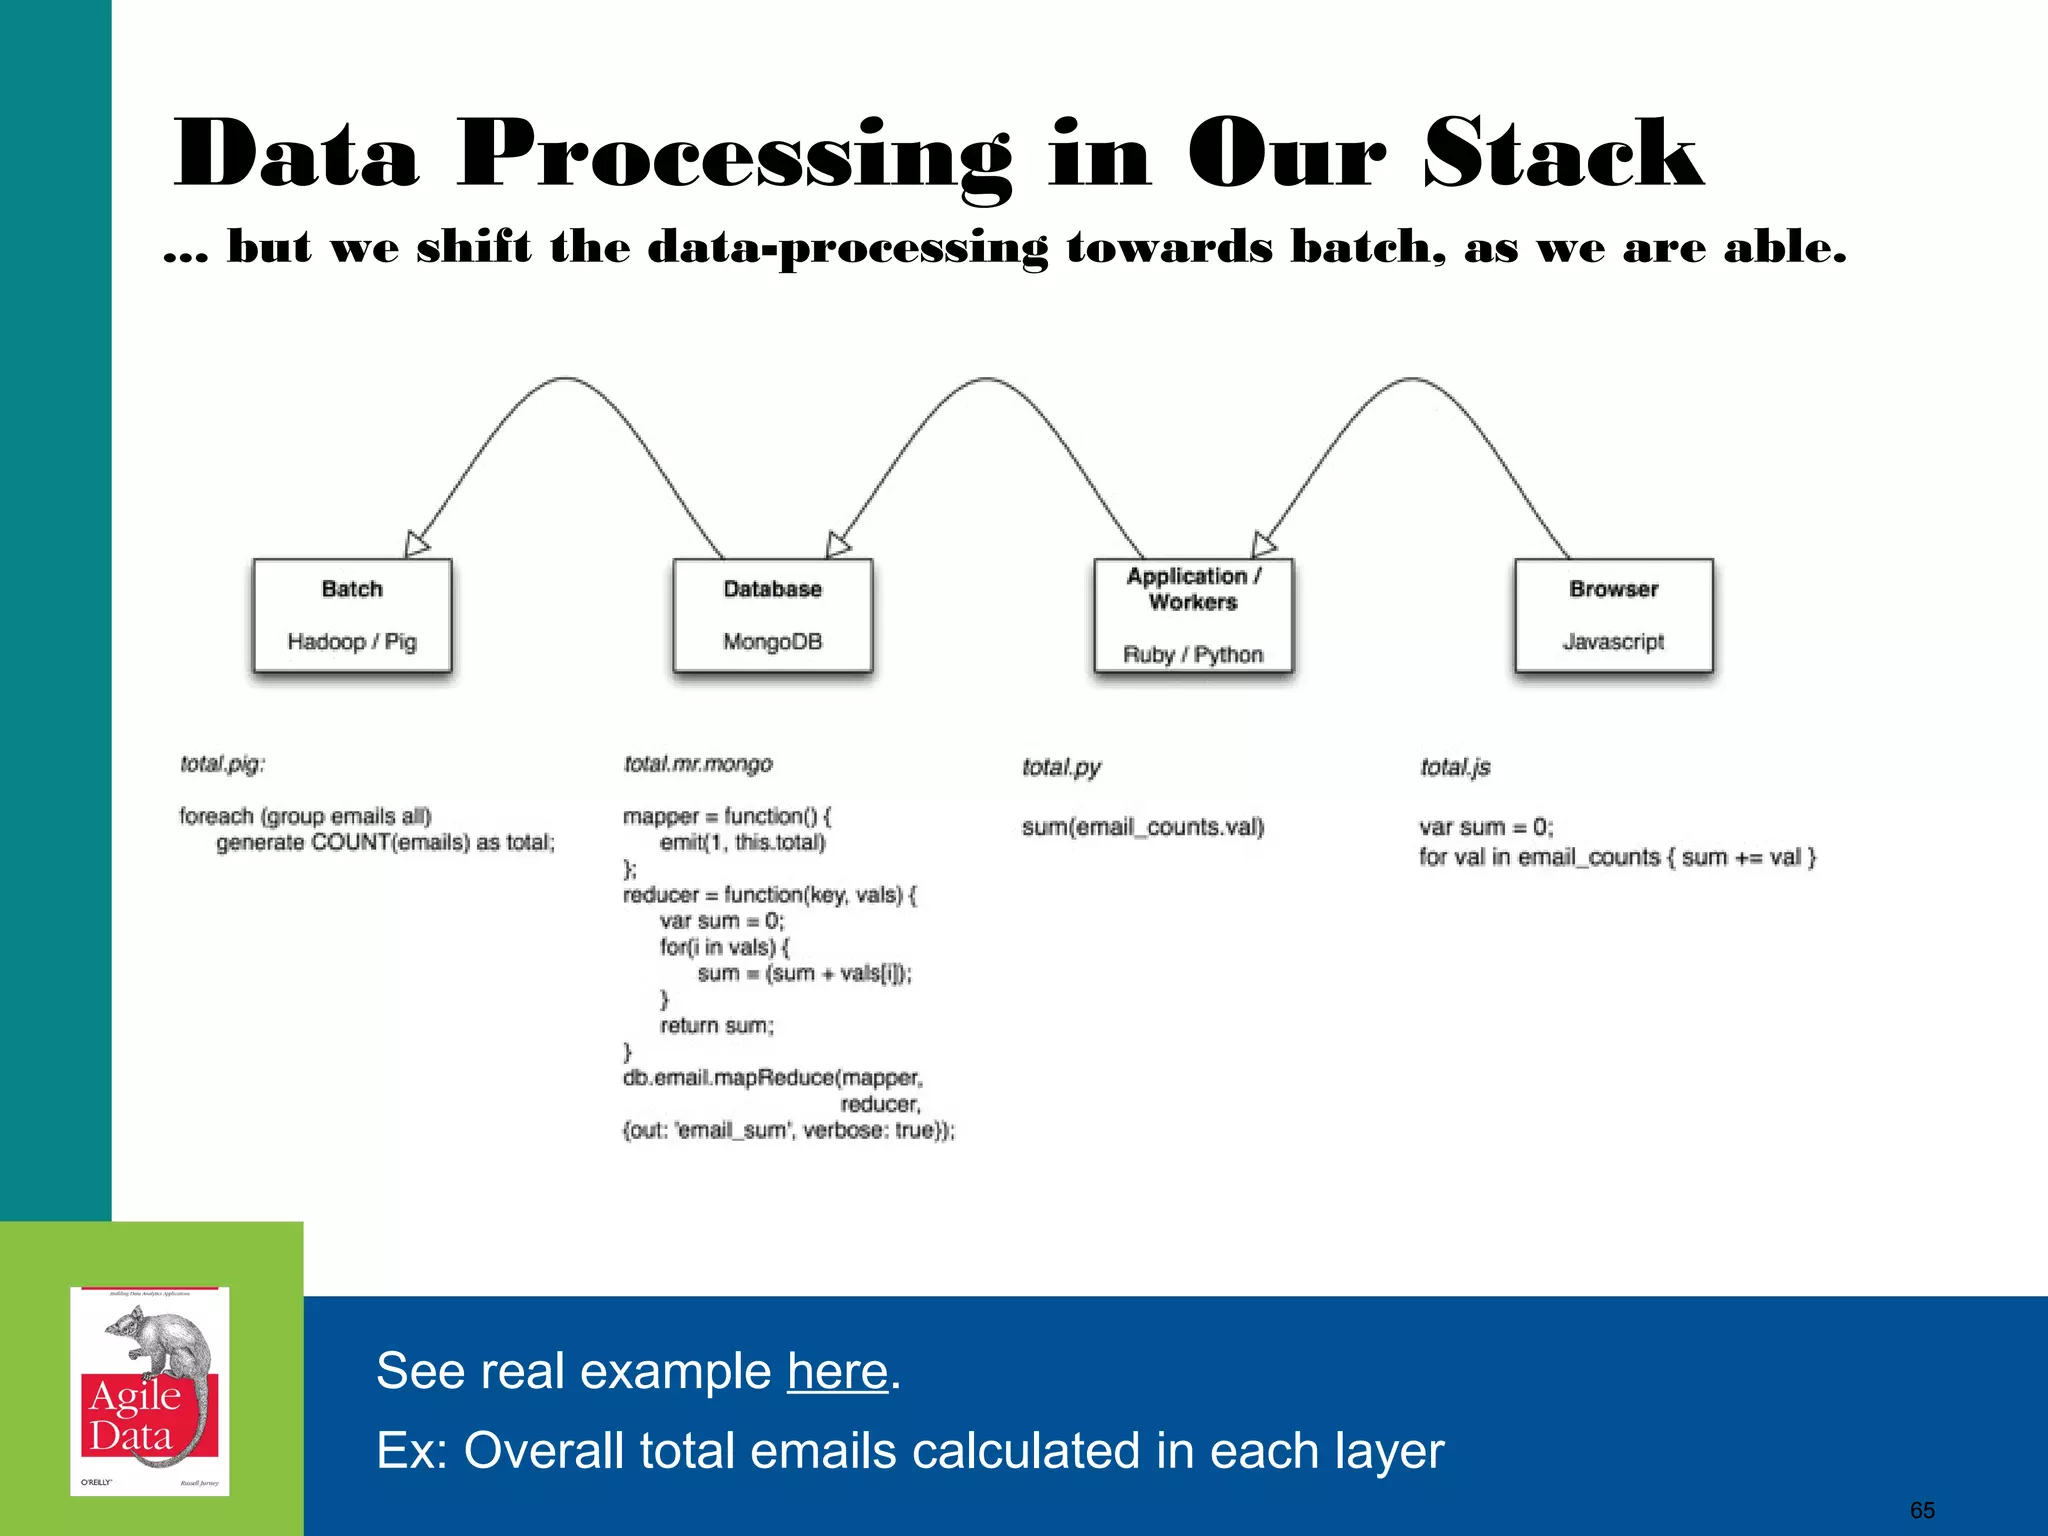
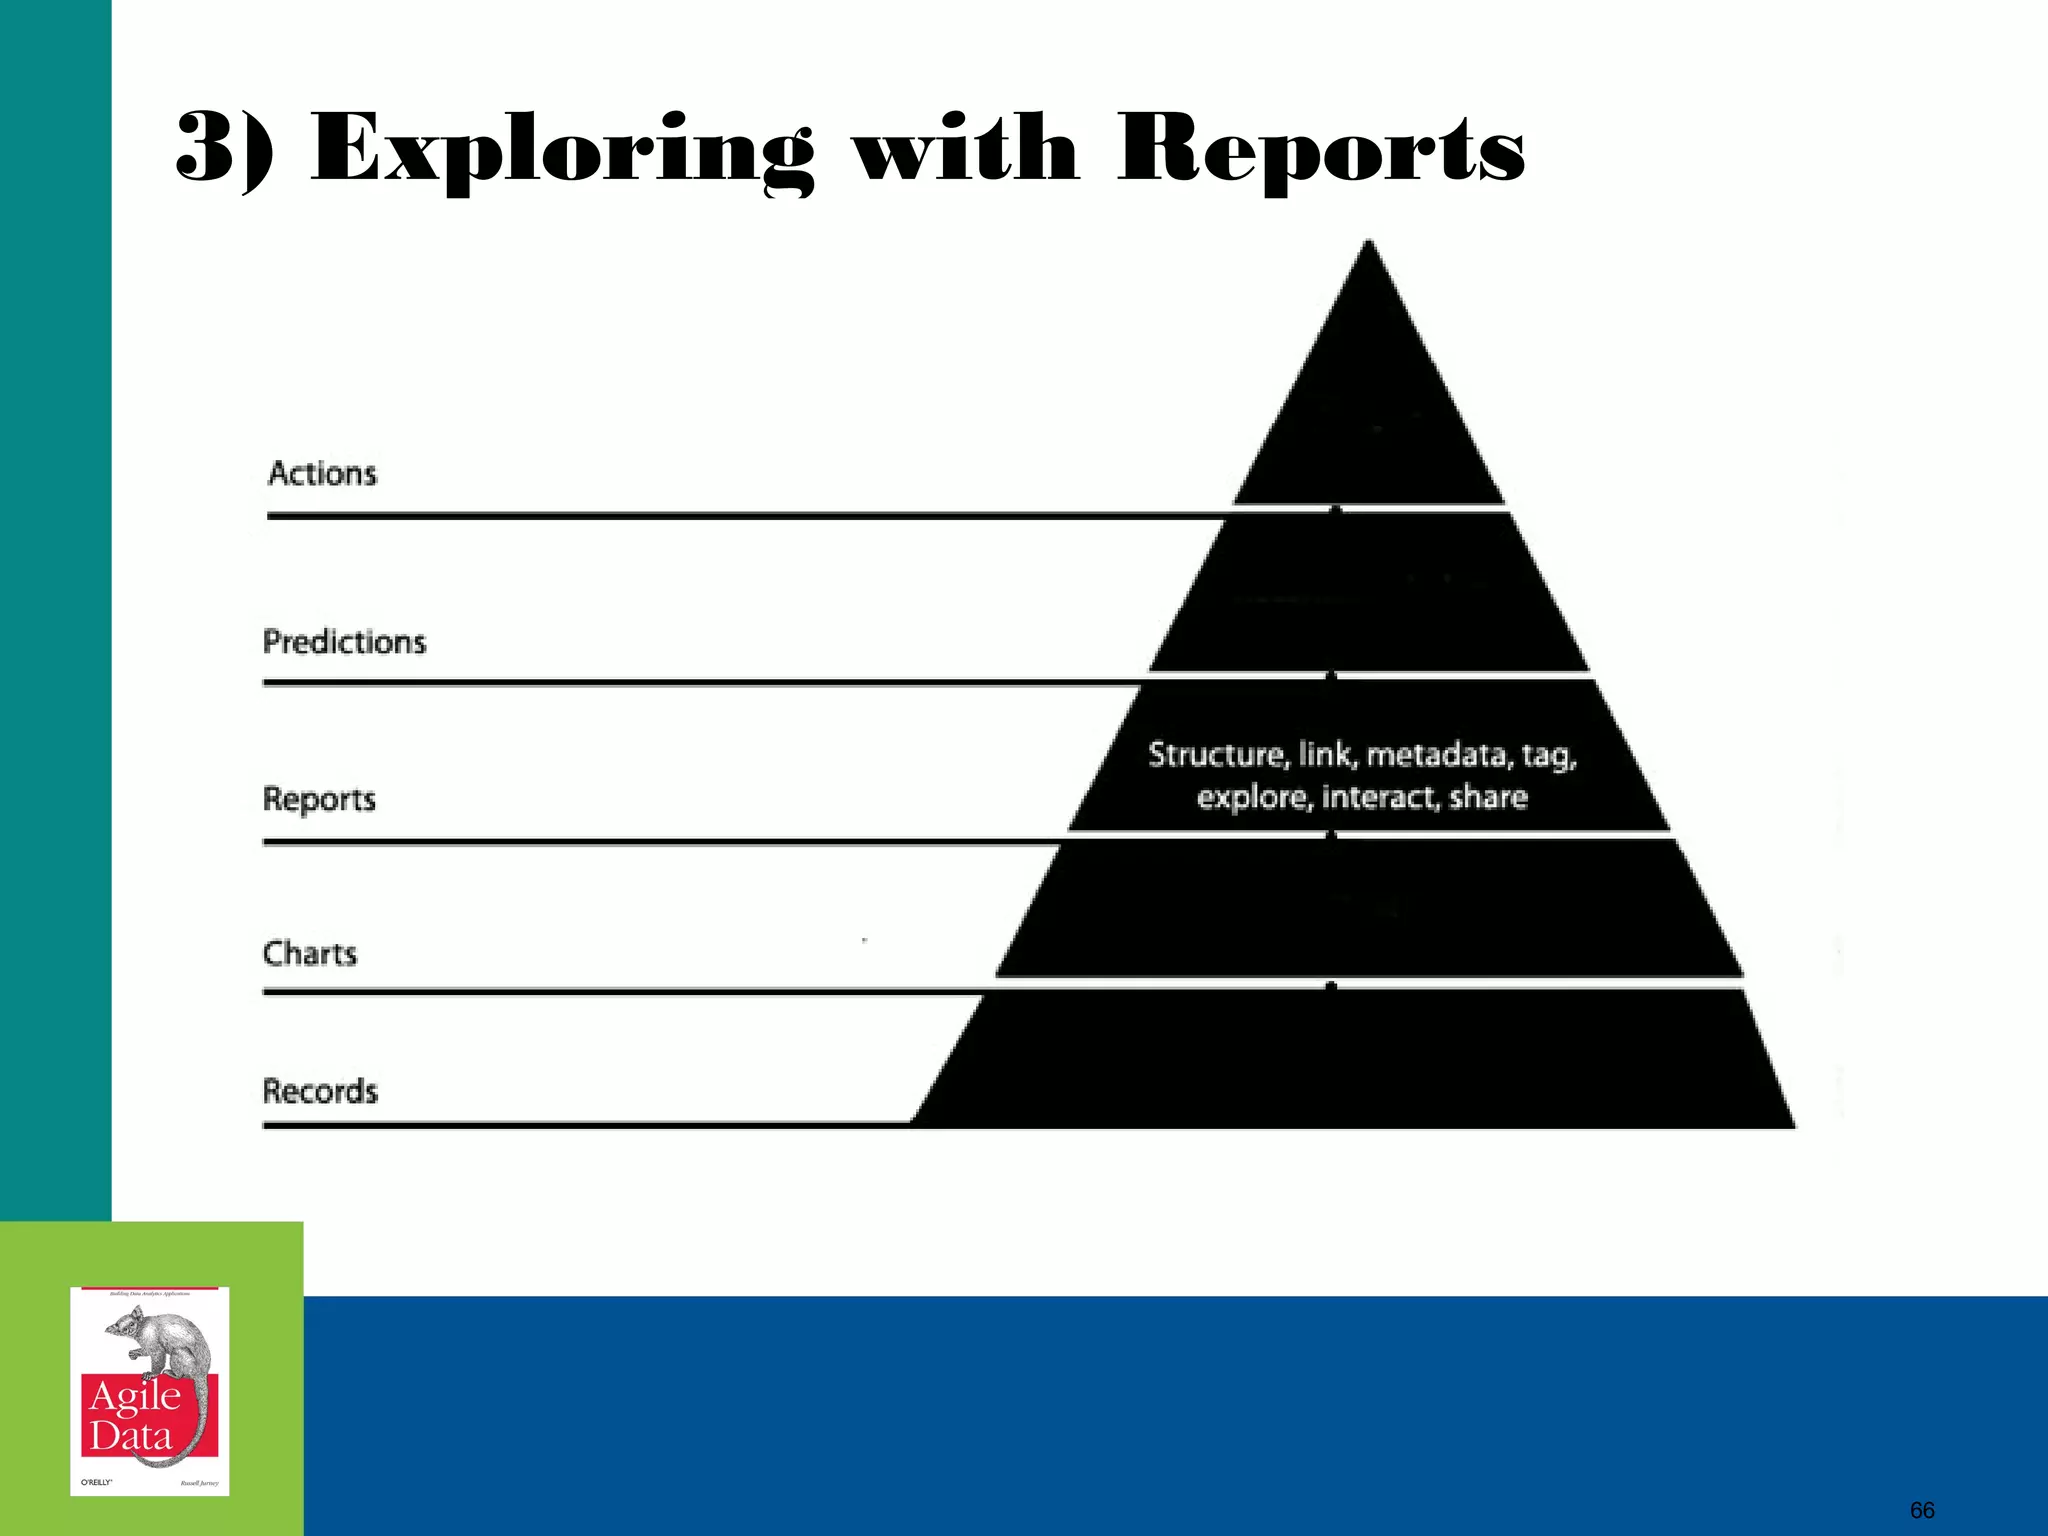


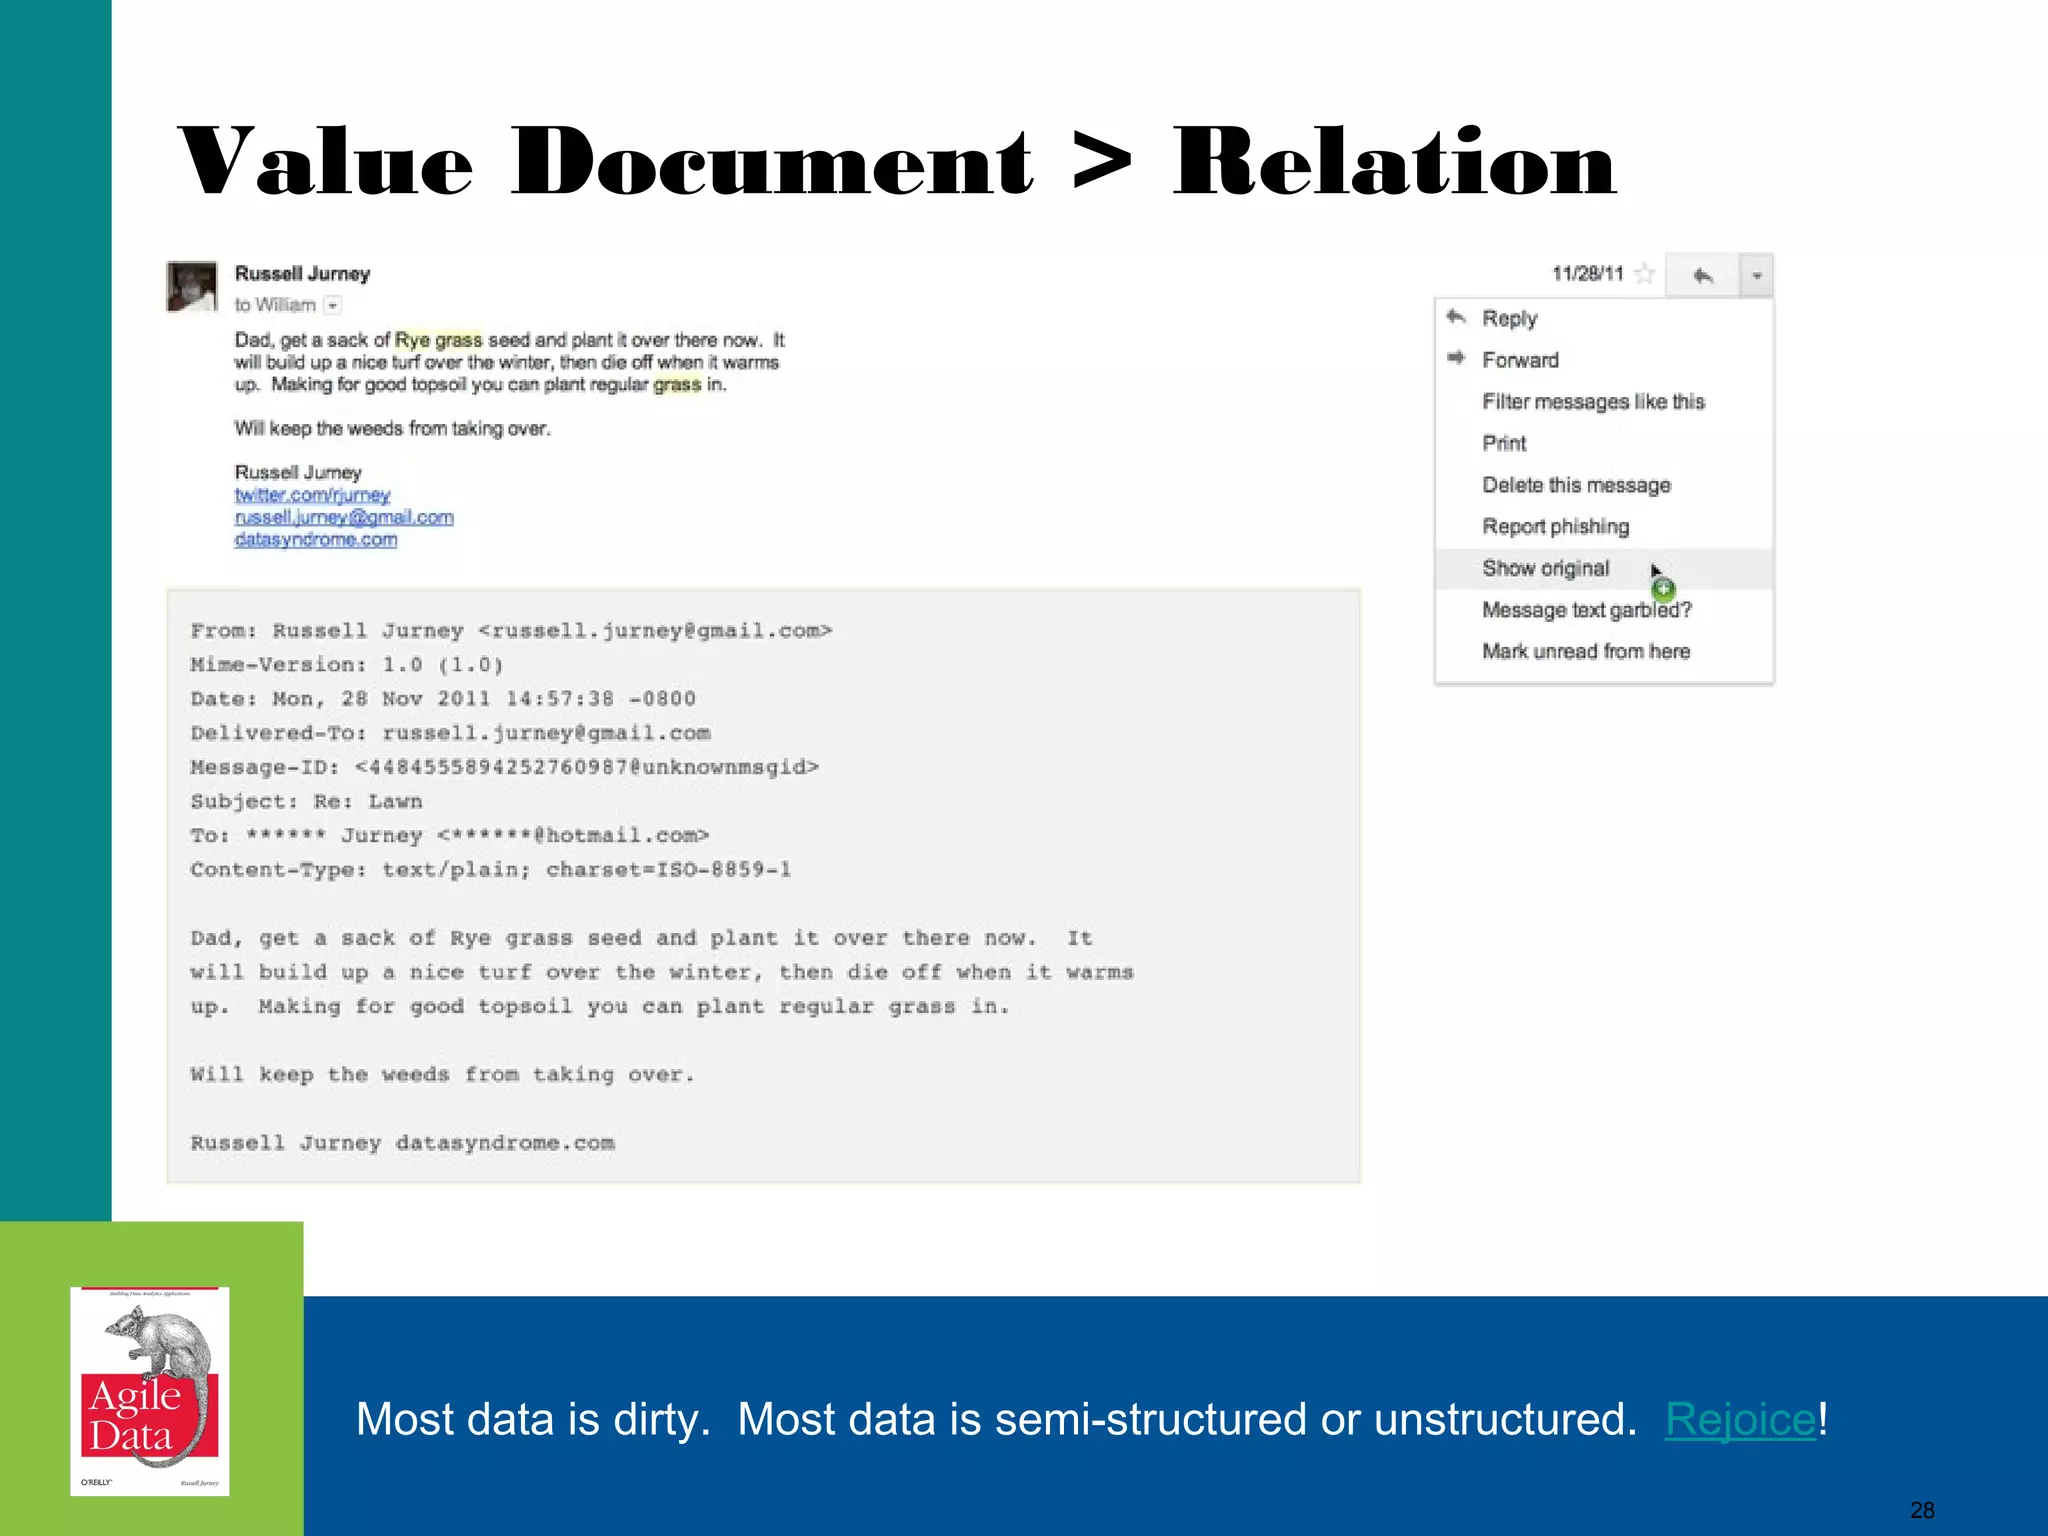
This document discusses building agile analytics applications with Hadoop. It outlines several principles for developing data science teams and applications in an agile manner. Some key points include: - Data science teams should be small, around 3-4 people with diverse skills who can work collaboratively. - Insights should be discovered through an iterative process of exploring data in an interactive web application, rather than trying to predict outcomes upfront. - The application should start as a tool for exploring data and discovering insights, which then becomes the palette for what is shipped. - Data should be stored in a document format like Avro or JSON rather than a relational format to reduce joins and better represent semi-structured