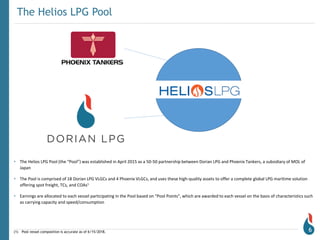
SlideShare a Scribd company logo
June 2018
DORIAN LPG®
Forward-Looking Statements
This presentation contains certain forward-looking statements including analyses and other information based on
forecasts of future results and estimates of amounts not yet determinable and statements relating to our future
prospects, developments and business strategies. Forward-looking statements are identified by their use of terms
and phrases such as “anticipate,” “believe,” “could,” “estimate,” “expect,” “intend,” “may,” “plan,” “predict,”
“project,” “will” and similar terms and phrases, including references to assumptions. The forward-looking
statements in this presentation are based upon various assumptions, many of which are based, in turn, upon
further assumptions, including without limitation, management’s examination of historical operating trends, data
contained in our records and other data available from third parties. Although we believe that these assumptions
were reasonable when made, because these assumptions are inherently subject to significant uncertainties and
contingencies that are difficult or impossible to predict and are beyond our control, we cannot assure you that we
will achieve or accomplish these expectations, beliefs or projections.
Actual results could differ materially from expectations expressed in the forward-looking statements if one or
more of the underlying assumptions or expectations proves to be inaccurate or is not realized. Our actual future
results may be materially different from and worse than what we expect. We qualify all of the forward-looking
statements by these cautionary statements. We caution readers of this presentation not to place undue reliance
on forward-looking statements. Any forward-looking statements contained herein are made only as of the date of
this presentation, and we undertake no obligation to update or revise any forward-looking statements, whether as
a result of new information, future events or otherwise, except as required by law.
Disclaimer
2
Dorian LPG at a glance
3
Company overview Global presence
Average vessel age vs. globalfleet1
• Dorian LPG is a liquefied petroleum gas shipping
company and a leading owner and operator of modern
very large gas carriers (“VLGCs”).
• The Company was established in 2013 in connection
with placing a large order of newbuildings at Hyundai
HI. Predecessors have invested in and managed LPG
vessels since 2002.
• The fleet is comprised of 19 ECO-VLGCs and 3 modern
VLGCs, with an average age of 4.1 years.
• 18 of the vessels are currently employed in the Helios
LPG Pool, founded by the Company together with
Phoenix Tankers in Apr-2015.
• The remaining vessels are on time charter contracts to
major companies.
• The Company provides in-house commercial and
technical management services for all of the vessels in
the fleet, including vessels owned by Dorian LPG
deployed in the Helios LPG Pool.
• Dorian LPG was listed on the NYSE in 2014 under the
ticker “LPG”. The Company has a market cap of USD
~461m as of 15-June-2018
(1) As of 18-June-2018
4.02
8.89
0
1
2
3
4
5
6
7
8
9
10
Dorian Fleet Global Fleet
History / background
4
Predecessor entities
entered the LPG
market in 2002 by
acquiring two
pressurized vessels
Dorian LPG Ltd. established
(2013) and the Company listed
on NYSE (2014). Dorian LPG
raised USD 6882 million in four
rounds from Jul-13 to May-14
Number of
vessels1
Dorian LPG announced delivery of
its last ECO-VLGC newbuilding,
the Caravelle and sale of the
Grendon, its last remaining 5,000
cbm pressurized gas carrier
Part of predecessor entities Dorian LPG
First VLGC, Captain
Markos NL, was
delivered
(1) Total LPG vessels on the water; (2) Gross proceeds
1
4
5 5
6
5
6 6
5
4 4 4
6
22 22 22
2002 2003 2004 2005 2006 2007 2008 2009 2010 2011 2012 2013 2014 2015 2016 2017
Experienced management team
5
John Hadjipateras
Chairman & CEO
(Dorian LPG Ltd)
With Dorian LPG since inception in 2013.
Involved with shipping management since
1972. Experience from Peninsular
Maritime, Eagle Ocean, Greek Shipping
Corp. Committee, SEACOR and more
John Lycouris
CEO
(Dorian LPG USA)
With the Company since 2013. Holds strong
experience from Peninsular Maritime and
Eagle Ocean. Responsibilities include oversight
of the entire newbuilding program and teams
in Greece, the UK and the US
Costas Markakis
President & CEO
(Dorian LPG Management)
Shipping and legal background with more
than 30 years experience in executive and
top management positions in ship
management companies (commercial and
operational)
Theodore B. Young
CFO
(Dorian LPG Ltd)
Joined Dorian LPG at inception in 2013.
Previous experience include Head of
Corporate Development at Eagle Ocean
and the buyout firms Irving Place Capital
and Harvest Partners
Alex Hadjipateras
EVP Bus. Devel.
(Dorian LPG USA)
Joined Dorian LPG in 2013 focusing on
business development. Previously
responsible for Aframax and VLGC
newbuilding at Eagle Ocean, and business
development at Avenue A / Razorfish
The Helios LPG Pool
6
• The Helios LPG Pool (the “Pool”) was established in April 2015 as a 50-50 partnership between Dorian LPG and Phoenix Tankers, a subsidiary of MOL of
Japan
• The Pool is comprised of 18 Dorian LPG VLGCs and 4 Phoenix VLGCs, and uses these high-quality assets to offer a complete global LPG maritime solution
offering spot freight, TCs, and COAs1
• Earnings are allocated to each vessel participating in the Pool based on “Pool Points”, which are awarded to each vessel on the basis of characteristics such
as carrying capacity and speed/consumption
(1) Pool vessel composition is accurate as of 6/15/2018.
Premium fleet
7
The Company owns and operates 19 ECO-
(1) Operated pursuant to Bareboat Lease from Japanese Owners
(2) ‘BWTS’ = Ballast Water Treatment System
‘SR’ = Scrubber Ready
Fleet overview Comments
Type Name CBM Delivered Yard Features 2
ECO VLGC CARAVELLE 84,000 2016 Hyundai HI BWTS VLGCs and 3 modern VLGCs
ECO VLGC CHALLENGER 84,000 2015 Hyundai HI BWTS
ECO VLGC COPERNICUS 84,000 2015 Daewoo SME BWTS + SR Average fleet age of 4.02 years
ECO VLGC CHAPARRAL 84,000 2015 Hyundai HI BWTS + SR
ECO VLGC COMMANDER 84,000 2015 Hyundai HI BWTS 16 of the 22 vessels already equipped with
ECO VLGC CRATIS 84,000 2015 Daewoo SME BWTS + SR
Ballast Water Treatment Systems
ECO VLGC CHEYENNE 84,000 2015 Hyundai HI BWTS 2 of the 22 vessels already equipped with
ECO VLGC CLERMONT 84,000 2015 Hyundai HI BWTS scrubbers, and an additional 17 are
ECO VLGC CONSTELLATION 84,000 2015 Hyundai HI BWTS + SR “scrubber ready”
ECO VLGC CRESQUES 84,000 2015 Daewoo SME BWTS + SR
ECO VLGC COMMODORE 84,000 2015 Hyundai HI BWTS Captain Markos NL and Captain JohnNP
ECO VLGC CONSTITUTION 84,000 2015 Hyundai HI BWTS
have recently completed 10 year special
ECO VLGC CONTINENTAL 84,000 2015 Hyundai HI BWTS
surveys
ECO VLGC COBRA 84,000 2015 Hyundai HI BWTS In-house technical and commercial
ECO VLGC CONCORDE1 84,000 2015 Hyundai HI BWTS + Scrubber management of fleet
ECO VLGC COUGAR 84,000 2015 Hyundai HI BWTS
ECO VLGC CORVETTE1
84,000 2015 Hyundai HI Scrubber 18 vessels operate under spot, COA or Time
ECO VLGC CORSAIR1 84,000 2014 Hyundai HI SR Charter contracts of less than 24 months
ECO VLGC COMET 84,000 2014 Hyundai HI SR In the Helios Pool. Remaining 4 on TC.
Modern VLGC CAPTAIN NICHOLAS ML 82,000 2008 Hyundai HI
Modern VLGC CAPTAIN JOHN NP 82,000 2007 Hyundai HI All newbuilds delivered and no remaining
Modern VLGC CAPTAIN MARKOS NL 82,000 2006 Hyundai HI newbuilding related capital expenditures.
14%
58%
6%
8%
14%
Daewoo
Hyundai
Jiangnan
Kawasaki
MHI Nagasaki
Vessels built at premium Korean Shipyards
8
Total VLGC newbuilding deliveries by shipyard 2006-2017 Comments
• The Korean yards Hyundai HI (“HHI”)
and Daewoo SME (“DSME”) are two of
the world's leading shipbuilders
• Dorian LPG and it predecessors have
built 24 vessels at HHI since 2004 and
maintain a strong relationship with its
shipyards
• LPG vessels are highly engineered, and
exacting technical specifications
determine commercial acceptance
• HHI and DSME also design and build
some of the world’s most complex
offshore vessels and rigs
HHI is the most active and
experienced yard in the
design and construction of
gas carriers
LPG Fundamentals
9
Hundreds of millions of people around the
world use LPG at home for applications such
as cooking and heating.
LPG is the preferred alternative automotive
transportation fuel and is increasingly being
used as a marine fuel.
Millions of businesses rely on LPG. It is the
ideal fuel choice for businesses that are not
connected to an existing electrical grid.
Farmers across the world rely on LPG to
meet the challenge of staying competitive in
the modern agricultural environment
Industries such as aerosol, refrigeration, and
chemical feedstock all look to LPG to
provide sustainable fuel alternatives
What is LPG?
Liquefied petroleum gas ("LPG") is
a fossil fuel made during natural
gas processing and oil refining. LPG
is a by product of both oil and
natural gas production and more
than two-thirds of the LPG people
use is extracted directly from the
earth. The rest of it is
manufactured indirectly from
crude oil refining.
Why use LPG?
LPG is cleaner than coal and oil
and an alternative to gasoline. It
generates less air pollution and
produces fewer emissions of
carbon dioxide. LPG is also highly
portable, making it a convenient
source of energy usable in remote
places where ordinary gas supplies
are unavailable or have been
interrupted.
AT HOME
ON THE GO
AT THE
FARM
AT WORK
OTHER
LPG in the petrochemical value chain
10
The LPG value chain
Source Processing industries
Transport /
usage
User
Natural gas well
Oil well
Gas plant Natural gas
LNG
liquefaction
Refinery
LPG
Ammonia
Condensates
(CPP)
Clean
products
Dirty
products
Petrochemical
gases
Pipeline
LNG ship
LPG Vessels
Power generation
Residential/
commercial
Industrial
Auto
Further refining
Chemicals
Agricultural
LPG Supply and Export Dynamics
Global Liftings showing steady growth
Global liftings (MM Tons)
12
Source: IHS, EIA, FGE *Note: Bbls/day converted to MT/yr (bbls per day/11.6 * 365)
U.S. Waterborne Exports Middle East Waterborne Exports
60.7 63.0
75.1
85.4
90.6 92.6
23.4 22.0
0M
10M
20M
30M
40M
50M
60M
70M
80M
90M
100M
2012 2013 2014 2015 2016 2017 2017 Mar YTD 2018 Mar YTD
Millions
5.1
9.3
13.8
20.5
25.3
29.5
7.9 7.4
0M
5M
10M
15M
20M
25M
30M
35M
2012 2013 2014 2015 2016 2017 2017 Mar
YTD
2018 Mar
YTD
Millions
34.2
32.1
34.8
36.7
39.2
36.8
8.7 8.9
0M
5M
10M
15M
20M
25M
30M
35M
40M
45M
2012 2013 2014 2015 2016 2017 2017
Mar YTD
2018
Mar YTD
Millions
15% 19%
25% 29% 32%
51% 47%
45%
44% 40%
12% 11%
10%
10% 10%
8% 11% 10% 8% 8%
14% 12% 10% 8% 9%
0%
20%
40%
60%
80%
100%
2013 2014 2015 2016 2017
US ME N.Sea Med Other
U.S. LPG has significantly increased its share of global supply
Source: EIA, Bloomberg, IHS, FGE
A New Era of Supply
13
• Emergence of U.S. as largest exporting nation has
forced price competition amongst all suppliers
• Middle East supply has surprised on the upside with
more export growth than expected
• The Asian market has become increasing reliant on
US LPG
Seaborne LPG by Source
Evolving U.S. NGL / LPG Trade Flows
14
Europe
18%
Caribbean
10%
China
12%
Africa
2%Other
0%
Mexico
10%
South
America
16%
Australia
1%
Japan
13%
Korea
14%
Asia -
Other
4%
Europe
11%
Caribbean
9%
China
13%
Africa
2%
Other
1%
Mexico
9%
South
America
13%
Australia
1%
Japan
23%
Korea
13%
Asia -
Other
5%
2016 2017
U.S. LPG volumes to Asia
increased 45% year-over-
year (vs. 15% growth in
overall U.S. LPG exports).
0
200
400
600
800
1000
1200
1400
2016-01-01 2016-04-01 2016-07-01 2016-10-01 2017-01-01 2017-04-01 2017-07-01 2017-10-01
Butane (+15%)
Propane (+15%)
Ethane (+289%)
U.S. Exports of NGLs (mb/d) – 2016 vs. 2017
+25% y-o-y
Source: EvercoreISI
U.S. as Global NGL / LPG Price Setter…
15
We believe the U.S. will become the global LPG market price setter given increasing supply at both
Mont Belvieu and the Northeast (Marcus Hook) coupled with a liquid trading market and active hedging
opportunities along the forward curves.
Increasing price
circularity as greater
volumes of U.S. LPG
clear in the
international market.
Argus CIF ARA
OPIS Mont Belvieu
Sonatrach CP
Saudi CP Argus FEI
Source: EvercoreISI
LPG Expansion Capacity
16
-
200
400
600
800
1,000
1,200
1,400
1,600
1,800
2017 2018 2019 2020 2021 2022
LPG Exports to Clear Market Existing Capacity
Mariner East 2 AltaGas Ridley Island
Pembina Prince Rupert
• We estimate current LPG export
capacity is running at ~91%
utilization (LPG nameplate
capacity est. at ~1,200 mb/d).
• Based on the ‘Base Case’ model,
increasing volumes of LPG
(propane and butane) will need to
be exported in order to clear the
market. The total volume is
expected to grow from ~1,000
mb/d in 2017 to ~1,300 mb/d in
2020 and ~1,500 mb/d in 2022.
The need to clear via exports
stems from the lack of
incremental domestic demand in
the face of increasing levels of
production.
• The Mariner East II start-up (est.
2018) will provide an outlet for
(initially) up to ~275 mb/d. We
expect this will provide some near
term relief to the Gulf Coast
terminals, although we expect
that Mariner East II will take some
time to fill up. Mariner East II is
expected to primarily export NGLs
produced in the Appalachian
region.
Base Case LPG Exports (mb/d)
Export capacity tightens. New capacity needed.
Source: EvercoreISI
LPG Demand & Consumption
Growing markets for LPG: CHINA
Annual China LPG imports (Tons)
18Source: FGE
4.2M
6.9M
11.9M
15.9M
18.3M
3.9M
4.7M
0M
2M
4M
6M
8M
10M
12M
14M
16M
18M
20M
2013 2014 2015 2016 2017 2017 Mar YTD 2018 Mar YTD
Millions
Chinese Consumers Continue to Drive LPG Demand
19Source: FGE, Platts
• While the restart of coal-fired plants to ease winter power shortages has probably dented Chinese residential heating
demand for LPG in the near term, demand from the petrochemical sector is set to rebound with new PDH and alkylation
unit start-ups due in 2018
• Residential LPG will still be required in more remote rural areas, where piped gas is unavailable or too costly to install,
but overall, chemicals will account for a growing share of China’s LPG demand, especially with a rapidly growing
petrochemical base in China.
• While no new PDH plants started up in China last year, both the 0.66 Mtpy Fujian Meide plant and Zhejiang Satellite’s
0.45 Mtpy expansion are expected to start up in H2 18
• State-owned refiners are also starting up an estimated 3.7 Mtpy of alkylation units, which will reduce refinery supplies of
butane currently sold to standalone deep-processing units, increasing the need for imported supplies. So, Chinese buyers
will remain a key source of demand throughout 2018
• Middle Eastern supply alone will not be able to meet demand
China LPG imports by source
China LPG demand outlook
6.8% 8.4% 15.5% 18.8%10.4%
20.5%
17.0%
23.4%
42.8% 19.6% 18.4%
11.9%
11.3%
10.1%
14.5% 16.4%
6.5%
8.1%
10.3% 6.9%
22.2%
33.3%
24.3% 22.6%
0.0%
20.0%
40.0%
60.0%
80.0%
100.0%
2014 2015 2016 2017
Qatar United States Iran United Arab Emirates Saudi Arabia Others
“The year of the LPG consumer”: INDIA
• Power conversion
project with Vitol
• By April, LPG will be
used as primary fuel
source
India LPG import forecast (Million MT)
• Indian LPG demand remained near record levels in December 2017, with consumption rising by 45 thousand b/d y/y in Q4
17.
• The Modi Government aggressively promoting LPG penetration in rural areas calling 2016 “the year of the LPG Consumer”
• The Indian government’s subsidized LPG connection scheme has issued 30.3 million connections since its inception in
March 2016 and the country now has at least 181 million subsidized connections
• Original target of new connections under latest scheme was increased from 50 million to 80 million by May 2019,
suggesting there is plenty of upside for Indian LPG
• Non subsidized market growing due to lower international LPG prices
• Demand from autogas and the private sector are set to grow amidst favourable auto-fuel economics and a 13% decline in
GST tax for private companies
• Paradip refinery startup marks last major domestic supply addition supporting further imports
• Seaborne LPG imports into India were up 17.1% in 2017, from 10.1mm tons to 11.9mm tons
20Source: IOC, FGE, Energy Aspects
6.M
8.1M
8.9M
10.2M
11.9M
3.1M 3.5M
0M
2M
4M
6M
8M
10M
12M
14M
2013 2014 2015 2016 2017 2017 Mar YTD 2018 Mar YTD
Millions
Global PDH & Petchems also fueling demand
21
Illustrative increase from Korean PDH Plant
• Korean market is saturated but saw a major increase in
demand in 2017 from a new PDH facility
• PDH importers require high purity propane, best sourced from
the US or Middle East
• This year could be sustained by the ramp-up of SK Advanced’s
PDH plant, stronger heating demand due to frigid temperatures
(one of the coldest Januarys on record for Korea) and a growing
preference for LPG cracking among petrochemical plants
Japan Upgrades cracker capacity
• Japan’s Idemitsu Kosan’s JV with Mitsui Chemicals
recently announced plans to expand the processing of
propane at Idemitsu’s naphtha cracker
• The upgrade will boost the Cracker’s capacity to process
propane as feedstock by three or four times.
• It will mainly rely on LPG imports for feedstock rather
than a small quantity of LPG produced at the plant
• According to data from Japan LP Gas Association, LPG
requirements were driven by residential heating demand
for propane.
• The cold weather combined with petro-chem demand for
Butane picking up on opportunistic switching due to high
Naphtha prices demand growth could see further increase
0.00
1.00
2.00
3.00
4.00
5.00
6.00
7.00
8.00
9.00
10.00
2013 2014 2015 2016 2017
Korean LPG Demand by Sector (mmtons)
Petrochemical Feedstocks Residential
Road Commercial and Public Services
Others
Source: FGE
Europe
• European petchem giant INEOS announced this June plans
to expand its petrochemical infrastructure in Northwest
Europe, with large capacity increases in its Rafnes,
Norway and Grangemouth, Scotland crackers, as well as a
greenfield 750,000 tons/year PDH unit in an undisclosed
location.
22
✓ Established production hubs
✓ Global supply base
✓ Maritime and land transport options
✓ Price competitive product
✓ Low cost “last mile” infrastructure
✓ Lower greenhouse gas emissions
✓ 20% less CO2 than heating oil
✓ 50% less CO2 than coal
✓ Safe fuel source
✓ Avoids harmful and dangerous waste
LPG should be the fuel of
choice for emerging economies
Source: ExceptionalEnergy.com
Key Factors Favoring LPG Adoption for Power Generation and Retail Consumption
Strong Fundamentals for Continued LPG Adoption
Each year, around 3.5 million premature
deaths can be attributed to household air
pollution resulting from the traditional use of
solid fuels, such as fuelwood and charcoal.
Four out of five people in sub-Saharan Africa
rely on the traditional use of solid biomass,
mainly fuelwood, for cooking.
Nearly 3.1 billion people, or 43% of the global
population, still rely on polluting fuels (i.e.
biomass, coal, kerosene) and technologies for
cooking - a major source of household air
pollution.
Source: World Health Organization
Economic
Environmental
VLGC Shipping Market Dynamics
Continued High VLGC Utilization
Drivers underlying current rate environment
24
Source: Clarksons Research, Baltic Exchange, Panama Canal Authority
Baltic VLGC daily spot TCE rates (USD/d) Global VLGC fleet utilization
86%
85%
2016
2017
• Incremental VLGC fleet growth has been absorbed without severely impacting utilization thus far (i.e. demand for
seaborne transport continues to grow in excess of fleet growth)
• The Panama Canal Authority increased rates for neo-Panamax VLGCs by 29% in October of 2017. This equates to an
increase of ~$2.2/t. Currently, we estimate that 28% of traffic through the expanded canal is VLGCs, second only to
container ships at 54%. The increased fees, alongside increased competition from other sectors like LNG, could
result in a reduction in VLGC transits which would increase ton mile demand as those ships would then likely transit
around the Cape of Good Hope, adding an additional 20-25 days transittime.
0
10,000
20,000
30,000
40,000
50,000
60,000
70,000
2016-01-01
2016-02-01
2016-03-01
2016-04-01
2016-05-01
2016-06-01
2016-07-01
2016-08-01
2016-09-01
2016-10-01
2016-11-01
2016-12-01
2017-01-01
2017-02-01
2017-03-01
2017-04-01
2017-05-01
2017-06-01
2017-07-01
2017-08-01
2017-09-01
2017-10-01
2017-11-01
2017-12-01
2018-01-01
2018-02-01
2018-03-01
2018-04-01
2018-05-01
2018-06-01
Baltic TCE/Day Baltic TCE/Day (4 week trailing avg.)
VLGC Fleet & Orderbook Review
VLGC orderbook (2013-Onwards) (# vessels)
25
Fleet profile1 (# vessels)
3 2 17
Modern With Scrubber Scrubber Ready
BWTS + IMO low sulphur regulations
• BWTS Convention
• Approx. 65-71 VLGCs will be required to
DD and subsequently install BWTS
between 9/8/2017-9/8/2019
• 2020 Low Sulphur regulations
• Suggest 25% increase in bunker cost
Dorian LPG’s VLGC Fleet is ready:
Potential ScrappingCandidates
Source: Clarksons Research, Dorian LPG analysis
(1) As of March 25, 2018
13
8
35
46
25
5
5 18
12
0
10
20
30
40
50
2013 2014 2015 2016 2017 2018 2019 2020
VLGC Deliveries by Year
Delivered On Order
158
50
37
24
9
24
0
20
40
60
80
100
120
140
160
180
<5 5 to 10 10 to 15 15 to 20 20 to 25 > 25
Financials
Recent Financing Developments: Continuing to Enhance Balance Sheet
Flexibility
• On November 7, 2017, the Company refinanced a 2014-built VLGC, the Corsair, pursuant to a memorandum of
agreement and a bareboat charter agreement that valued the vessel at $65 million. We bareboat chartered the vessel
back for a period of 12 years, with a mandatory buyout in 2029 and purchase options from the 2nd anniversary of the
transaction onwards. The underlying interest rate is 4.9% and the underlying amortization profile is 16 years. The cash
refinancing proceeds of $52.0 million were used to repay $30.1 million of the 2017 Bridge Loan’s then outstanding
principal amount.
• On January 31, 2018, the Company refinanced a 2015-built VLGC, the Concorde, pursuant to a memorandum of
agreement and a bareboat charter agreement that valued the vessel at $70 million. We bareboat chartered the vessel
back for a period of 13 years, with a mandatory buyout in 2031 and purchase options from the end of the 3rd anniversary
of the transaction onwards. The underlying interest rate is 4.9% and the underlying amortization profile is 17.3years.
The cash refinancing proceeds of $56.0 million were used to repay $35.1 million of the 2015 Debt Facility’s then
outstanding principal amount.
• On March 16, 2018, the Company refinanced a 2015-built VLGC, the Corvette, pursuant to a memorandum of agreement
and a bareboat charter agreement, or the Corvette Japanese Financing. The refinancing proceeds of $56.0 million were
used to repay $33.7 million of the 2015 Debt Facility’s then outstanding principal amount. Pursuant to the 2015 Debt
Facility Amendment and in conjunction with this repayment, $1.6 million of restricted cash was released under the 2015
Debt Facility. The remaining proceeds were, or will be, used to pay legal fees associated with this transaction and for
general corporate purposes.
• The Company announced that it expects to enter into new financing arrangements to repay all outstanding amounts under
the DNB Bridge Loan before the end of the quarter ending June 30, 2018.
Statement of Operations Data (USD)
Statement of Operations Data
Three Months Ended
March 31, 2018
(Unaudited)
Three Months Ended
March 31, 2017
(Unaudited)
Revenues $ 39,034,678 $ 47,585,174
Voyage expenses (312,170) (550,691)
Vessel operating expenses (15,892,536) (16,558,807)
General and administrativeexpenses (6,694,250) (5,751,400)
Other income—related parties 643,489 633,883
EBITDA 16,779,211 25,358,159
Depreciation and amortization (16,105,764) (16,113,304)
Operating income/(loss) 673,447 9,244,855
Other income/(expenses), net (4,139,442) (7,289,585)
Net income/(loss) $ (3,465,995) $ 1,955,270
Other Financial Data
Time charter equivalent rate (1) $ 24,695 $ 24,677
Daily vessel operating expenses (2) $ 8,027 $ 8,363
Adjusted EBITDA (3) $ 18,237,423 $ 26,521,977
(1) Our method of calculating time charter equivalent rate is to divide revenue net of voyage expenses by operating days for the relevant time period.
(2) Calculated by dividing vessel operating expenses by calendar days for the relevant time period.
(3) Represents net income excluding the potentially disparate effects between periods of derivatives, interest and finance costs, stock-based
compensation expense, impairment, and depreciation and amortization expense and is used as a supplemental financial measure by
management to assess our financial and operating performance.
28
Statement of Operations Data (USD)
Statement of Operations Data
Year Ended
Mar 31, 2018
(Unaudited)
Year Ended
Mar 31, 2017
(Audited)
Revenues $ 159,334,760 $ 167,447,171
Voyage expenses (2,213,773) (2,965,978)
Vessel operating expenses (64,312,644) (66,108,062)
General and administrativeexpenses (26,186,332) (21,732,864)
Other income—related parties 2,549,325 2,410,542
EBITDA 69,171,336 79,050,809
Depreciation and amortization (65,329,951) (65,057,487)
Operating income 3,841,385 13,993,322
Other income/(expenses), net (24,242,071) (15,435,137)
Net loss $ (20,400,686) $ (1,441,815)
Other Financial Data
Time charter equivalent rate (1) $ 21,966 $ 22,037
Daily vessel operating expenses (2) $ 8,009 $ 8,233
Adjusted EBITDA (3) $ 74,515,790 $ 83,279,670
(1) Our method of calculating time charter equivalent rate is to divide revenue net of voyage expenses by operating days for the relevant time period.
(2) Calculated by dividing vessel operating expenses by calendar days for the relevant time period.
(3) Represents net income excluding the potentially disparate effects between periods of derivatives, interest and finance costs, stock-based
compensation expense, impairment, and depreciation and amortization expense and is used as a supplemental financial measure by
management to assess our financial and operating performance.
30
Cash Flows Data (USD)
Cash Flows Data
Three Months Ended
March 31, 2018
(Unaudited)
Three Months Ended
March 31, 2017
(Unaudited)
Net income/(loss) $ (3,465,995) $ 1,955,270
Adjustments 13,964,893 17,122,866
Changes in operating assets and liabilities 5,803,955 (16,179,218)
Net cash provided by operating activities 16,302,853 2,898,918
Net cash provided by/(used in) investing activities 3,086,056 (218,161)
Net cash provided by/(used in) financing activities 28,573,485 (17,619,196)
Effects of exchange rates on cash and cash equivalents (90,009) 117,352
Net increase/(decrease) in cash and cashequivalents $ 47,872,385 $ (14,821,087)
Cash Flows Data
Year Ended
March 31, 2018
(Unaudited)
Year Ended
March 31, 2017
(Audited)
Net income/(loss) $ (20,400,686) $ (1,441,815)
Adjustments 65,516,838 46,189,541
Changes in operating assets and liabilities 12,132,951 7,356,042
Net cash operating activities 57,249,103 52,103,768
Net cash provided by/(used in) investing activities 24,574,405 (1,981,022)
Net cash provided by/(used in) financing activities 4,671,658 (79,318,882)
Effects of exchange rates on cash and cash equivalents (8,042) (197,274)
Net increase/(decrease) in cash and cashequivalents $ 86,487,124 $ (29,393,410)
31
Balance Sheet Data (USD)
32
Balance Sheet Data
March 31, 2018
(Unaudited)
March 31, 2017
(Audited)
Cash and cash equivalents $ 103,505,676 $ 17,018,552
Restricted cash, non-current 25,862,704 50,874,146
Total assets 1,736,110,156 1,746,234,880
Total debt including current portion – net of deferred financing fees of $16.1 million and $20.1 million
As of March 31, 2018 and 2017, respectively.
759,103,152 749,964,248
Total liabilities 776,696,794 770,233,162
Total shareholders' equity $ 959,413,362 $ 976,001,718
Our Mission is to arrange safe, reliable and trouble free transportation

More Related Content

What's hot

11th FLNG APAC 2013 brochure_website 4 July 2013
11th FLNG APAC 2013 brochure_website 4 July 201311th FLNG APAC 2013 brochure_website 4 July 2013
11th FLNG APAC 2013 brochure_website 4 July 2013
Connie Kirk
 
Industrial Orientaion Report_Daxit Akbari
Industrial Orientaion Report_Daxit AkbariIndustrial Orientaion Report_Daxit Akbari
Industrial Orientaion Report_Daxit Akbari
DAXIT AKBARI 🇮🇳
 
20121202 efar qatar lng_v05
20121202 efar qatar lng_v0520121202 efar qatar lng_v05
20121202 efar qatar lng_v05
QNB Group
 
Dorian lpg june 2016
Dorian lpg june 2016Dorian lpg june 2016
Dorian lpg june 2016
DorianLPG2016
 
Brown Bag (Roy) - EEDI for LNG Tankers
Brown Bag (Roy) - EEDI for LNG TankersBrown Bag (Roy) - EEDI for LNG Tankers
Brown Bag (Roy) - EEDI for LNG Tankers
Biswajoy Roy
 
LIK OIL Company Profile 2014
LIK OIL Company Profile 2014LIK OIL Company Profile 2014
LIK OIL Company Profile 2014
tahir ka'aimuddin
 
VERDIS Presentation - JUL 2015 - DEC INVESTORS
VERDIS Presentation - JUL 2015 - DEC INVESTORSVERDIS Presentation - JUL 2015 - DEC INVESTORS
VERDIS Presentation - JUL 2015 - DEC INVESTORS
Rob Ayasse
 

What's hot (20)

Teekay Group presents at the 2013 Citi One-on-One MLP / Midstream Conference
Teekay Group presents at the 2013 Citi One-on-One MLP / Midstream ConferenceTeekay Group presents at the 2013 Citi One-on-One MLP / Midstream Conference
Teekay Group presents at the 2013 Citi One-on-One MLP / Midstream Conference
 
Structural rules bulk and tanker
Structural rules bulk and tankerStructural rules bulk and tanker
Structural rules bulk and tanker
 
LNG as Fuel magazine
LNG as Fuel magazineLNG as Fuel magazine
LNG as Fuel magazine
 
global lng fleet market
global lng fleet marketglobal lng fleet market
global lng fleet market
 
New base 730 special 17 november 2015
New base 730 special  17 november 2015New base 730 special  17 november 2015
New base 730 special 17 november 2015
 
2015 developments in global gas markets & impact on asia
2015 developments in global gas markets & impact on asia2015 developments in global gas markets & impact on asia
2015 developments in global gas markets & impact on asia
 
11th FLNG APAC 2013 brochure_website 4 July 2013
11th FLNG APAC 2013 brochure_website 4 July 201311th FLNG APAC 2013 brochure_website 4 July 2013
11th FLNG APAC 2013 brochure_website 4 July 2013
 
Industrial Orientaion Report_Daxit Akbari
Industrial Orientaion Report_Daxit AkbariIndustrial Orientaion Report_Daxit Akbari
Industrial Orientaion Report_Daxit Akbari
 
New base energy news issue 952 dated 21 november 2016
New base energy news issue  952 dated 21 november 2016New base energy news issue  952 dated 21 november 2016
New base energy news issue 952 dated 21 november 2016
 
20121202 efar qatar lng_v05
20121202 efar qatar lng_v0520121202 efar qatar lng_v05
20121202 efar qatar lng_v05
 
Dorian lpg june 2016
Dorian lpg june 2016Dorian lpg june 2016
Dorian lpg june 2016
 
Opening Global Markets to Booming U.S. Shale Gas and NGL Production
Opening Global Markets to Booming U.S. Shale Gas and NGL ProductionOpening Global Markets to Booming U.S. Shale Gas and NGL Production
Opening Global Markets to Booming U.S. Shale Gas and NGL Production
 
Brown Bag (Roy) - EEDI for LNG Tankers
Brown Bag (Roy) - EEDI for LNG TankersBrown Bag (Roy) - EEDI for LNG Tankers
Brown Bag (Roy) - EEDI for LNG Tankers
 
Ecofil
EcofilEcofil
Ecofil
 
Your future alternate fuel –LPG
Your future alternate fuel –LPG Your future alternate fuel –LPG
Your future alternate fuel –LPG
 
LIK OIL Company Profile 2014
LIK OIL Company Profile 2014LIK OIL Company Profile 2014
LIK OIL Company Profile 2014
 
Liquefied Natural Gas Limited Bear Head, Nova Scotia LNG Project
Liquefied Natural Gas Limited Bear Head, Nova Scotia LNG ProjectLiquefied Natural Gas Limited Bear Head, Nova Scotia LNG Project
Liquefied Natural Gas Limited Bear Head, Nova Scotia LNG Project
 
VERDIS Presentation - JUL 2015 - DEC INVESTORS
VERDIS Presentation - JUL 2015 - DEC INVESTORSVERDIS Presentation - JUL 2015 - DEC INVESTORS
VERDIS Presentation - JUL 2015 - DEC INVESTORS
 
Small scale LNG operations
Small scale LNG operationsSmall scale LNG operations
Small scale LNG operations
 
New base 12 june 2018 energy news issue 1180 by khaled al awadi
New base 12 june 2018 energy news issue   1180  by khaled al awadiNew base 12 june 2018 energy news issue   1180  by khaled al awadi
New base 12 june 2018 energy news issue 1180 by khaled al awadi
 

Similar to June deck final ppt

August Newsletter - Affinity Small Scale LNG.pdf
August Newsletter  - Affinity Small Scale LNG.pdfAugust Newsletter  - Affinity Small Scale LNG.pdf
August Newsletter - Affinity Small Scale LNG.pdf
AbrorieABE
 
Mds ihs intro pres 9.11.14 gj[2]
Mds ihs intro pres 9.11.14  gj[2]Mds ihs intro pres 9.11.14  gj[2]
Mds ihs intro pres 9.11.14 gj[2]
Joseph Black
 
Teekay LNG Partners Q4 2012 results presentation
Teekay LNG Partners Q4 2012 results presentationTeekay LNG Partners Q4 2012 results presentation
Teekay LNG Partners Q4 2012 results presentation
TradeWindsnews
 
Bumi Armada Q2 2013 results presentation
Bumi Armada Q2 2013 results presentationBumi Armada Q2 2013 results presentation
Bumi Armada Q2 2013 results presentation
TradeWindsnews
 

Similar to June deck final ppt (20)

February investor deck final
February investor deck   finalFebruary investor deck   final
February investor deck final
 
August Newsletter - Affinity Small Scale LNG.pdf
August Newsletter  - Affinity Small Scale LNG.pdfAugust Newsletter  - Affinity Small Scale LNG.pdf
August Newsletter - Affinity Small Scale LNG.pdf
 
Mds ihs intro pres 9.11.14 gj[2]
Mds ihs intro pres 9.11.14  gj[2]Mds ihs intro pres 9.11.14  gj[2]
Mds ihs intro pres 9.11.14 gj[2]
 
Pivotal LNG - 101 - Natural Gas Fuel for Heavy Duty Trucks
Pivotal LNG - 101 - Natural Gas Fuel for Heavy Duty TrucksPivotal LNG - 101 - Natural Gas Fuel for Heavy Duty Trucks
Pivotal LNG - 101 - Natural Gas Fuel for Heavy Duty Trucks
 
Interim Financial Report to 30 November 2011
Interim Financial Report to 30 November 2011Interim Financial Report to 30 November 2011
Interim Financial Report to 30 November 2011
 
Interim results to 30 November 2014
Interim results to 30 November 2014Interim results to 30 November 2014
Interim results to 30 November 2014
 
Tops april2015
Tops april2015Tops april2015
Tops april2015
 
Teekay LNG Partners Fourth Quarter and 2012 Earnings Presentation
Teekay LNG Partners Fourth Quarter and 2012 Earnings PresentationTeekay LNG Partners Fourth Quarter and 2012 Earnings Presentation
Teekay LNG Partners Fourth Quarter and 2012 Earnings Presentation
 
Teekay LNG Partners Q4 2012 results presentation
Teekay LNG Partners Q4 2012 results presentationTeekay LNG Partners Q4 2012 results presentation
Teekay LNG Partners Q4 2012 results presentation
 
khanpersian50 Operation management slided on Shell
 khanpersian50 Operation management slided on Shell khanpersian50 Operation management slided on Shell
khanpersian50 Operation management slided on Shell
 
Total SA - Commitment To Better Safer Cleaner Efficient Innovative Accessible...
Total SA - Commitment To Better Safer Cleaner Efficient Innovative Accessible...Total SA - Commitment To Better Safer Cleaner Efficient Innovative Accessible...
Total SA - Commitment To Better Safer Cleaner Efficient Innovative Accessible...
 
GE
GEGE
GE
 
Natural gas and bio methane as fuel for transport m. koot
Natural gas and bio methane as fuel for transport   m. kootNatural gas and bio methane as fuel for transport   m. koot
Natural gas and bio methane as fuel for transport m. koot
 
Lng
LngLng
Lng
 
Cryoshelter presentation linkedin
Cryoshelter presentation linkedinCryoshelter presentation linkedin
Cryoshelter presentation linkedin
 
Teekay LNG Partners (NYSE: TGP) Investor Day Presentation, Sep 30, 2014
Teekay LNG Partners (NYSE: TGP) Investor Day Presentation, Sep 30, 2014Teekay LNG Partners (NYSE: TGP) Investor Day Presentation, Sep 30, 2014
Teekay LNG Partners (NYSE: TGP) Investor Day Presentation, Sep 30, 2014
 
Is greening of the shipping industry on its way?
Is greening of the shipping industry on its way?Is greening of the shipping industry on its way?
Is greening of the shipping industry on its way?
 
Teekay Group Presents at the 2013 Citi One-on-One MLP / Midstream Conference
Teekay Group Presents at the 2013 Citi One-on-One MLP / Midstream ConferenceTeekay Group Presents at the 2013 Citi One-on-One MLP / Midstream Conference
Teekay Group Presents at the 2013 Citi One-on-One MLP / Midstream Conference
 
Bumi Armada Q2 2013 results presentation
Bumi Armada Q2 2013 results presentationBumi Armada Q2 2013 results presentation
Bumi Armada Q2 2013 results presentation
 
Tops
TopsTops
Tops
 

Recently uploaded

一比一原版MQU毕业证麦考瑞大学毕业证成绩单如何办理
一比一原版MQU毕业证麦考瑞大学毕业证成绩单如何办理一比一原版MQU毕业证麦考瑞大学毕业证成绩单如何办理
一比一原版MQU毕业证麦考瑞大学毕业证成绩单如何办理
aytyn
 
一比一原版CBU毕业证卡普顿大学毕业证成绩单如何办理
一比一原版CBU毕业证卡普顿大学毕业证成绩单如何办理一比一原版CBU毕业证卡普顿大学毕业证成绩单如何办理
一比一原版CBU毕业证卡普顿大学毕业证成绩单如何办理
btohy
 

Recently uploaded (8)

Collective Mining | Corporate Presentation - May 2024
Collective Mining | Corporate Presentation - May 2024Collective Mining | Corporate Presentation - May 2024
Collective Mining | Corporate Presentation - May 2024
 
一比一原版MQU毕业证麦考瑞大学毕业证成绩单如何办理
一比一原版MQU毕业证麦考瑞大学毕业证成绩单如何办理一比一原版MQU毕业证麦考瑞大学毕业证成绩单如何办理
一比一原版MQU毕业证麦考瑞大学毕业证成绩单如何办理
 
Snam 2023-27 Industrial Plan - Financial Presentation
Snam 2023-27 Industrial Plan - Financial PresentationSnam 2023-27 Industrial Plan - Financial Presentation
Snam 2023-27 Industrial Plan - Financial Presentation
 
Collective Mining | Corporate Presentation - May 2024
Collective Mining | Corporate Presentation - May 2024Collective Mining | Corporate Presentation - May 2024
Collective Mining | Corporate Presentation - May 2024
 
cyberagent_For New Investors_EN_240424.pdf
cyberagent_For New Investors_EN_240424.pdfcyberagent_For New Investors_EN_240424.pdf
cyberagent_For New Investors_EN_240424.pdf
 
一比一原版CBU毕业证卡普顿大学毕业证成绩单如何办理
一比一原版CBU毕业证卡普顿大学毕业证成绩单如何办理一比一原版CBU毕业证卡普顿大学毕业证成绩单如何办理
一比一原版CBU毕业证卡普顿大学毕业证成绩单如何办理
 
Investor Day 2024 Presentation Sysco 2024
Investor Day 2024 Presentation Sysco 2024Investor Day 2024 Presentation Sysco 2024
Investor Day 2024 Presentation Sysco 2024
 
New Tax Regime User Guide Flexi Plan Revised (1).pptx
New Tax Regime User Guide Flexi Plan Revised (1).pptxNew Tax Regime User Guide Flexi Plan Revised (1).pptx
New Tax Regime User Guide Flexi Plan Revised (1).pptx
 

June deck final ppt

  • 2. Forward-Looking Statements This presentation contains certain forward-looking statements including analyses and other information based on forecasts of future results and estimates of amounts not yet determinable and statements relating to our future prospects, developments and business strategies. Forward-looking statements are identified by their use of terms and phrases such as “anticipate,” “believe,” “could,” “estimate,” “expect,” “intend,” “may,” “plan,” “predict,” “project,” “will” and similar terms and phrases, including references to assumptions. The forward-looking statements in this presentation are based upon various assumptions, many of which are based, in turn, upon further assumptions, including without limitation, management’s examination of historical operating trends, data contained in our records and other data available from third parties. Although we believe that these assumptions were reasonable when made, because these assumptions are inherently subject to significant uncertainties and contingencies that are difficult or impossible to predict and are beyond our control, we cannot assure you that we will achieve or accomplish these expectations, beliefs or projections. Actual results could differ materially from expectations expressed in the forward-looking statements if one or more of the underlying assumptions or expectations proves to be inaccurate or is not realized. Our actual future results may be materially different from and worse than what we expect. We qualify all of the forward-looking statements by these cautionary statements. We caution readers of this presentation not to place undue reliance on forward-looking statements. Any forward-looking statements contained herein are made only as of the date of this presentation, and we undertake no obligation to update or revise any forward-looking statements, whether as a result of new information, future events or otherwise, except as required by law. Disclaimer 2
  • 3. Dorian LPG at a glance 3 Company overview Global presence Average vessel age vs. globalfleet1 • Dorian LPG is a liquefied petroleum gas shipping company and a leading owner and operator of modern very large gas carriers (“VLGCs”). • The Company was established in 2013 in connection with placing a large order of newbuildings at Hyundai HI. Predecessors have invested in and managed LPG vessels since 2002. • The fleet is comprised of 19 ECO-VLGCs and 3 modern VLGCs, with an average age of 4.1 years. • 18 of the vessels are currently employed in the Helios LPG Pool, founded by the Company together with Phoenix Tankers in Apr-2015. • The remaining vessels are on time charter contracts to major companies. • The Company provides in-house commercial and technical management services for all of the vessels in the fleet, including vessels owned by Dorian LPG deployed in the Helios LPG Pool. • Dorian LPG was listed on the NYSE in 2014 under the ticker “LPG”. The Company has a market cap of USD ~461m as of 15-June-2018 (1) As of 18-June-2018 4.02 8.89 0 1 2 3 4 5 6 7 8 9 10 Dorian Fleet Global Fleet
  • 4. History / background 4 Predecessor entities entered the LPG market in 2002 by acquiring two pressurized vessels Dorian LPG Ltd. established (2013) and the Company listed on NYSE (2014). Dorian LPG raised USD 6882 million in four rounds from Jul-13 to May-14 Number of vessels1 Dorian LPG announced delivery of its last ECO-VLGC newbuilding, the Caravelle and sale of the Grendon, its last remaining 5,000 cbm pressurized gas carrier Part of predecessor entities Dorian LPG First VLGC, Captain Markos NL, was delivered (1) Total LPG vessels on the water; (2) Gross proceeds 1 4 5 5 6 5 6 6 5 4 4 4 6 22 22 22 2002 2003 2004 2005 2006 2007 2008 2009 2010 2011 2012 2013 2014 2015 2016 2017
  • 5. Experienced management team 5 John Hadjipateras Chairman & CEO (Dorian LPG Ltd) With Dorian LPG since inception in 2013. Involved with shipping management since 1972. Experience from Peninsular Maritime, Eagle Ocean, Greek Shipping Corp. Committee, SEACOR and more John Lycouris CEO (Dorian LPG USA) With the Company since 2013. Holds strong experience from Peninsular Maritime and Eagle Ocean. Responsibilities include oversight of the entire newbuilding program and teams in Greece, the UK and the US Costas Markakis President & CEO (Dorian LPG Management) Shipping and legal background with more than 30 years experience in executive and top management positions in ship management companies (commercial and operational) Theodore B. Young CFO (Dorian LPG Ltd) Joined Dorian LPG at inception in 2013. Previous experience include Head of Corporate Development at Eagle Ocean and the buyout firms Irving Place Capital and Harvest Partners Alex Hadjipateras EVP Bus. Devel. (Dorian LPG USA) Joined Dorian LPG in 2013 focusing on business development. Previously responsible for Aframax and VLGC newbuilding at Eagle Ocean, and business development at Avenue A / Razorfish
  • 6. The Helios LPG Pool 6 • The Helios LPG Pool (the “Pool”) was established in April 2015 as a 50-50 partnership between Dorian LPG and Phoenix Tankers, a subsidiary of MOL of Japan • The Pool is comprised of 18 Dorian LPG VLGCs and 4 Phoenix VLGCs, and uses these high-quality assets to offer a complete global LPG maritime solution offering spot freight, TCs, and COAs1 • Earnings are allocated to each vessel participating in the Pool based on “Pool Points”, which are awarded to each vessel on the basis of characteristics such as carrying capacity and speed/consumption (1) Pool vessel composition is accurate as of 6/15/2018.
  • 7. Premium fleet 7 The Company owns and operates 19 ECO- (1) Operated pursuant to Bareboat Lease from Japanese Owners (2) ‘BWTS’ = Ballast Water Treatment System ‘SR’ = Scrubber Ready Fleet overview Comments Type Name CBM Delivered Yard Features 2 ECO VLGC CARAVELLE 84,000 2016 Hyundai HI BWTS VLGCs and 3 modern VLGCs ECO VLGC CHALLENGER 84,000 2015 Hyundai HI BWTS ECO VLGC COPERNICUS 84,000 2015 Daewoo SME BWTS + SR Average fleet age of 4.02 years ECO VLGC CHAPARRAL 84,000 2015 Hyundai HI BWTS + SR ECO VLGC COMMANDER 84,000 2015 Hyundai HI BWTS 16 of the 22 vessels already equipped with ECO VLGC CRATIS 84,000 2015 Daewoo SME BWTS + SR Ballast Water Treatment Systems ECO VLGC CHEYENNE 84,000 2015 Hyundai HI BWTS 2 of the 22 vessels already equipped with ECO VLGC CLERMONT 84,000 2015 Hyundai HI BWTS scrubbers, and an additional 17 are ECO VLGC CONSTELLATION 84,000 2015 Hyundai HI BWTS + SR “scrubber ready” ECO VLGC CRESQUES 84,000 2015 Daewoo SME BWTS + SR ECO VLGC COMMODORE 84,000 2015 Hyundai HI BWTS Captain Markos NL and Captain JohnNP ECO VLGC CONSTITUTION 84,000 2015 Hyundai HI BWTS have recently completed 10 year special ECO VLGC CONTINENTAL 84,000 2015 Hyundai HI BWTS surveys ECO VLGC COBRA 84,000 2015 Hyundai HI BWTS In-house technical and commercial ECO VLGC CONCORDE1 84,000 2015 Hyundai HI BWTS + Scrubber management of fleet ECO VLGC COUGAR 84,000 2015 Hyundai HI BWTS ECO VLGC CORVETTE1 84,000 2015 Hyundai HI Scrubber 18 vessels operate under spot, COA or Time ECO VLGC CORSAIR1 84,000 2014 Hyundai HI SR Charter contracts of less than 24 months ECO VLGC COMET 84,000 2014 Hyundai HI SR In the Helios Pool. Remaining 4 on TC. Modern VLGC CAPTAIN NICHOLAS ML 82,000 2008 Hyundai HI Modern VLGC CAPTAIN JOHN NP 82,000 2007 Hyundai HI All newbuilds delivered and no remaining Modern VLGC CAPTAIN MARKOS NL 82,000 2006 Hyundai HI newbuilding related capital expenditures.
  • 8. 14% 58% 6% 8% 14% Daewoo Hyundai Jiangnan Kawasaki MHI Nagasaki Vessels built at premium Korean Shipyards 8 Total VLGC newbuilding deliveries by shipyard 2006-2017 Comments • The Korean yards Hyundai HI (“HHI”) and Daewoo SME (“DSME”) are two of the world's leading shipbuilders • Dorian LPG and it predecessors have built 24 vessels at HHI since 2004 and maintain a strong relationship with its shipyards • LPG vessels are highly engineered, and exacting technical specifications determine commercial acceptance • HHI and DSME also design and build some of the world’s most complex offshore vessels and rigs HHI is the most active and experienced yard in the design and construction of gas carriers
  • 9. LPG Fundamentals 9 Hundreds of millions of people around the world use LPG at home for applications such as cooking and heating. LPG is the preferred alternative automotive transportation fuel and is increasingly being used as a marine fuel. Millions of businesses rely on LPG. It is the ideal fuel choice for businesses that are not connected to an existing electrical grid. Farmers across the world rely on LPG to meet the challenge of staying competitive in the modern agricultural environment Industries such as aerosol, refrigeration, and chemical feedstock all look to LPG to provide sustainable fuel alternatives What is LPG? Liquefied petroleum gas ("LPG") is a fossil fuel made during natural gas processing and oil refining. LPG is a by product of both oil and natural gas production and more than two-thirds of the LPG people use is extracted directly from the earth. The rest of it is manufactured indirectly from crude oil refining. Why use LPG? LPG is cleaner than coal and oil and an alternative to gasoline. It generates less air pollution and produces fewer emissions of carbon dioxide. LPG is also highly portable, making it a convenient source of energy usable in remote places where ordinary gas supplies are unavailable or have been interrupted. AT HOME ON THE GO AT THE FARM AT WORK OTHER
  • 10. LPG in the petrochemical value chain 10 The LPG value chain Source Processing industries Transport / usage User Natural gas well Oil well Gas plant Natural gas LNG liquefaction Refinery LPG Ammonia Condensates (CPP) Clean products Dirty products Petrochemical gases Pipeline LNG ship LPG Vessels Power generation Residential/ commercial Industrial Auto Further refining Chemicals Agricultural
  • 11. LPG Supply and Export Dynamics
  • 12. Global Liftings showing steady growth Global liftings (MM Tons) 12 Source: IHS, EIA, FGE *Note: Bbls/day converted to MT/yr (bbls per day/11.6 * 365) U.S. Waterborne Exports Middle East Waterborne Exports 60.7 63.0 75.1 85.4 90.6 92.6 23.4 22.0 0M 10M 20M 30M 40M 50M 60M 70M 80M 90M 100M 2012 2013 2014 2015 2016 2017 2017 Mar YTD 2018 Mar YTD Millions 5.1 9.3 13.8 20.5 25.3 29.5 7.9 7.4 0M 5M 10M 15M 20M 25M 30M 35M 2012 2013 2014 2015 2016 2017 2017 Mar YTD 2018 Mar YTD Millions 34.2 32.1 34.8 36.7 39.2 36.8 8.7 8.9 0M 5M 10M 15M 20M 25M 30M 35M 40M 45M 2012 2013 2014 2015 2016 2017 2017 Mar YTD 2018 Mar YTD Millions
  • 13. 15% 19% 25% 29% 32% 51% 47% 45% 44% 40% 12% 11% 10% 10% 10% 8% 11% 10% 8% 8% 14% 12% 10% 8% 9% 0% 20% 40% 60% 80% 100% 2013 2014 2015 2016 2017 US ME N.Sea Med Other U.S. LPG has significantly increased its share of global supply Source: EIA, Bloomberg, IHS, FGE A New Era of Supply 13 • Emergence of U.S. as largest exporting nation has forced price competition amongst all suppliers • Middle East supply has surprised on the upside with more export growth than expected • The Asian market has become increasing reliant on US LPG Seaborne LPG by Source
  • 14. Evolving U.S. NGL / LPG Trade Flows 14 Europe 18% Caribbean 10% China 12% Africa 2%Other 0% Mexico 10% South America 16% Australia 1% Japan 13% Korea 14% Asia - Other 4% Europe 11% Caribbean 9% China 13% Africa 2% Other 1% Mexico 9% South America 13% Australia 1% Japan 23% Korea 13% Asia - Other 5% 2016 2017 U.S. LPG volumes to Asia increased 45% year-over- year (vs. 15% growth in overall U.S. LPG exports). 0 200 400 600 800 1000 1200 1400 2016-01-01 2016-04-01 2016-07-01 2016-10-01 2017-01-01 2017-04-01 2017-07-01 2017-10-01 Butane (+15%) Propane (+15%) Ethane (+289%) U.S. Exports of NGLs (mb/d) – 2016 vs. 2017 +25% y-o-y Source: EvercoreISI
  • 15. U.S. as Global NGL / LPG Price Setter… 15 We believe the U.S. will become the global LPG market price setter given increasing supply at both Mont Belvieu and the Northeast (Marcus Hook) coupled with a liquid trading market and active hedging opportunities along the forward curves. Increasing price circularity as greater volumes of U.S. LPG clear in the international market. Argus CIF ARA OPIS Mont Belvieu Sonatrach CP Saudi CP Argus FEI Source: EvercoreISI
  • 16. LPG Expansion Capacity 16 - 200 400 600 800 1,000 1,200 1,400 1,600 1,800 2017 2018 2019 2020 2021 2022 LPG Exports to Clear Market Existing Capacity Mariner East 2 AltaGas Ridley Island Pembina Prince Rupert • We estimate current LPG export capacity is running at ~91% utilization (LPG nameplate capacity est. at ~1,200 mb/d). • Based on the ‘Base Case’ model, increasing volumes of LPG (propane and butane) will need to be exported in order to clear the market. The total volume is expected to grow from ~1,000 mb/d in 2017 to ~1,300 mb/d in 2020 and ~1,500 mb/d in 2022. The need to clear via exports stems from the lack of incremental domestic demand in the face of increasing levels of production. • The Mariner East II start-up (est. 2018) will provide an outlet for (initially) up to ~275 mb/d. We expect this will provide some near term relief to the Gulf Coast terminals, although we expect that Mariner East II will take some time to fill up. Mariner East II is expected to primarily export NGLs produced in the Appalachian region. Base Case LPG Exports (mb/d) Export capacity tightens. New capacity needed. Source: EvercoreISI
  • 17. LPG Demand & Consumption
  • 18. Growing markets for LPG: CHINA Annual China LPG imports (Tons) 18Source: FGE 4.2M 6.9M 11.9M 15.9M 18.3M 3.9M 4.7M 0M 2M 4M 6M 8M 10M 12M 14M 16M 18M 20M 2013 2014 2015 2016 2017 2017 Mar YTD 2018 Mar YTD Millions
  • 19. Chinese Consumers Continue to Drive LPG Demand 19Source: FGE, Platts • While the restart of coal-fired plants to ease winter power shortages has probably dented Chinese residential heating demand for LPG in the near term, demand from the petrochemical sector is set to rebound with new PDH and alkylation unit start-ups due in 2018 • Residential LPG will still be required in more remote rural areas, where piped gas is unavailable or too costly to install, but overall, chemicals will account for a growing share of China’s LPG demand, especially with a rapidly growing petrochemical base in China. • While no new PDH plants started up in China last year, both the 0.66 Mtpy Fujian Meide plant and Zhejiang Satellite’s 0.45 Mtpy expansion are expected to start up in H2 18 • State-owned refiners are also starting up an estimated 3.7 Mtpy of alkylation units, which will reduce refinery supplies of butane currently sold to standalone deep-processing units, increasing the need for imported supplies. So, Chinese buyers will remain a key source of demand throughout 2018 • Middle Eastern supply alone will not be able to meet demand China LPG imports by source China LPG demand outlook 6.8% 8.4% 15.5% 18.8%10.4% 20.5% 17.0% 23.4% 42.8% 19.6% 18.4% 11.9% 11.3% 10.1% 14.5% 16.4% 6.5% 8.1% 10.3% 6.9% 22.2% 33.3% 24.3% 22.6% 0.0% 20.0% 40.0% 60.0% 80.0% 100.0% 2014 2015 2016 2017 Qatar United States Iran United Arab Emirates Saudi Arabia Others
  • 20. “The year of the LPG consumer”: INDIA • Power conversion project with Vitol • By April, LPG will be used as primary fuel source India LPG import forecast (Million MT) • Indian LPG demand remained near record levels in December 2017, with consumption rising by 45 thousand b/d y/y in Q4 17. • The Modi Government aggressively promoting LPG penetration in rural areas calling 2016 “the year of the LPG Consumer” • The Indian government’s subsidized LPG connection scheme has issued 30.3 million connections since its inception in March 2016 and the country now has at least 181 million subsidized connections • Original target of new connections under latest scheme was increased from 50 million to 80 million by May 2019, suggesting there is plenty of upside for Indian LPG • Non subsidized market growing due to lower international LPG prices • Demand from autogas and the private sector are set to grow amidst favourable auto-fuel economics and a 13% decline in GST tax for private companies • Paradip refinery startup marks last major domestic supply addition supporting further imports • Seaborne LPG imports into India were up 17.1% in 2017, from 10.1mm tons to 11.9mm tons 20Source: IOC, FGE, Energy Aspects 6.M 8.1M 8.9M 10.2M 11.9M 3.1M 3.5M 0M 2M 4M 6M 8M 10M 12M 14M 2013 2014 2015 2016 2017 2017 Mar YTD 2018 Mar YTD Millions
  • 21. Global PDH & Petchems also fueling demand 21 Illustrative increase from Korean PDH Plant • Korean market is saturated but saw a major increase in demand in 2017 from a new PDH facility • PDH importers require high purity propane, best sourced from the US or Middle East • This year could be sustained by the ramp-up of SK Advanced’s PDH plant, stronger heating demand due to frigid temperatures (one of the coldest Januarys on record for Korea) and a growing preference for LPG cracking among petrochemical plants Japan Upgrades cracker capacity • Japan’s Idemitsu Kosan’s JV with Mitsui Chemicals recently announced plans to expand the processing of propane at Idemitsu’s naphtha cracker • The upgrade will boost the Cracker’s capacity to process propane as feedstock by three or four times. • It will mainly rely on LPG imports for feedstock rather than a small quantity of LPG produced at the plant • According to data from Japan LP Gas Association, LPG requirements were driven by residential heating demand for propane. • The cold weather combined with petro-chem demand for Butane picking up on opportunistic switching due to high Naphtha prices demand growth could see further increase 0.00 1.00 2.00 3.00 4.00 5.00 6.00 7.00 8.00 9.00 10.00 2013 2014 2015 2016 2017 Korean LPG Demand by Sector (mmtons) Petrochemical Feedstocks Residential Road Commercial and Public Services Others Source: FGE Europe • European petchem giant INEOS announced this June plans to expand its petrochemical infrastructure in Northwest Europe, with large capacity increases in its Rafnes, Norway and Grangemouth, Scotland crackers, as well as a greenfield 750,000 tons/year PDH unit in an undisclosed location.
  • 22. 22 ✓ Established production hubs ✓ Global supply base ✓ Maritime and land transport options ✓ Price competitive product ✓ Low cost “last mile” infrastructure ✓ Lower greenhouse gas emissions ✓ 20% less CO2 than heating oil ✓ 50% less CO2 than coal ✓ Safe fuel source ✓ Avoids harmful and dangerous waste LPG should be the fuel of choice for emerging economies Source: ExceptionalEnergy.com Key Factors Favoring LPG Adoption for Power Generation and Retail Consumption Strong Fundamentals for Continued LPG Adoption Each year, around 3.5 million premature deaths can be attributed to household air pollution resulting from the traditional use of solid fuels, such as fuelwood and charcoal. Four out of five people in sub-Saharan Africa rely on the traditional use of solid biomass, mainly fuelwood, for cooking. Nearly 3.1 billion people, or 43% of the global population, still rely on polluting fuels (i.e. biomass, coal, kerosene) and technologies for cooking - a major source of household air pollution. Source: World Health Organization Economic Environmental
  • 24. Continued High VLGC Utilization Drivers underlying current rate environment 24 Source: Clarksons Research, Baltic Exchange, Panama Canal Authority Baltic VLGC daily spot TCE rates (USD/d) Global VLGC fleet utilization 86% 85% 2016 2017 • Incremental VLGC fleet growth has been absorbed without severely impacting utilization thus far (i.e. demand for seaborne transport continues to grow in excess of fleet growth) • The Panama Canal Authority increased rates for neo-Panamax VLGCs by 29% in October of 2017. This equates to an increase of ~$2.2/t. Currently, we estimate that 28% of traffic through the expanded canal is VLGCs, second only to container ships at 54%. The increased fees, alongside increased competition from other sectors like LNG, could result in a reduction in VLGC transits which would increase ton mile demand as those ships would then likely transit around the Cape of Good Hope, adding an additional 20-25 days transittime. 0 10,000 20,000 30,000 40,000 50,000 60,000 70,000 2016-01-01 2016-02-01 2016-03-01 2016-04-01 2016-05-01 2016-06-01 2016-07-01 2016-08-01 2016-09-01 2016-10-01 2016-11-01 2016-12-01 2017-01-01 2017-02-01 2017-03-01 2017-04-01 2017-05-01 2017-06-01 2017-07-01 2017-08-01 2017-09-01 2017-10-01 2017-11-01 2017-12-01 2018-01-01 2018-02-01 2018-03-01 2018-04-01 2018-05-01 2018-06-01 Baltic TCE/Day Baltic TCE/Day (4 week trailing avg.)
  • 25. VLGC Fleet & Orderbook Review VLGC orderbook (2013-Onwards) (# vessels) 25 Fleet profile1 (# vessels) 3 2 17 Modern With Scrubber Scrubber Ready BWTS + IMO low sulphur regulations • BWTS Convention • Approx. 65-71 VLGCs will be required to DD and subsequently install BWTS between 9/8/2017-9/8/2019 • 2020 Low Sulphur regulations • Suggest 25% increase in bunker cost Dorian LPG’s VLGC Fleet is ready: Potential ScrappingCandidates Source: Clarksons Research, Dorian LPG analysis (1) As of March 25, 2018 13 8 35 46 25 5 5 18 12 0 10 20 30 40 50 2013 2014 2015 2016 2017 2018 2019 2020 VLGC Deliveries by Year Delivered On Order 158 50 37 24 9 24 0 20 40 60 80 100 120 140 160 180 <5 5 to 10 10 to 15 15 to 20 20 to 25 > 25
  • 27. Recent Financing Developments: Continuing to Enhance Balance Sheet Flexibility • On November 7, 2017, the Company refinanced a 2014-built VLGC, the Corsair, pursuant to a memorandum of agreement and a bareboat charter agreement that valued the vessel at $65 million. We bareboat chartered the vessel back for a period of 12 years, with a mandatory buyout in 2029 and purchase options from the 2nd anniversary of the transaction onwards. The underlying interest rate is 4.9% and the underlying amortization profile is 16 years. The cash refinancing proceeds of $52.0 million were used to repay $30.1 million of the 2017 Bridge Loan’s then outstanding principal amount. • On January 31, 2018, the Company refinanced a 2015-built VLGC, the Concorde, pursuant to a memorandum of agreement and a bareboat charter agreement that valued the vessel at $70 million. We bareboat chartered the vessel back for a period of 13 years, with a mandatory buyout in 2031 and purchase options from the end of the 3rd anniversary of the transaction onwards. The underlying interest rate is 4.9% and the underlying amortization profile is 17.3years. The cash refinancing proceeds of $56.0 million were used to repay $35.1 million of the 2015 Debt Facility’s then outstanding principal amount. • On March 16, 2018, the Company refinanced a 2015-built VLGC, the Corvette, pursuant to a memorandum of agreement and a bareboat charter agreement, or the Corvette Japanese Financing. The refinancing proceeds of $56.0 million were used to repay $33.7 million of the 2015 Debt Facility’s then outstanding principal amount. Pursuant to the 2015 Debt Facility Amendment and in conjunction with this repayment, $1.6 million of restricted cash was released under the 2015 Debt Facility. The remaining proceeds were, or will be, used to pay legal fees associated with this transaction and for general corporate purposes. • The Company announced that it expects to enter into new financing arrangements to repay all outstanding amounts under the DNB Bridge Loan before the end of the quarter ending June 30, 2018.
  • 28. Statement of Operations Data (USD) Statement of Operations Data Three Months Ended March 31, 2018 (Unaudited) Three Months Ended March 31, 2017 (Unaudited) Revenues $ 39,034,678 $ 47,585,174 Voyage expenses (312,170) (550,691) Vessel operating expenses (15,892,536) (16,558,807) General and administrativeexpenses (6,694,250) (5,751,400) Other income—related parties 643,489 633,883 EBITDA 16,779,211 25,358,159 Depreciation and amortization (16,105,764) (16,113,304) Operating income/(loss) 673,447 9,244,855 Other income/(expenses), net (4,139,442) (7,289,585) Net income/(loss) $ (3,465,995) $ 1,955,270 Other Financial Data Time charter equivalent rate (1) $ 24,695 $ 24,677 Daily vessel operating expenses (2) $ 8,027 $ 8,363 Adjusted EBITDA (3) $ 18,237,423 $ 26,521,977 (1) Our method of calculating time charter equivalent rate is to divide revenue net of voyage expenses by operating days for the relevant time period. (2) Calculated by dividing vessel operating expenses by calendar days for the relevant time period. (3) Represents net income excluding the potentially disparate effects between periods of derivatives, interest and finance costs, stock-based compensation expense, impairment, and depreciation and amortization expense and is used as a supplemental financial measure by management to assess our financial and operating performance. 28
  • 29. Statement of Operations Data (USD) Statement of Operations Data Year Ended Mar 31, 2018 (Unaudited) Year Ended Mar 31, 2017 (Audited) Revenues $ 159,334,760 $ 167,447,171 Voyage expenses (2,213,773) (2,965,978) Vessel operating expenses (64,312,644) (66,108,062) General and administrativeexpenses (26,186,332) (21,732,864) Other income—related parties 2,549,325 2,410,542 EBITDA 69,171,336 79,050,809 Depreciation and amortization (65,329,951) (65,057,487) Operating income 3,841,385 13,993,322 Other income/(expenses), net (24,242,071) (15,435,137) Net loss $ (20,400,686) $ (1,441,815) Other Financial Data Time charter equivalent rate (1) $ 21,966 $ 22,037 Daily vessel operating expenses (2) $ 8,009 $ 8,233 Adjusted EBITDA (3) $ 74,515,790 $ 83,279,670 (1) Our method of calculating time charter equivalent rate is to divide revenue net of voyage expenses by operating days for the relevant time period. (2) Calculated by dividing vessel operating expenses by calendar days for the relevant time period. (3) Represents net income excluding the potentially disparate effects between periods of derivatives, interest and finance costs, stock-based compensation expense, impairment, and depreciation and amortization expense and is used as a supplemental financial measure by management to assess our financial and operating performance. 30
  • 30. Cash Flows Data (USD) Cash Flows Data Three Months Ended March 31, 2018 (Unaudited) Three Months Ended March 31, 2017 (Unaudited) Net income/(loss) $ (3,465,995) $ 1,955,270 Adjustments 13,964,893 17,122,866 Changes in operating assets and liabilities 5,803,955 (16,179,218) Net cash provided by operating activities 16,302,853 2,898,918 Net cash provided by/(used in) investing activities 3,086,056 (218,161) Net cash provided by/(used in) financing activities 28,573,485 (17,619,196) Effects of exchange rates on cash and cash equivalents (90,009) 117,352 Net increase/(decrease) in cash and cashequivalents $ 47,872,385 $ (14,821,087) Cash Flows Data Year Ended March 31, 2018 (Unaudited) Year Ended March 31, 2017 (Audited) Net income/(loss) $ (20,400,686) $ (1,441,815) Adjustments 65,516,838 46,189,541 Changes in operating assets and liabilities 12,132,951 7,356,042 Net cash operating activities 57,249,103 52,103,768 Net cash provided by/(used in) investing activities 24,574,405 (1,981,022) Net cash provided by/(used in) financing activities 4,671,658 (79,318,882) Effects of exchange rates on cash and cash equivalents (8,042) (197,274) Net increase/(decrease) in cash and cashequivalents $ 86,487,124 $ (29,393,410) 31
  • 31. Balance Sheet Data (USD) 32 Balance Sheet Data March 31, 2018 (Unaudited) March 31, 2017 (Audited) Cash and cash equivalents $ 103,505,676 $ 17,018,552 Restricted cash, non-current 25,862,704 50,874,146 Total assets 1,736,110,156 1,746,234,880 Total debt including current portion – net of deferred financing fees of $16.1 million and $20.1 million As of March 31, 2018 and 2017, respectively. 759,103,152 749,964,248 Total liabilities 776,696,794 770,233,162 Total shareholders' equity $ 959,413,362 $ 976,001,718
  • 32. Our Mission is to arrange safe, reliable and trouble free transportation