Download as PDF, PPTX

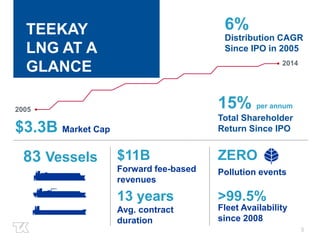
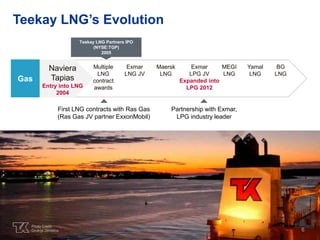
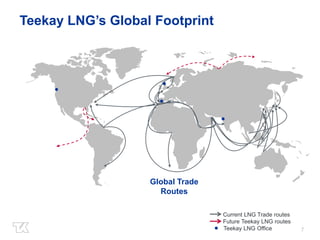
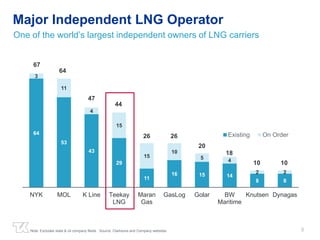
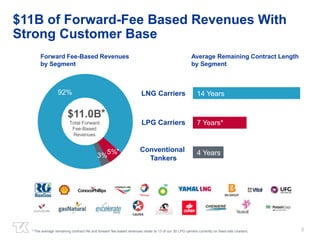
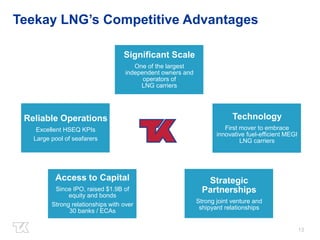
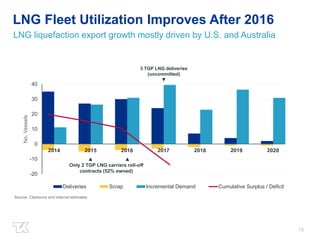
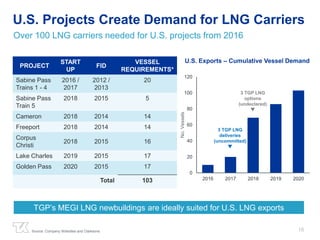
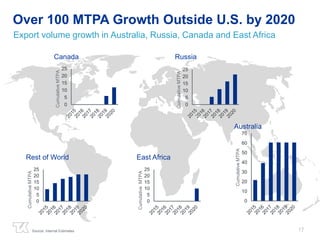
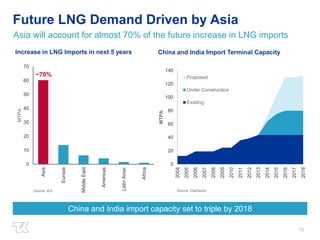
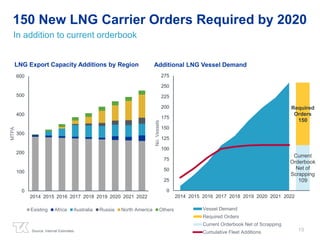
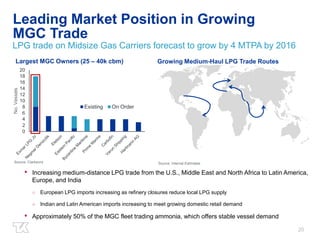
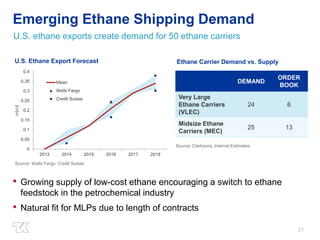
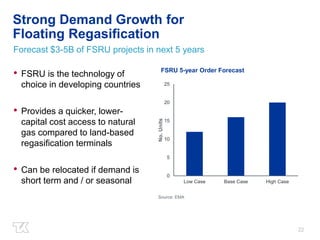
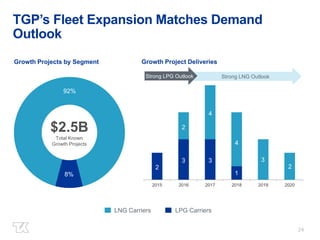
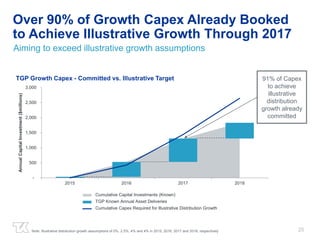

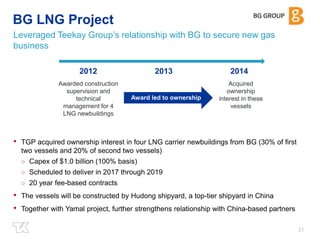
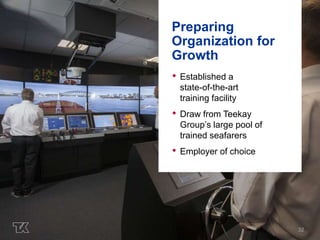
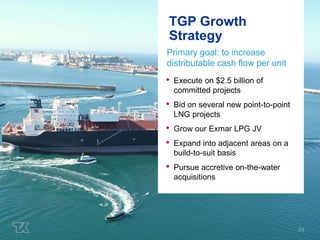

This document provides an overview of Teekay LNG Partners' investor day presentation. It highlights the company's $11 billion in forward fee-based revenues from its LNG and LPG shipping businesses. It also discusses growth opportunities from new LNG export projects in the US and other regions, underpinned by strong Asian demand. The presentation outlines Teekay LNG's competitive advantages including its scale, innovative MEGI LNG carriers, strategic partnerships, and reliable operational performance.


![[Sept 2015] Atmospheric Water Generation for Aquatics Facilities](https://cdn.slidesharecdn.com/ss_thumbnails/calaquaticspresentationv2-150917134404-lva1-app6891-thumbnail.jpg?width=640&height=640&fit=bounds)


