2. 38 Journal of Laboratory Automation 21(1)
and emerging techniques use nucleases conjugated to a spe-
cific DNA binding domain, such as zinc-finger nucleases13
or the Cas9/CRISPR system.14
Of particular interest,
CRISPR has been proven to create multiple mutations in a
mouse in a single step15
and has been demonstrated to cre-
ate a variety of construct types.16
Modified organisms require careful and accurate geno-
typing to identify founding animals and continue produc-
tion through a colony’s lifetime. Like any large-scale effort
with high degrees of complexity, such operations directly
benefit from laboratory automation efforts. Lab robotics
have been used previously to carry out PCR-based genotyp-
ing of mice,17
SNP typing of blood18
and forensic19
samples,
high-resolution melting experiments,20
characterizing
mutated yeast strains,21
genotyping bacterial pathogens,22
performing DNA extraction,20
and automating sequencing
of human disease loci.23
We use lab automation systems to
carry out the bulk of our laboratory’s work: the extraction of
gDNA from ~350,000 samples to assemble >1 M PCR and
qPCR reactions to facilitate analysis of ~800,000 genotypes
per annum.
Previously, we have relied on traditional liquid-handling
robots, using standard aspirate-and-dispense pipetting tech-
nology, to assemble our molecular amplification reactions.
We found that increasing workloads do not scale well on
these platforms; more work requires the installation of more
robots, consuming a good deal of resources (i.e., lab space
and funding). In previous observations and detailed here,
we find these robots do not always produce the precision
desired, nor do they rigorously prevent cross-contamination
between samples. Moreover, there has been little transfor-
mative progress in aspirate-and-dispense technology.
Although incremental progress continues to be made, the
landscape of using robots to transfer liquids using dispos-
able or fixed tips has changed little in the past 15 years. The
introduction of acoustic droplet ejection (ADE) pipettors
drastically changes this landscape.
The history and physics of ADE are well documented in
this journal issue. In brief, energy is acoustically transferred
from a transducer into a microplate containing reagent to be
transferred. This focused energy results in the ejection of a
small droplet (here, 25 nl) that travels directly upward into
an upside-down recipient plate, which captures the droplet
via surface tension.24
Hundreds of droplets can be fired each
second and flown in a very precise manner without any
physical contact being made between the device and the
reagent, greatly reducing cross-contamination.25
Recent
developments to ADE liquid handlers in the past two years
have made these devices accessible to the genomic arena.
We have installed and used ADE lab robotics to carry out
the genotyping of several hundred thousand genetically
engineered rodents. Genotyping is carried out across two
platforms: PCR-based fragment analysis and real-time or
quantitative PCR (qPCR). Below, we present our initial
testing and evaluate this liquid handling platform in the
context of increasing precision while simultaneously reduc-
ing cross-contamination to a great extent. In addition, we
discuss other benefits by adopting this technology: very
large throughput increases, reduction of primer and probe
handling, and potential applications of this technology for
other molecular biology–based applications.
Materials and Methods
Robotic Assembly Platforms
Aspirate-and-dispense liquid-handling robot: Tecan Evo
robots were used as representative traditional laboratory
pipetting robots and were outfitted with standard diameter
system tubing, 0.5 ml syringes, and Span-8 Teflon-coated
fixed tips. Tips are cleaned between reagents via dispensing
of 50 ml distilled water into the wash station, followed by
tip washing with 5 ml distilled water into the shallow wash
station cleaner. System tubing is scrubbed with detergent,
and fixed tips are bleach-treated according to the manufac-
turer’s instructions. The Evo worksurface is outfitted with
labware to hold Eppendorf tubes containing master mix and
assays, gDNA source plates, and 96-well destination PCR
plates.
Acoustic droplet ejection pipettor and supplementary
robotics: Labcyte Echo 525s were chosen to assemble
qPCR reactions by using acoustic droplet ejection. Our con-
figuration contains two Echo 525s accessed by an Access
robotic arm workstation (Fig. 1). The Access deck houses
peripherals necessary for an unattended amplification reac-
tion assembly: a Thermo-Fisher Scientific Combi NL
Universal for bulk dispensing of mastermix and water, a
Nexus Xpeel microplate desealer to remove microplate
adhesive seals, an Agilent PlateLoc Sealer to seal fully
assembled PCR plates, and anAgilent Microplate Centrifuge
to reset reagent menisci before acoustic transfer.
Precision Testing with a qPCR Platform
(Rosa26 Locus)
A pool of gDNA was created from extractions of ~1000 wild-
type mice from preps created using the DNeasy 96 Blood &
Tissue Kit (Qiagen, Venlo, the Netherlands). gDNA template
concentrations in these reactions on the Evo (20 µl) and Echo
(5 µl) platforms were approximately 8 µM. Reactions were
assembled in the following manner: 400 nM forward and
reverse primers, 150 nM probe, and 1× Type-It Fast SNP PCR
Master Mix + ROX dye (Qiagen). Nucleotide sequences for
these oligos are as follows: Rosa26WT forward: CCCGCCC
ATCTTCTAGAAAGA; Rosa26WT reverse: CTGGGCCTG
GGAGAATCC; and Rosa26WT probe: /56-FAM/TTCCCCC
TCTTCCCTCGTGATCTGC/3IABkFQ/. The endogenous
control assay is composed of the following: ApoB forward
by guest on January 30, 2016jla.sagepub.comDownloaded from
3. Cain-Hom et al. 39
primer: CACGTGGGCTCCAGCATT; ApoB reverse primer:
TCACCAGTCATTTCTGCCTTTG (oIMR1544, oIMR3580;
Jackson Laboratory, Bar Harbor, Maine); and ApoB probe:
VIC-CCAATGGTCGGCACTGCTCAA-MGBNFQ (ABI/
Life Technologies, Carlsbad, CA). No-template-control
(NTC) reactions contained distilled water in place of gDNA
template. Assays were cycled on a 7900HT Fast Real-Time
PCR System (ABI/Life Technologies) and were analyzed
using SDS 2.4.1 (ABI/Life Technologies). Assays were
thermal cycled as follows: initial denaturation (95 °C, 5′)
followed by 35 cycles of PCR (95 °C, 60″; 60 °C, 30″; and
72 °C, 60″).
Contamination Testing with a qPCR Platform
(Cre Locus)
Genomic DNA from Cre+
positive mice were purified using
the Agencourt DNAdvance kit (Beckman Coulter, Brea,
CA) executed on a Biomek FXP
liquid handler (Beckman
Coulter). gDNA from 560 animals all harboring a Cre
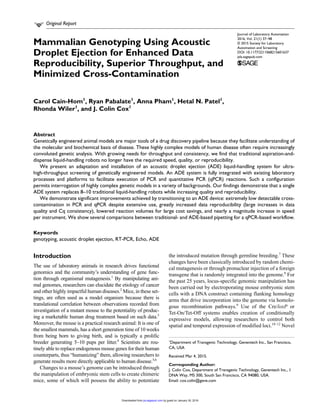
Figure 1. Schematic of a high-
throughput mammalian genotyping
reaction assembly platform using
acoustic droplet ejection. Shown is a
top-down view (top) and a front-
facing view (bottom). The platform
consists of two Labcyte Echo 525s
serviced by an Access robotic arm. In
addition to providing reagent delivery
to the acoustic dispensers, the arm
also serves accessory peripherals:
a microplate sealer, microplate
desealer, microplate centrifuge,
low-volume bulk plate dispenser, and
microplate storage hotels.
by guest on January 30, 2016jla.sagepub.comDownloaded from
4. 40 Journal of Laboratory Automation 21(1)
transgene were pooled to make a Cre+
positive gDNA
“pooled” stock. In addition, 192 mouse gDNA samples
were identified as Cre-harboring samples to represent indi-
vidual (versus pooled) samples. qPCR assays were assem-
bled on the Tecan Evo in 96-well plates to a final volume of
20 µl; the Labcyte 525 was used to construct reactions in a
384-well plates to a final volume of 5 µl. Experimental and
NTC reactions were arranged in an alternating checker-
board pattern. gDNA template concentrations in these reac-
tions on the Evo and Echo platforms were approximately 8
µM and 5 µM, respectively.
The reactions were assembled in the following manner: 400
nM forward and reverse primers, 150 nM probe, and 1×
Type-It Fast SNP PCR Master Mix + ROX dye (Qiagen).
Nucleotide sequences for these transgene oligos are as follows:
Cre forward primer: GCGGTCTGGCAGTAAAAACTATC;
Cre reverse primer: GTGAAACAGCATTGCTGTCACTT
(oIMR1084, oIMR1085; Jackson Laboratory); and Cre probe:
FAM/AA+ACATGC+T/ZEN/TCA+TCG+TCGG/3IABkFQ
(a plus sign preceding the nucleotides indicates LNA bases;
IDT, Coralville, IA). The endogenous control assay was com-
posed of the following: ApoB forward primer: CACGTGGG
CTCCAGCATT; ApoB reverse primer: TCACCAGTCATT
TCTGCCTTTG (oIMR1544, oIMR3580; Jackson Labora-
tory); and ApoB probe: HEX/CC+A+ATGG+TC/ZEN/
GGGCAC+TG/3IABkFQ (IDT; a plus sign preceding the
nucleotides indicates LNA bases). NTC reactions contained
distilled water in place of gDNAtemplate.Assays were cycled
on a C1000 CFX Touch optical thermalcycler (BioRad) and
were analyzed using CFX Manager 3.1 (BioRad).Assays were
thermal cycled as follows: initial denaturation (95 °C, 5′) fol-
lowed by 50 cycles of PCR (95 °C, 60″; 60 °C, 30″; and 72 °C,
60″).
Contamination Testing with a PCR / Fragment
Analysis Platform (PS2 Locus)
Genomic DNA from PS2+
positive mice were purified
using the Agencourt DNAdvance kit (Beckman Coulter)
executed on a Biomek FXP
liquid handler (Beckman
Coulter). gDNA from 143 animals all harboring a PS2
transgene were pooled to make a PS2+
positive gDNA
“pooled” stock. qPCR assays were assembled on the Tecan
Evo in 96-well plates to a final volume of 20 µl; the Labcyte
525 was used to construct reactions in 384-well plates to a
final volume of 5 µl. Experimental and NTC reactions were
arranged in an alternating checkerboard pattern. gDNA
template concentrations in these reactions on the Evo and
Echo platforms were approximately 8 µM and 5 µM,
respectively.
The reactions were assembled in the following manner:
625 nM forward and reverse primers and 1× Type-It Fast
SNP PCR Master Mix + ROX dye (Qiagen). Nucleotide
sequences for these oligos are as follows: PS2 forward
primer: /56-FAM/TCATTGGCTTGTGTCTGACCCT; PS2
reverse primer: GCTTTCAACGTCAGTAGGACAA; IL8R
forward primer: /56-FAM/CTTCGCTGTCGTCCTTGTCT;
and IL8R reverse primer: AGCCATGATCCTGAGAAGTC
CAT. NTC reactions contained distilled water in place of
the gDNA template. 96-well Evo-assembled assays were
cycled on a GeneAmp PCR 9700 System (ABI/LifeTech),
whereas Echo-assembled reactions were cycled on a C1000
CFX Touch.
Assays were thermal cycled as follows: initial denatur-
ation (95 °C, 5′) followed by 30 cycles of PCR (95 °C, 60″;
60 °C, 30″; and 72 °C, 60″). PCR assays were analyzed using
a 3730XL DNA Analyzer (ABI/Life Technologies). POP-7
Performance Optimized Polymer (ABI/Life Technologies)
was used as a matrix within a 50 cm capillary array. GeneScan
600 LIZ size standard (ABI/Life Technologies) was used as a
system control; a 30× dilution of the size standard was car-
ried out in HiDi Formamide (ABI/Life Technologies) and
used to dilute PCR samples by 21×. Ten microliters of the
diluted assays were loaded onto the DNA Analyzer. Data
were analyzed using Gene Mapper 4.0 software (ABI/Life
Technologies).
Results and Discussion
Evaluation of Data Consistency
A traditional liquid handler was directly compared to an
acoustic-based dispenser to evaluate qPCR reaction assem-
bly. Initially, we evaluated the consistency and robustness
of analyzing large cohorts of genetically modified mice on
each platform. We randomly chose a large cohort of mice
containing ~1000 individuals in roughly a dozen colonies
containing the same modified locus. After pooling those
samples together to create a “master” DNA source, we then
set up qPCR reactions containing primer and probes to
interrogate two endogenous control genes (Rosa26 and
ApoB). Care was taken to minimize sources of variability
that could be imparted from other aspects of reaction assem-
bly, such as those attributable to using different lots of assay
reagents, assembling master mixes in multiple sessions, and
so on. Reactions were assembled as described and cycled
35 times while monitoring accumulation of probe signals.
Results are depicted in Figure 2; amplification curves
are shown for each probe channel [i.e., VIC fluorophore
(Apo) and FAM fluorophore (Rosa26)] plotted for each
robotic assembly platform (Fig. 2a). These same data are
presented as an endpoint scatterplot in which the Rosa26
signal is plotted on the X-axis and the ApoB probe signal on
the Y-axis (Fig. 2b). Data resulting fromADE-based assem-
bly demonstrate a higher level of precision than that of tra-
ditionally assembled reactions in both amplification curves
and scatterplots. Specifically, amplification curves (Fig. 2a)
by guest on January 30, 2016jla.sagepub.comDownloaded from
5. Cain-Hom et al. 41
for the ADE-assembled reactions demonstrate more similar
Cq values than those assembled with a classical liquid han-
dler (summarized in Table 1). In this experiment, both
detectors displayed superior standard deviations between
samples when assembled by ADE versus traditional robots.
This is one of many illustrations of an increase in precision
and reproducibility when applying ADE technology to
genomic applications.
Differences in data quality are more apparent when
viewed as a scatterplot (Fig. 2b). Reactions created by tra-
ditional pipetting platforms demonstrate a greater variabil-
ity in the scattercloud (left) than with ADE-assembled
reactions (right). The ratiometric distance between the NTC
signals (black crosses) and the lowest positive RFU values
(green circles) are nearly doubled between the two plat-
forms for both probes. Moreover, three data samples from
the classically assembled reactions are ambiguous and
require reanalysis; zero samples from the ADE platform
were seen to be uncertain. In the context of a mammalian
genotyping laboratory, this is highly impactful. Unlike cell-
based work in which it is commonly accepted that some
data points will drop out due to the nature of high-through-
put workflows, this remains an intractable issue in a vivar-
ium setting. Compassionate welfare standards and strict
adherence to the 3R principles26–28
and Institutional Animal
Care and Use Committee procedures dictate that, in many
A
B
FAM
Cycles
RFU
RFU
1.000E+1
1.000
1.000E-1
1.000E-2
1.000E-3
15 25 35
1.000E+1
1.000
1.000E-1
1.000E-2
1.000E-3
15 25 35
VIC
1.000E+1
1.000
1.000E-1
1.000E-2
1.000E-3
15 25 35
Cycles
Cycles
RFU
RFU
ADE
1.000E+1
1.000
1.000E-1
1.000E-2
1.000E-3
15 25 35
Traditional
Cycles
Traditional
ADE
Cycles
ADETraditional
1 7 14
0.2
2.5
4.5
1 7 14
0.2
2.5
4.5
FAM (Rosa26) RFU FAM (Rosa26) RFU
VIC(ApoB)RFU
VIC(ApoB)RFU
Figure 2. Comparison of
quantitative PCR (qPCR)-based
genotyping data quality by
platform. Amplification curves
(A) and cluster plots (B) are
depicted for both traditional- and
acoustic droplet ejection (ADE)-
assembled reactions. (A) Curves
are illustrated for FAM (top) and
VIC (bottom) channels; the green
line shows the Cq threshold (0.4).
(B) The same data are interpreted
as a cluster plot. Black Xs are
no-template controls (NTCs),
green dots represent experimental
samples, and red dots (highlighted
by a blue circle) denote ambiguous
data samples that cannot be clearly
assigned a genotype.
by guest on January 30, 2016jla.sagepub.comDownloaded from
6. 42 Journal of Laboratory Automation 21(1)
cases, an animal’s genotype must be evaluated to properly
determine the appropriate course of action for that individ-
ual. Significant numbers of samples requiring reanalysis
not only create additional burden and extended turnaround
times for a genetic analysis laboratory but also increase the
workload of a colony resource and management team car-
ing for the genetic models. Reduction of samples requiring
reanalysis is an understated boon when performing analysis
of animal models. Overall, improved clustering yields not
only a reduced reanalysis load but also more rapid and
straightforward cohort-based data analysis.
Evaluation of Cross-Contamination in
Quantitative PCR
One of the many compelling reasons to transition from a
classic to ADE-based reaction setup is the giant reduction in
observable cross-contamination.29,30
In our first tests with
acoustic-based dispense technology (data not shown), we
examined cross-contamination in limited fashion at 35
amplification cycles. Our initial results were promising:
16 of 96 (16.7%) NTC reactions assembled by a tradi-
tional laboratory robot were found to be contaminated
with exogenous gDNA, whereas none of 168 reactions
(0%) assembled by ADE demonstrated any apparent cross-
contamination. Because these data seemed so remarkable,
we wished for a more thorough investigation and so initi-
ated the following study.
We performed this study to evaluate cross-contamination
in two different modes. To examine only platform-to-
platform variability, we ran several series of reactions com-
posed of a single source of gDNA pooled from a large
cohort of mice all sharing the same modified locus. This
facilitates simple comparisons between platforms. To better
mirror actual mammalian genotyping operations, we
repeated these series using individual and unique gDNA
samples. This was done to account for the animal-to-animal
and cohort-to-cohort variability that is observed when
genotyping inbred laboratory strains. We identified many
individual gDNA samples containing the same transgene
(Cre recombinase) under various endogenous mammalian
promoters and probed for it using an endogenous locus
(ApoB) as a positive control. The result of this project is
shown in Figures 3 and 4.
Scatterplots are displayed at a typical amount of PCR
amplification (i.e., 32 cycles; Fig. 3, top row) and an
extreme amount of cycling to clearly observe contamina-
tion (50 cycles; Fig. 3, bottom row). Reactions assembled
using classical robotics (Fig. 3, left column) are compared
to ADE-assembled reactions (Fig. 3, right column). The
results between platforms are striking. In viewing the com-
parison between platforms at 32 cycles, theADE-assembled
reactions show no sign of amplification in NTC controls
(red dots, N = 192). In contrast, nearly all (97.9%) NTC
reactions created by the traditional pipetting platform dem-
onstrated appreciable levels of amplification. At certain lev-
els, this causes reanalysis of certain cohorts when a
particular NTC is no longer statistically significant from
the positive amplification signals in that grouping. In addi-
tion, the relative signal intensity is nearly double with the
ADE-created reactions interrogating the noncontrol probe
(Cre, X-axis). Once again, we observe a large and meaning-
ful increase in the signal-to-noise (S:N) ratios between the
different pipetting technologies.
This trend is more evident at very high levels of amplifi-
cation (50 PCR cycles). Here, virtually all classically
assembled samples now exhibit nearly indistinguishable
amounts of amplification on both Cre and Apo assays
(188/192 replicates, 98.0%). In direct comparison, only a
couple of reactions were positive for the Cre assay (X-axis;
2/192 replicates, 1.0%), whereas none were for the endog-
enous control gene. This impressive reduction in contami-
nation directly results in less ambiguous data and sharply
decreases the number of animals requiring reanalysis.
We repeated the above study with individual gDNAsam-
ples to more accurately mimic variability observed between
individual animals. Scatterplots are again shown with rou-
tine amounts of PCR amplification (32 cycles; Fig. 4, top
row) and an excessive amount of cycling to clearly observe
contamination (50 cycles; Fig. 4, bottom row). Reactions
Table 1. Summary of qPCR Quality Metrics by Assembly Platform.
Traditional Pipetting ADE-Based Pipetting
Sample size
370
(4× 96-well plates)
378
(1× 384-well plate)
Channel FAM VIC FAM VIC
Average Cq 23.94 25.94 23.67 24.51
Minimum Cq 22.96 24.02 23.23 23.97
Maximum Cq 28.84 30.73 24.09 25.21
Standard deviation ±0.41 ±0.74 ±0.16 ±0.18
Average, minimum, and maximum Cq values are provided for FAM and VIC channels, as well as standard deviations. ADE, acoustic droplet ejection;
qPRC, quantitative PCR.
by guest on January 30, 2016jla.sagepub.comDownloaded from
7. Cain-Hom et al. 43
created using traditional platforms (Fig. 4, left column) are
contrasted to reactions assembled by an acoustic pipettor
(Fig. 4, right column). As with the pooled gDNA sample,
comparisons between the two technologies remain particu-
larly compelling. At a routine amount of amplification (32
cycles), the ADE-assembled reactions again show no
observable amplification in NTC controls (red dots, N =
192) and yield unambiguous results. Many NTC samples
(138/192, 71.9%) show appreciable accumulation of signal
on the X-axis [FAM fluorophore (Cre)].
Although displaying a mild increase in variability, the
extreme diagnostic cycling at 50 rounds of PCR mirrors that
of the 32 cycles of amplification (above) observed with the
pooled sample. These individual, genetically modified
mouse samples assembled by ADE show very little appar-
ent contamination with very high cycling (Figure 4): One
NTC sample displays as positive for Cre detection (FAM
fluorophore, 1/192, 0.5%), whereas six NTC samples dis-
play as positive for the Apo allele (HEX fluorophore, 6/192,
3.1%). No NTC reactions constructed acoustically demon-
strated a detectable signal in both channels. In stark con-
trast, all but one NTC reaction created by a traditional
laboratory robot displayed observable amplification after
50 PCR cycles (191/192, 99.5%). The vast majority of
NTCs exhibited strong amplification in both channels
(180/192; 93.8%) with a small subset of samples showing
only Cre detection (11/192; 5.7%). The data for both 32 and
50 amplification cycles are summarized in Figure 5.
As shown in Figure 4, several of the NTC reactions
directly overlap with experimental samples rendering statis-
tical analysis impossible. In the context of a very-high-
throughput genetic analysis laboratory, this can be a critical
50 cycles
32 cycles
1000 400030002000 60005000
0
2500
2000
1500
1000
500
3000
3500
0
Traditional
HEX(ApoB)RFU
FAM (Cre) RFU
1000 400030002000 60005000
0
2500
2000
1500
1000
500
3000
3500
0
ADE
HEX(ApoB)RFU
FAM (Cre) RFU
1000 400030002000 60005000
0
2500
2000
1500
1000
500
3000
3500
0
ADE
HEX(ApoB)RFU
FAM (Cre) RFU
1000 400030002000 60005000
0
2500
2000
1500
1000
500
3000
3500
0
HEX(ApoB)RFU
FAM (Cre) RFU
Traditional
gDNA samples
NTCs
gDNA samples
NTCs
gDNA samples
NTCs
gDNA samples
NTCs
Figure 3. Comparison of contamination observed when performing quantitative PCR (qPCR)-based genotyping using a single, pooled
gDNA sample. Cluster plots are shown for 32 cycles of amplification (top) and 50 cycles (bottom). Reactions were assembled by a
traditional robot (left column) or an acoustic droplet ejection (ADE) robot (right column). Blue dots represent positive samples; red
dots are no-template controls (NTCs).
by guest on January 30, 2016jla.sagepub.comDownloaded from
8. 44 Journal of Laboratory Automation 21(1)
success point for a given assay or colony when this occurs
at normal cycling values. Often, there is a need for all assays
and protocols to follow a standard operating procedure to
maximize the amount of samples that can be accurately ana-
lyzed each day. A liquid-handling system that yields less
obscure data provides results in a context of a higher level
of scientific integrity while simultaneously reducing the
amount of reanalysis required.
Evaluation of Cross-Contamination in CE-Based
Fragment Analysis
As mentioned, our laboratory uses both fragment-based PCR
genotyping as well as quantitative PCR (results described
above). We sought to determine whether use of ADE liquid
handlers resulted in the same gains in data consistency and
cross-contamination reduction. PCR reactions were assem-
bled on both robotic platforms to interrogate PS2, a transgene
known to play a role in amyloid precursor protein processing,
along with IL8R, an endogenous control amplicon targeting
the interleukin 8 (IL8) receptor locus. After assembly, reac-
tions were cycled 30 times and processed on an electropho-
retic capillary-based genetic analyzer. Electropherograms
representing typical data observed in this cohort are illus-
trated in Figure 6. Reactions were assembled by a classical
pipetting robot (Fig. 6, top row) and an ADE device (Fig. 6,
bottom row). gDNA from animals known to harbor the PS2
transgene were used (Fig. 6, left column) alongside NTC
reactions (Fig. 6, right column).
Although the fragment peaks from the PS2+
animals (Fig.
6a,c) are clear, the signal intensity of theADE-assembled PCR
reactions are more intense. We observe cross-contamination
50 cycles
32 cycles
ADE
1000 400030002000 60005000
0
1000
500
0
HEX(ApoB)RFU
FAM (Cre) RFU
3500
3000
2500
2000
1500
gDNA samples
NTCs
Traditional
0
HEX(ApoB)RFU
1000 400030002000 600050000
FAM (Cre) RFU
2500
2000
1500
1000
500
3000
3500
gDNA samples
NTCs
0
2500
2000
1500
1000
500
3000
3500
HEX(ApoB)RFU
Traditional
1000 400030002000 600050000
FAM (Cre) RFU
gDNA samples
NTCs
ADE
1000 400030002000 60005000
0
2500
2000
1500
1000
500
3000
3500
0
HEX(ApoB)RFU
FAM (Cre) RFU
gDNA samples
NTCs
Figure 4. Comparison of contamination observed when performing quantitative PCR (qPCR)-based genotyping using many individual
gDNA samples. Cluster plots are shown for 32 cycles of amplification (top) and 50 cycles (bottom). Reactions were assembled by a
traditional robot (left column) or an acoustic droplet ejection (ADE) robot (right column). Blue dots represent positive samples; red
dots are no-template controls (NTCs).
by guest on January 30, 2016jla.sagepub.comDownloaded from
9. Cain-Hom et al. 45
results on the PCR fragment platform similarly to the qPCR
platform data provided above. NTC reactions created by an
aspirate-and-dispense robot illustrate ample contamination
signals (Fig. 6b) compared to those created by an ADE robot
displaying undetectable amounts of contamination (Fig. 6d).
Notably, there is a large difference in S:N between positive and
negative gDNA samples on the two assembly platforms. S:N
between positive samples and NTCs is ~2.3 and ~8.3, respec-
tively, for the PS2 and IL8R loci. In contrast, with undetectable
contamination in the no-template control reactions, the S:N for
positive and negative reactions assembled byADE approaches
infinity.
We assembled 96 test reactions on the traditional robotic
system (48 positives, 48 NTCs) and 384 reactions on the
acoustic dispenser (192 positives, 192 NTCs). Again, we
found most reactions set up by the classical robotic system
were significantly contaminated (44/48, 91.7%), whereas
none of the 192 control reactions constructed via ADE pos-
sessed detectable contamination. It should be noted that dif-
ferent levels of contamination result in unique outcomes
dependent on the assay. In this case, the level of observed
contamination, although undesired, still results in the ability
to call the genotype with a fair degree of confidence. An
analyst evaluating these data could determine that there is
still decent S:N between NTCs and experimental samples
and conclude animal genotypes. However, working in such
a mode retards analysis speed while increasing risk and
errors in human interpretation.
In general, we noted that contamination of the blanks was
often dependent on the last reagent pipetted before aspirating
water for the “template” in an NTC reaction. Despite following
manufacturer’s instructions for maintenance and operational
procedures, if the last reagent pipetted was a gDNAsource, we
observed contaminated NTCs despite thorough tip washing. In
contrast, if water was transferred previously and then water
was transferred again, that NTC was often observed to have
little or no detectable contamination. This suggests that, in cer-
tain cases, fixed tips combined with the use of standard wash-
ing protocols may be insufficient for particular genomics
applications.
Conclusions
We have illustrated the large differences in data quality and
precision that can transpire from adaptation of anADE instru-
ment. Moreover, the observed reduction in contamination
and its effects on data interpretation and analysis can be
highly impactful, especially in terms of carrying out genotyp-
ing of genetically modified animals. In addition to its preci-
sion,ADE liquid handlers clearly excel in throughput as well.
All of our ADE experiments in this body of work required
10–11 minutes to cherrypick 384 gDNA samples to their cor-
responding assays. In contrast, these same experiments car-
ried out on an aspirate-and-dispense platform required 64–67
minutes to complete. In our workflow, this equates a single
ADE dispenser being as productive as six or seven traditional
laboratory pipetting robots. This is notable considering that
the classic platforms did not have the ability to spin-down
plates, remove adhesive seals, or place new seals on plates;
these functions were carried out by laboratory personnel and
did not factor into the above time calculations. In contrast,
the 10–11-minute workflow of the ADE instrument does
include those steps, making the instrument much more
“walk-away” than the classic robotic platforms.
Traditional
IndividualPooled
ADE
IndividualPooled
200
150
100
50
0
32 cycles
Numberofwells
200
150
100
50
0
Traditional
IndividualPooled
ADE
IndividualPooled
50 cycles
Numberofwells
HEX (ApoB)
FAM (Cre)
A B
HEX (ApoB)
FAM (Cre)
Figure 5. Summary of contaminated wells by assembly platform. In this illustration, a well is considered to present contamination
when displaying >500 relative fluorescent units (RFUs) at the given PCR cycle value: (A) 32 cycles; and (B) 50 cycles. FAM signal (Cre
locus) is red; HEX signal (ApoB locus) is blue. Each graph illustrates contaminated wells when assembled with traditional technology
(left portion) or an acoustic droplet ejection (ADE) device (right portion).
by guest on January 30, 2016jla.sagepub.comDownloaded from
10. 46 Journal of Laboratory Automation 21(1)
ADE pipettors have been demonstrated to operate more
quickly and with more precision than traditional laboratory
robots while greatly reducing contamination. With such a
large difference between the two platforms, we expect ADE
devices to rapidly start replacing routine applications using
traditional pipetting robots, such as those used to assemble
PCR and qPCR reactions. Not only are the operational met-
rics of these devices quite advanced beyond what is com-
mercially available, but also the return on investment (ROI)
can be quite high, enabling straightforward facilitation of
these devices in commercial enterprises. We took advantage
of the platform to transition our genotyping reactions from
20 µl in 96-well plates to 3–5 µl reactions in 384-well plates.
This equates to an annual reduction in master mix of 75%
and reduction in assay reagents by roughly 50% (rather than
75% as might be expected, owning to the dead volume
required in an ADE source plate).
Moreover, we were able to resolve a large resource commit-
ment by transitioning to an ADE-based process. A given PCR
assay from our inventory may be composed of 2–4 primers; a
qPCR assay will contain 3–8 oligonucleotides (2–5 primers
and 1–3 probes). Previously, it took a technician’s entire effort
to maintain our library of ~800 genotyping assays, composed
of several thousand oligonucleotide tubes. These required
assay stock generation from which dilutions would be made
and placed on the traditional pipetting platforms in an on-
demand situation. Currently, we now order all assays premixed
and aliquoted in 384-well source plates, requiring nearly no
preparation to prepare for an ADE instrument. This facilitates
the redirection of a technician’s efforts to more productive
C
A
D
B
PS2IL8R
10000
6000
3000
0
150 250 350
Fragment size (bp)
10000
6000
3000
0
10000
6000
3000
0
PS2IL8R
IL8R
10000
6000
3000
0
Fragment size (bp)
150 250 350
150 250 350
Fragment size (bp)
150 250 350
Fragment size (bp)
RFU
RFU
RFU
RFU
Traditional
ADE
Traditional
ADE
IL8R
PS2
PS2
Figure 6. Comparison of contamination observed when performing PCR fragment-based genotyping. Electropherograms are
displayed for reactions assembled on a traditional liquid handler (top row) and an acoustic pipettor (bottom row). Samples positive for
(A,C) the PS2 transgene were interrogated alongside (B,D) corresponding NTCs. PS2 bins are pink; the endogenous control locus
(IL8R) bins are gray.
by guest on January 30, 2016jla.sagepub.comDownloaded from
11. Cain-Hom et al. 47
endeavors, such as data analysis instead of manual pipetting.
Because of these reagent and personnel savings, a genomics
lab could expect an ADE dispenser with accessory robotic
peripherals to achieve its ROI in 1–2 years.
In addition, this body of work demonstrates the ability of
ADE devices to assemble PCR and qPCR reactions with an
impressive amount of contamination reduction. There are
various sources of potential contamination in an automated
laboratory; samples can become contaminated during DNA
extraction,31
while reaction assembly takes place,32
or even
during thermal cycling.33
It is possible that if we had used a
classical liquid handler with disposable pipette tips, rather
than fixed tips, we could observe different or reduced pat-
terns of contamination in the above experiments. In an high-
throughput laboratory, however, disposable tips are often
avoided. Setting up more than 1 million reactions annually
could require many million disposable tips adding a signifi-
cant increase to cost per genotype. Moreover, tips and tip
waste occupy valuable real estate on a robot’s worksurface,
decreasing a device’s per-run density. Finally, plastic tips
have been shown to leach bioactive compounds into the
assembled assays, affecting experimental outcomes.34–36
ADE technology has broad applications across the fields
of molecular biology, genomics, and drug discovery. For
instance, a workflow has been recently described that would
apply next-generation sequencing (NGS) techniques to
characterizing on- and off-target CRIPSR editing events in
a genome.37
Portions of such a process, notably multiplex-
ing and barcoding steps, could be quite amenable to an
acoustic-based liquid handler. Although it could be more
challenging to use ADE technology for certain operations
(e.g., transferring microbeads or cell suspensions), it
becomes straightforward to envision replacing classical
robotic systems with ones containing ADE robots for rou-
tine source-to-destination cherrypicking. In short, ADE
devices could potentially carry out a large diversity of
molecular biology applications, especially those processes
that most benefit from rapid pipetting and a high degree of
precision, or those sensitive to potential contamination
sources.
Acknowledgments
We would like to thank additional laboratory members who con-
tributed to this effort: Deborah Siler, Maria Martinez, Gregg Sy,
and Emily Hunley. The following colleagues provided a great deal
of expertise in transitioning to an acoustic-based workflow:
Timothy D. Dawes, Richie Rodriguez, Peter Thana, Justin
Bramwell, Randy Dyer, Howard Lee, and Mike Travis. Finally,
we are thankful to Ichiro Matsumura for guidance.
Declaration of Conflicting Interests
The authors declared no potential conflicts of interest with respect
to the research, authorship, and/or publication of this article.
Funding
The authors disclosed receipt of the following financial support
for the research, authorship, and/or publication of this article: This
study was completed using internal funding sources.
References
1. Sung, Y. H.; Song, J.; Lee, H. W. Functional Genomics
Approach Using Mice. J. Biochem. Mol. Biol. 2004, 37, 122–
132.
2. Frese, K. K.; Tuveson, D. A. Maximizing Mouse Cancer
Models. Nat. Rev. Cancer. 2007, 7, 645–658.
3. Zambrowicz, B. P.; Sands, A. T. Knockouts Model the 100
Best-Selling Drugs—Will They Model the Next 100? Nat.
Rev. Drug Discov. 2003, 2, 38–51.
4. Silver, L. M. Mouse Genetics: Concepts and Application.
Oxford University Press: New York, 1995; pp 1–14.
5. Nebert, D. W.; Dalton, T. P.; Stuart, G. W.; et al. “Gene-Swap
Knock-In” Cassette in Mice to Study Allelic Differences in
Human Genes. Ann. N. Y. Acad. Sci. 2000, 919, 148–170.
6. Xie, W.; Barwick, J. L.; Downes, M.; et al. Humanized
Xenobiotic Response in Mice Expressing Nuclear Receptor
SXR. Nature. 2000, 406, 435–439.
7. Phillips, M. I.; Tang, Y. L. Genetic Modification of Stem
Cells for Transplantation. Adv. Drug. Deliv. Rev. 2008, 60,
160–172.
8. Silver, L. M. Mouse Genetics: Concepts and Applications.
Oxford University Press: New York, 1995; pp 114–132.
9. Mortensen, R. Overview of Gene Targeting by Homologous
Recombination. Curr. Protoc. Mol. Biol. 2006, 23, unit 23 21.
10. Kuhn, R.; Torres, R. M. Cre/loxP Recombination System and
Gene Targeting. Methods. Mol. Biol. 2002, 180, 175–204.
11. Brault, V.; Besson, V.; Magnol, L.; et al. Cre/loxP-Mediated
Chromosome Engineering of the Mouse Genome. Handb.
Exp. Pharmacol. 2007, 29–48.
12. Sun, Y.; Chen, X.; Xiao, D. Tetracycline-Inducible Expression
Systems: New Strategies and Practices in the Transgenic Mouse
Modeling. Acta Biochim. Biophys. Sinica. 2007, 39, 235–246.
13. Belizario, J. E.; Akamini, P.; Wolf, P.; et al. New Routes for
Transgenesis of the Mouse. J. Appl. Genet. 2012, 53, 295–
315.
14. Cong, L.; Ran, F. A.; Cox, D.; et al. Multiplex Genome
Engineering Using CRISPR/Cas Systems. Science. 2013,
339, 819–823.
15. Wang, H.; Yang, H.; Shivalila, C. S.; et al. One-Step
Generation of Mice Carrying Mutations in Multiple Genes
by CRISPR/Cas-Mediated Genome Engineering. Cell. 2013,
153, 910–918.
16. Yang, H.; Wang, H.; Jaenisch, R. Generating Genetically
Modified Mice Using CRISPR/Cas-Mediated Genome
Engineering. Nat. Protoc. 2014, 9, 1956–1968.
17. Linask, K. L.; Lo, C. W. High-Throughput Mouse Genotyping
Using Robotics Automation. Biotechniques. 2005, 38, 219–
223.
18. Le Goff, G. C.; Bres, J. C.; Rigal, D.; et al. Robust, High-
Throughput Solution for Blood Group Genotyping. Anal.
Chem. 2010, 82, 6185–6192.
by guest on January 30, 2016jla.sagepub.comDownloaded from
12. 48 Journal of Laboratory Automation 21(1)
19. Stangegaard, M.; Tomas, C.; Hansen, A. J.; et al. Biomek-3000
and GenPlex SNP Genotyping in Forensic Genetics. J. Assoc.
Lab. Automation. 2008, 13, 297–303.
20. Seipp, M. T.; Herrmann, M.; Wittwer, C. T. Automated DNA
Extraction, Quantification, Dilution, and PCR Preparation for
Genotyping by High-Resolution Melting. J. Biomol. Tech.
2010, 21, 163–166.
21. Franco-Duarte,R.;Mendes,I.;Gomes,A.C.;etal.Genotyping
of Saccharomyces cerevisiae Strains by Interdelta Sequence
Typing Using Automated Microfluidics. Electrophoresis.
2011, 32, 1447–1455.
22. O’Farrell,B.;Haase,J.K.;Velayudhan,V.;etal.Transforming
Microbial Genotyping: A Robotic Pipeline for Genotyping
Bacterial Strains. PLoS One. 2012, 7, e48022.
23. Bortot, B.; Athanasakis, E.; Brun, F.; et al. High-Throughput
Genotyping Robot-Assisted Method for Mutation Detection
in Patients with Hypertrophic Cardiomyopathy. Diagn. Mol.
Pathol. 2011, 20, 175–179.
24. Ellson, R.; Mutz, M.; Browning, B.; et al. Transfer of Low
Nanoliter Volumes between Microplates Using Focused
Acoustics-Automation Considerations. J. Assoc. Lab.
Automation. 2003, 8, 29–34.
25. Barco, J. Flexible qPCR Assay Assembly Liquid Handler
Designed to Reduce Contamination Risk and Operational
Costs. GEN. Apr 1, 2013.
26. Parker, R. M.; Browne, W. J. The Place of Experimental
Design and Statistics in the 3Rs. Ilar. J. 2014, 55, 477–485.
27. Russell, W. M. The Development of the Three Rs Concept.
Altern. Lab Anim. 1995, 23, 298–304.
28. Griffin, G.; Clark, J. M.; Zurlo, J.; et al. Scientific Uses
of Animals: Harm-Benefit Analysis and Complementary
Approaches to Implementing the Three Rs. Rev. Sci. Tech.
2014, 33, 265–272.
29. Griffith, D.; Northwood, R.; Owen, P.; et al. Implementation
and Development of an Automated, Ultra-High-Capacity,
Acoustic, Flexible Dispensing Platform for Assay-Ready
Plate Delivery. J. Lab. Autom. 2012, 17, 348–358.
30. Quintero, C.; Rosenstein, C.; Hughes, B.; et al. Quality
Control Procedures for Dose-Response Curve Generation
Using Nanoliter Dispense Technologies. J. Biomol. Screen.
2007, 12, 891–899.
31. Perry, M. D.; White, P. L.; Barnes, R. A. Comparison of
Four Automated Nucleic Acid Extraction Platforms for
the Recovery of DNA from Aspergillus fumigatus. J. Med.
Microbiol. 2014, 63, 1160–1166.
32. Fregeau, C. J.; Yensen, C.; Elliott, J.; et al. Optimized
Configuration of Fixed-Tip Robotic Liquid-Handling Stations
for the Elimination of Biological Sample Cross-Contamination.
J. Assoc. Lab. Automation. 2007, 12, 339–354.
33. Stals, A.; Werbrouck, H.; Baert, L.; et al. Laboratory Efforts to
Eliminate Contamination Problems in the Real-Time RT-PCR
Detection of Noroviruses. J. Microbiol. Methods 2009, 77, 72–76.
34. Watson, J.; Greenough, E. B.; Leet, J. E.; et al. Extraction,
Identification, and Functional Characterization of a Bioactive
Substance from Automated Compound-Handling Plastic
Tips. J. Biomol. Screen. 2009, 14, 566–572.
35. McDonald, G. R.; Hudson, A. L.; Dunn, S. M.; et al.
Bioactive Contaminants Leach from Disposable Laboratory
Plasticware. Science. 2008, 322, 917.
36. Olivieri, A.; Degenhardt, O. S.; McDonald, G. R.; et al. On
the Disruption of Biochemical and Biological Assays by
Chemicals Leaching from Disposable Laboratory Plasticware.
Can. J. Physiol. Pharmacol. 2012, 90, 697–703.
37. Singh, P.; Schimenti, J. C.; Bolcun-Filas, E. A Mouse
Geneticist’s Practical Guide to CRISPR Applications. Genetics
2015, 199, 1–15.
by guest on January 30, 2016jla.sagepub.comDownloaded from