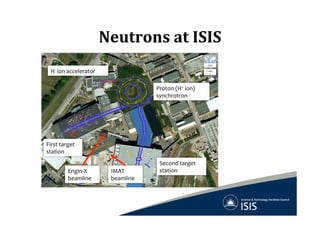
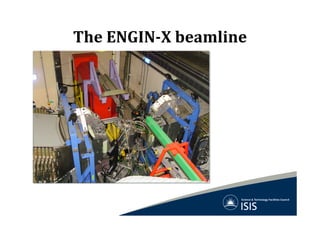
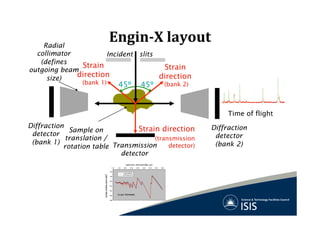
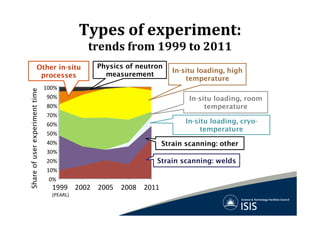
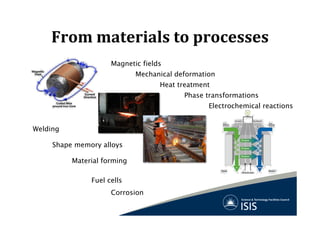
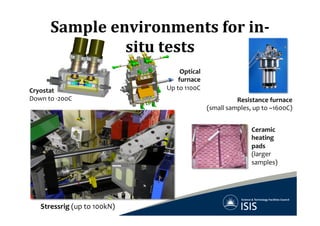
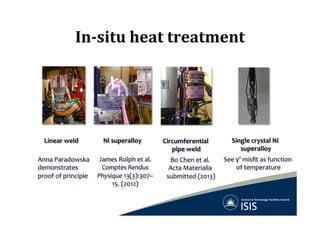
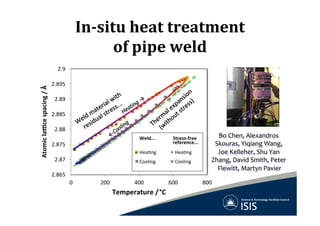
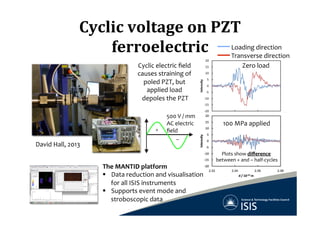
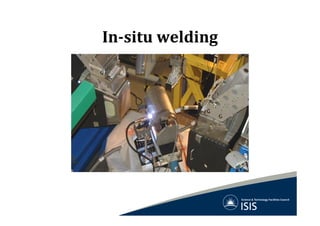
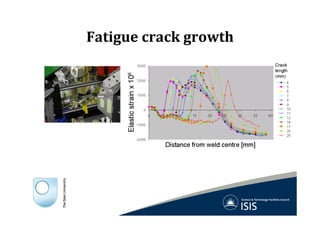
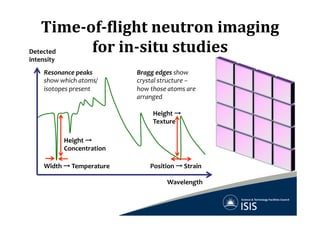
Using	
  neutrons	
  for	
  in-­‐situ	
  
observation	
  of	
  engineering	
  
material	
  behaviour	


Joe	
  Kelleher	
  
Instrument	
  Scientist,	
  ENGIN-­‐X	
  beamline,	
  ISIS	
  
Neutrons	
  at	
  ISIS	
  
H-­‐	
  ion	
  accelerator	
  
Proton	
  (H+	
  ion)	
  
synchrotron	
  
Second	
  target	
  
station	
  
First	
  target	
  
station	
  
Engin-­‐X	
  
beamline	
  
IMAT	
  
beamline	
  
The	
  ENGIN-­‐X	
  beamline	
  
Incident beam
South detector bank
North detector bank
Engin-­‐X	
  layout	
  Radial
collimator
(defines
outgoing beam
size)
Incident slits
Strain
direction
(bank 1)
Diffraction
detector
(bank 1)
Diffraction
detector
(bank 2)
Strain
direction
(bank 2)45º 45º
Sample on
translation /
rotation table
Strain direction
(transmission
detector)
Time of flight
1.0 1.5 2.0 2.5 3.0 3.5 4.0 4.5 5.0
16
18
20
22
24
26
28
β-Sn powder
Totalcrosssection(barns)
Neutron wavelength (Å)
Experiment
Calculation
Transmission
detector
Types	
  of	
  experiment:	
  
trends	
  from	
  1999	
  to	
  2011	
  
0%
10%
20%
30%
40%
50%
60%
70%
80%
90%
100%
1999	
  
(PEARL)
2002 2005 2008 2011
Strain scanning: welds
Strain scanning: other
In-situ loading, room
temperature
In-situ loading, high
temperature
Other in-situ
processes
Physics of neutron
measurement
In-situ loading, cryo-
temperature
Shareofuserexperimenttime
From	
  materials	
  to	
  processes	
  
Magnetic fields
Electrochemical reactions
Mechanical deformation
Heat treatment
Phase transformations
Welding
Fuel cells
Corrosion
Shape memory alloys
Material forming
Stressrig	
  (up	
  to	
  100kN)	
  
Cryostat	
  
Down	
  to	
  -­‐200C	
  
Optical	
  
furnace	
  
Up	
  to	
  1100C	
  
Resistance	
  furnace	
  
(small	
  samples,	
  up	
  to	
  ~1600C)	
  
Sample	
  environments	
  for	
  in-­‐
situ	
  tests	
  
Ceramic	
  
heating	
  
pads	
  
(larger	
  
samples)	
  
In-­‐situ	
  heat	
  treatment	
  
Linear	
  weld	
   Ni	
  superalloy	
   Circumferential	
  
pipe	
  weld	
  
Single	
  crystal	
  Ni	
  
superalloy	
  
Anna	
  Paradowska	
  
demonstrates	
  
proof	
  of	
  principle	
  
James	
  Rolph	
  et	
  al.	
  
Comptes	
  Rendus	
  
Physique	
  13(3):307–
15.	
  (2012)	
  
Bo	
  Chen	
  et	
  al.	
  
Acta	
  Materialia	
  
submitted	
  (2013)	
  
See	
  γ’	
  misfit	
  as	
  function	
  
of	
  temperature	
  
In-­‐situ	
  heat	
  treatment	
  	
  
of	
  pipe	
  weld	
  
2.865
2.87
2.875
2.88
2.885
2.89
2.895
2.9
0 200 400 600 800
Atomic	
  la*ce	
  spacing	
  /	
  Å	
  
Temperature	
  /	
  °C
Weld... Stress-­‐free
reference...
Hea8ng Hea8ng
Cooling Cooling
Bo	
  Chen,	
  Alexandros	
  
Skouras,	
  Yiqiang	
  Wang,	
  
Joe	
  Kelleher,	
  Shu	
  Yan	
  
Zhang,	
  David	
  Smith,	
  Peter	
  
Flewitt,	
  Martyn	
  Pavier	
  
Cyclic	
  voltage	
  on	
  PZT	
  
ferroelectric	
  
100	
  MPa	
  applied	
  
Zero	
  load	


The	
  MANTID	
  platform	
  
§  Data	
  reduction	
  and	
  visualisation	
  
for	
  all	
  ISIS	
  instruments	
  
§  Supports	
  event	
  mode	
  and	
  
stroboscopic	
  data	


David	
  Hall,	
  2013	


  Loading	
  direction	


  Transverse	
  direction	


500	
  V	
  /	
  mm	
  
AC	
  electric	
  
field	


Cyclic	
  electric	
  field	
  
causes	
  straining	
  of	
  
poled	
  PZT,	
  but	
  
applied	
  load	
  
depoles	
  the	
  PZT	


Plots	
  show	
  difference	
  
between	
  +	
  and	
  –	
  half-­‐cycles	


–	
  
+	
  
In-­‐situ	
  welding	
  
Fatigue	
  crack	
  growth	
  
Practical	
  considerations	
  
• Sample	
  environment	
  
–  Sufficiently	
  non-­‐interacting	
  with	
  neutron	
  beam	
  
–  ‘Contains’	
  the	
  process	
  for	
  steady-­‐state,	
  safety	
  
• Timing	
  for	
  dynamic	
  effects	
  
–  Synchronise	
  clocks	
  or	
  use	
  trigger	
  pulses	
  
–  Get	
  event	
  mode	
  acquisition	
  to	
  collect	
  other	
  data	
  
• Can	
  we	
  record	
  more	
  than	
  just	
  the	
  neutron	
  
data?	
  
Supplementary	
  analytical	
  
methods	
  
Things	
  that	
  might	
  change	
  in	
  a	
  
process	
  
•  Mechanical	
  deformation,	
  
stress	
  and	
  strain	
  
•  Material	
  ‘damage’	
  
•  Phase	
  changes	
  
•  Diffusion	
  
•  Temperature	
  
Methods	
  that	
  might	
  reveal	
  
these	
  changes	
  
•  Image	
  correlation	
  
•  Acoustic	
  emission	
  
•  Thermoelastography	
  
•  Dilatometry	
  
•  Calorimetry	
  
•  Ultrasonic	
  and	
  magnetic	
  
methods	
  
•  Sometimes	
  possible	
  to	
  measure	
  these	
  ‘for	
  
free’	
  with	
  existing	
  sensors	
  
Full-­‐spectrum	
  imaging	
  
• Neutron	
  detectors	
  not	
  intrinsically	
  sensitive	
  
to	
  wavelength,	
  but	
  to	
  time	
  of	
  detection	
  
–  …hence	
  velocity,	
  hence	
  wavelength	
  
• Each	
  pixel	
  of	
  a	
  2D	
  detector	
  can	
  record	
  a	
  full	
  
wavelength	
  spectrum	
  
• We	
  can	
  thus	
  see	
  both	
  spatial	
  and	
  temporal	
  
variation	
  in	
  several	
  physical	
  parameters	
  
Time-­‐of-­‐Klight	
  neutron	
  imaging	
  
for	
  in-­‐situ	
  studies	
  
Bragg	
  edges	
  show	
  
crystal	
  structure	
  –	
  
how	
  those	
  atoms	
  are	
  
arranged	
  
Resonance	
  peaks	
  
show	
  which	
  atoms/
isotopes	
  present	
  
Wavelength	
  
Detected	
  
intensity	
  
Height	
  →	
  
Texture	
  
Height	
  →	
  
Concentration	
  
Width	
  →	
  Temperature	
   Position	
  →	
  Strain	
  
Steven	
  Peetermans	
  &	
  Joe	
  
Kelleher	
  (2013)	
  
17
Transmission	
  spectrum	
  from	
  
single	
  crystal	
  
Σabs+Σinc+Σinel,coh
Σel,coh
Position = Orientation
and strain
Width = Mosaicity
Conclusion:	
  Some	
  future	
  
directions?	
  
• Broader	
  array	
  of	
  sensing	
  and	
  actuation	
  on	
  
beamlines	
  
–  	
  Users	
  won’t	
  need	
  to	
  bring	
  their	
  own	
  
• Flexible	
  data	
  chopping	
  with	
  event	
  mode	
  
–  Especially	
  cyclic	
  or	
  highly	
  dynamic	
  processes	
  
• Sensor	
  /	
  actuator	
  bus	
  for	
  real	
  time	
  
measurement	
  and	
  control	
  (e.g.	
  CANBUS	
  for	
  
vehicles)	
  

Joe Kelleher Presentation (May 27th 2014)

  • 1.
    Using  neutrons  for  in-­‐situ   observation  of  engineering   material  behaviour     Joe  Kelleher   Instrument  Scientist,  ENGIN-­‐X  beamline,  ISIS  
  • 2.
    Neutrons  at  ISIS   H-­‐  ion  accelerator   Proton  (H+  ion)   synchrotron   Second  target   station   First  target   station   Engin-­‐X   beamline   IMAT   beamline  
  • 3.
    The  ENGIN-­‐X  beamline   Incident beam South detector bank North detector bank
  • 4.
    Engin-­‐X  layout  Radial collimator (defines outgoingbeam size) Incident slits Strain direction (bank 1) Diffraction detector (bank 1) Diffraction detector (bank 2) Strain direction (bank 2)45º 45º Sample on translation / rotation table Strain direction (transmission detector) Time of flight 1.0 1.5 2.0 2.5 3.0 3.5 4.0 4.5 5.0 16 18 20 22 24 26 28 β-Sn powder Totalcrosssection(barns) Neutron wavelength (Å) Experiment Calculation Transmission detector
  • 5.
    Types  of  experiment:   trends  from  1999  to  2011   0% 10% 20% 30% 40% 50% 60% 70% 80% 90% 100% 1999   (PEARL) 2002 2005 2008 2011 Strain scanning: welds Strain scanning: other In-situ loading, room temperature In-situ loading, high temperature Other in-situ processes Physics of neutron measurement In-situ loading, cryo- temperature Shareofuserexperimenttime
  • 6.
    From  materials  to  processes   Magnetic fields Electrochemical reactions Mechanical deformation Heat treatment Phase transformations Welding Fuel cells Corrosion Shape memory alloys Material forming
  • 7.
    Stressrig  (up  to  100kN)   Cryostat   Down  to  -­‐200C   Optical   furnace   Up  to  1100C   Resistance  furnace   (small  samples,  up  to  ~1600C)   Sample  environments  for  in-­‐ situ  tests   Ceramic   heating   pads   (larger   samples)  
  • 8.
    In-­‐situ  heat  treatment   Linear  weld   Ni  superalloy   Circumferential   pipe  weld   Single  crystal  Ni   superalloy   Anna  Paradowska   demonstrates   proof  of  principle   James  Rolph  et  al.   Comptes  Rendus   Physique  13(3):307– 15.  (2012)   Bo  Chen  et  al.   Acta  Materialia   submitted  (2013)   See  γ’  misfit  as  function   of  temperature  
  • 9.
    In-­‐situ  heat  treatment     of  pipe  weld   2.865 2.87 2.875 2.88 2.885 2.89 2.895 2.9 0 200 400 600 800 Atomic  la*ce  spacing  /  Å   Temperature  /  °C Weld... Stress-­‐free reference... Hea8ng Hea8ng Cooling Cooling Bo  Chen,  Alexandros   Skouras,  Yiqiang  Wang,   Joe  Kelleher,  Shu  Yan   Zhang,  David  Smith,  Peter   Flewitt,  Martyn  Pavier  
  • 10.
    Cyclic  voltage  on  PZT   ferroelectric   100  MPa  applied   Zero  load     The  MANTID  platform   §  Data  reduction  and  visualisation   for  all  ISIS  instruments   §  Supports  event  mode  and   stroboscopic  data     David  Hall,  2013                    Loading  direction                  Transverse  direction     500  V  /  mm   AC  electric   field     Cyclic  electric  field   causes  straining  of   poled  PZT,  but   applied  load   depoles  the  PZT     Plots  show  difference   between  +  and  –  half-­‐cycles     –   +  
  • 11.
  • 12.
  • 13.
    Practical  considerations   • Sample  environment   –  Sufficiently  non-­‐interacting  with  neutron  beam   –  ‘Contains’  the  process  for  steady-­‐state,  safety   • Timing  for  dynamic  effects   –  Synchronise  clocks  or  use  trigger  pulses   –  Get  event  mode  acquisition  to  collect  other  data   • Can  we  record  more  than  just  the  neutron   data?  
  • 14.
    Supplementary  analytical   methods   Things  that  might  change  in  a   process   •  Mechanical  deformation,   stress  and  strain   •  Material  ‘damage’   •  Phase  changes   •  Diffusion   •  Temperature   Methods  that  might  reveal   these  changes   •  Image  correlation   •  Acoustic  emission   •  Thermoelastography   •  Dilatometry   •  Calorimetry   •  Ultrasonic  and  magnetic   methods   •  Sometimes  possible  to  measure  these  ‘for   free’  with  existing  sensors  
  • 15.
    Full-­‐spectrum  imaging   • Neutron  detectors  not  intrinsically  sensitive   to  wavelength,  but  to  time  of  detection   –  …hence  velocity,  hence  wavelength   • Each  pixel  of  a  2D  detector  can  record  a  full   wavelength  spectrum   • We  can  thus  see  both  spatial  and  temporal   variation  in  several  physical  parameters  
  • 16.
    Time-­‐of-­‐Klight  neutron  imaging   for  in-­‐situ  studies   Bragg  edges  show   crystal  structure  –   how  those  atoms  are   arranged   Resonance  peaks   show  which  atoms/ isotopes  present   Wavelength   Detected   intensity   Height  →   Texture   Height  →   Concentration   Width  →  Temperature   Position  →  Strain  
  • 17.
    Steven  Peetermans  &  Joe   Kelleher  (2013)   17 Transmission  spectrum  from   single  crystal   Σabs+Σinc+Σinel,coh Σel,coh Position = Orientation and strain Width = Mosaicity
  • 18.
    Conclusion:  Some  future   directions?   • Broader  array  of  sensing  and  actuation  on   beamlines   –   Users  won’t  need  to  bring  their  own   • Flexible  data  chopping  with  event  mode   –  Especially  cyclic  or  highly  dynamic  processes   • Sensor  /  actuator  bus  for  real  time   measurement  and  control  (e.g.  CANBUS  for   vehicles)