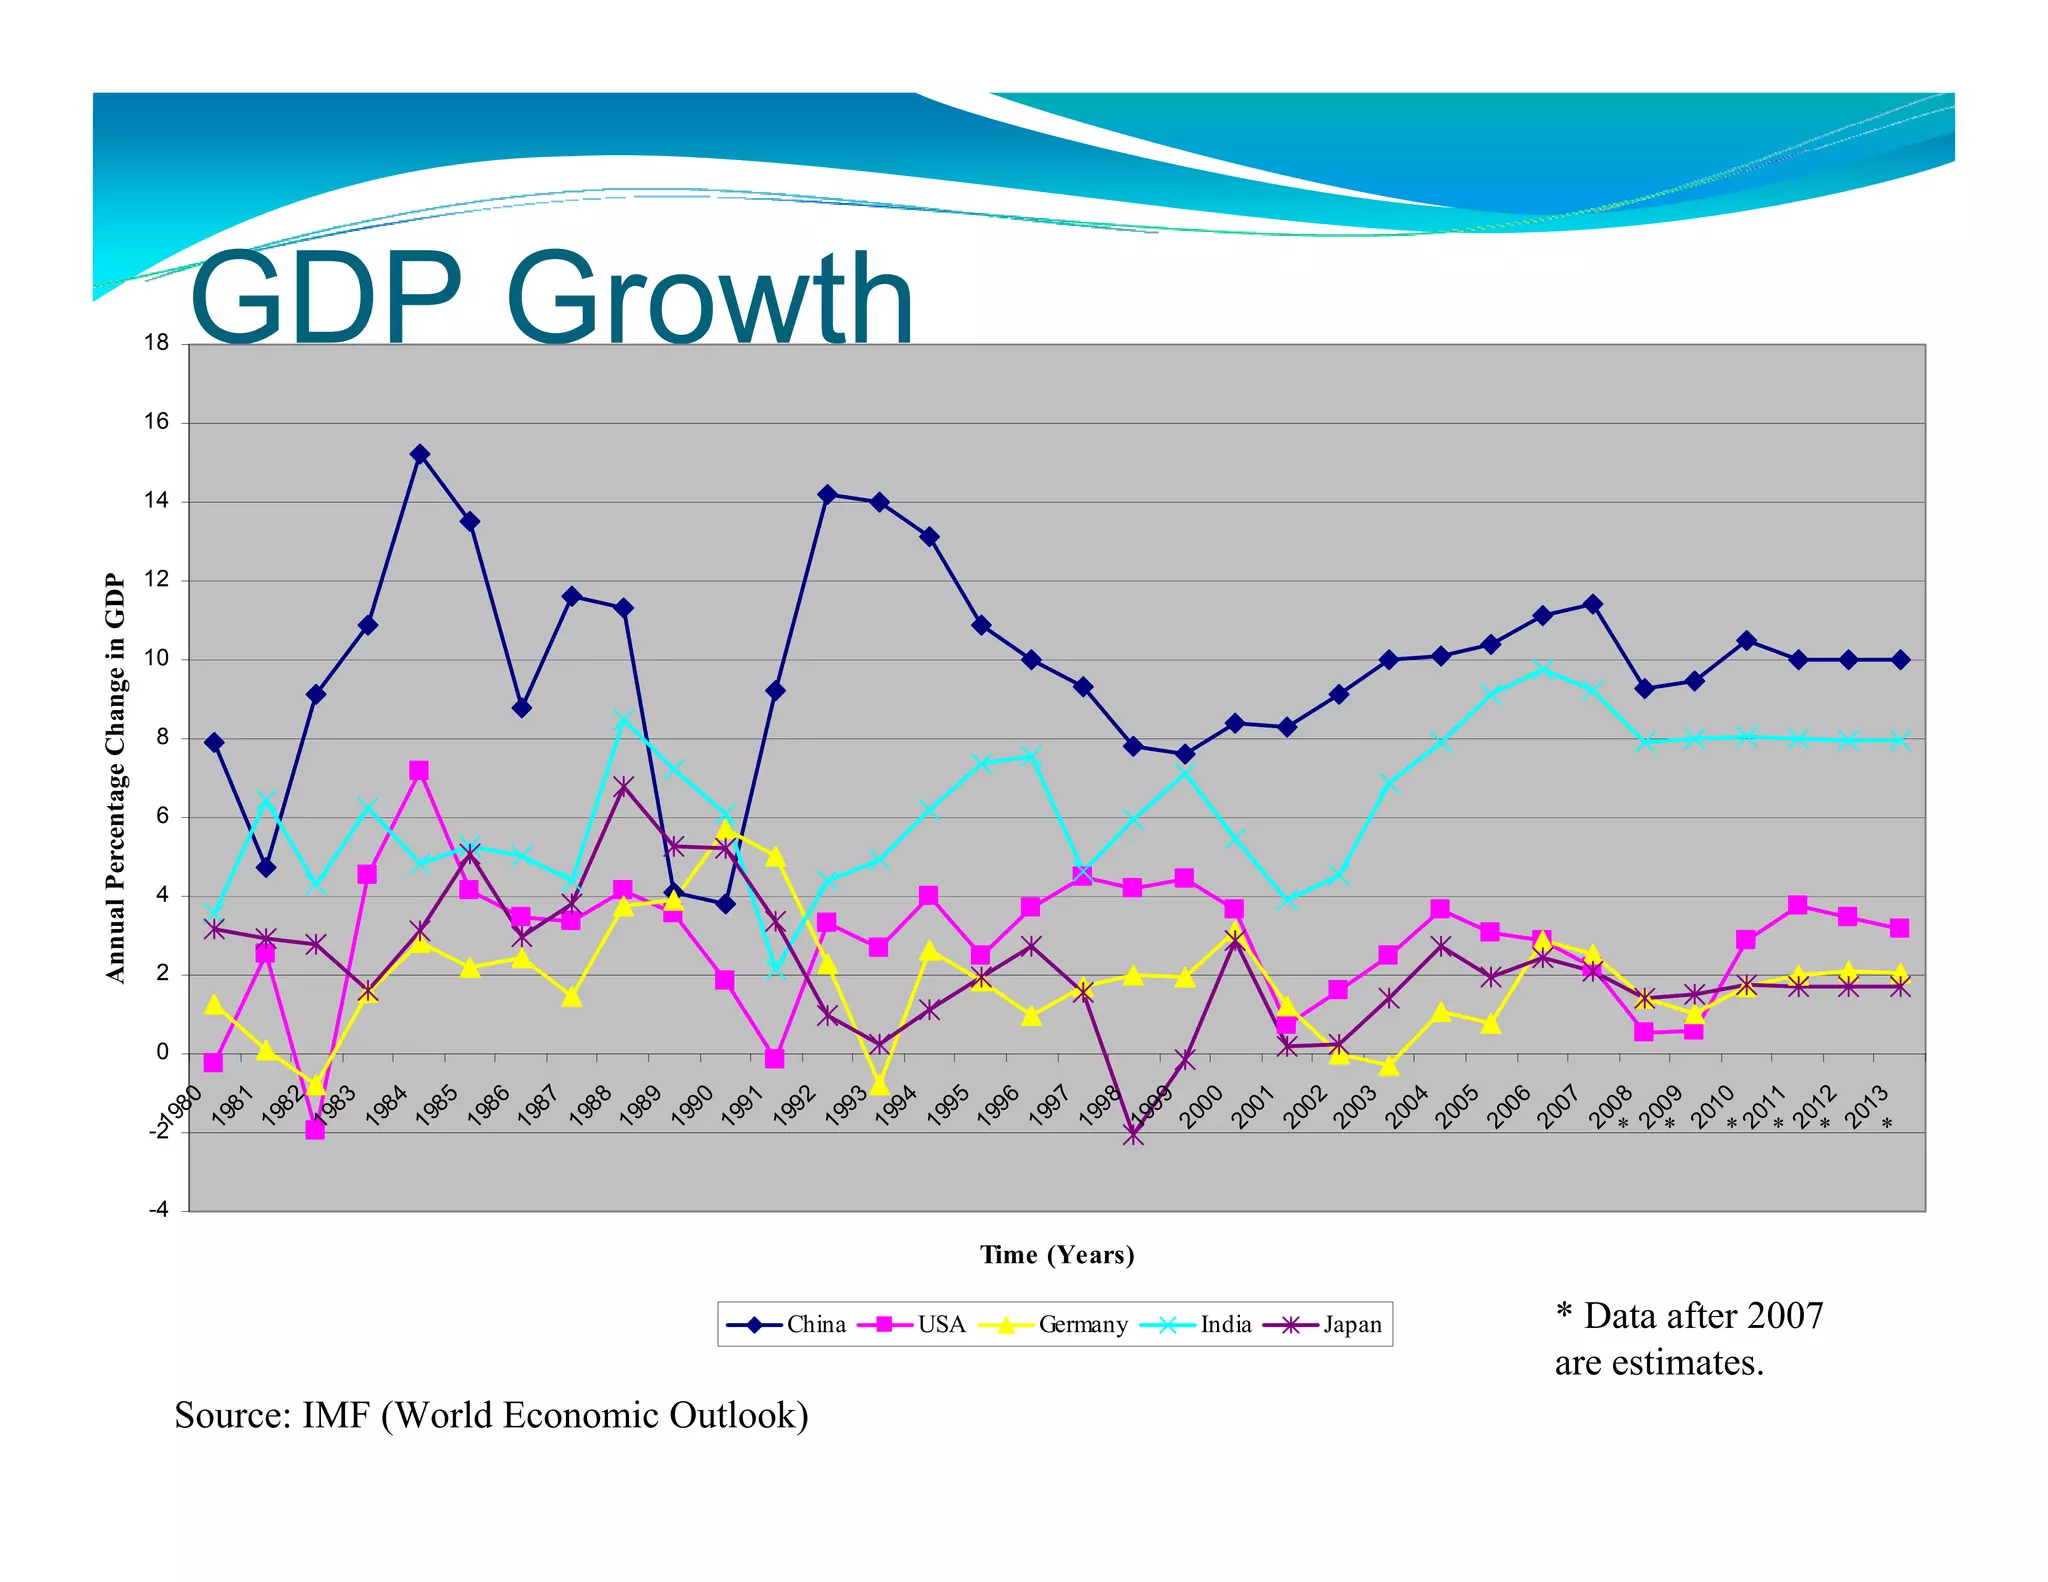
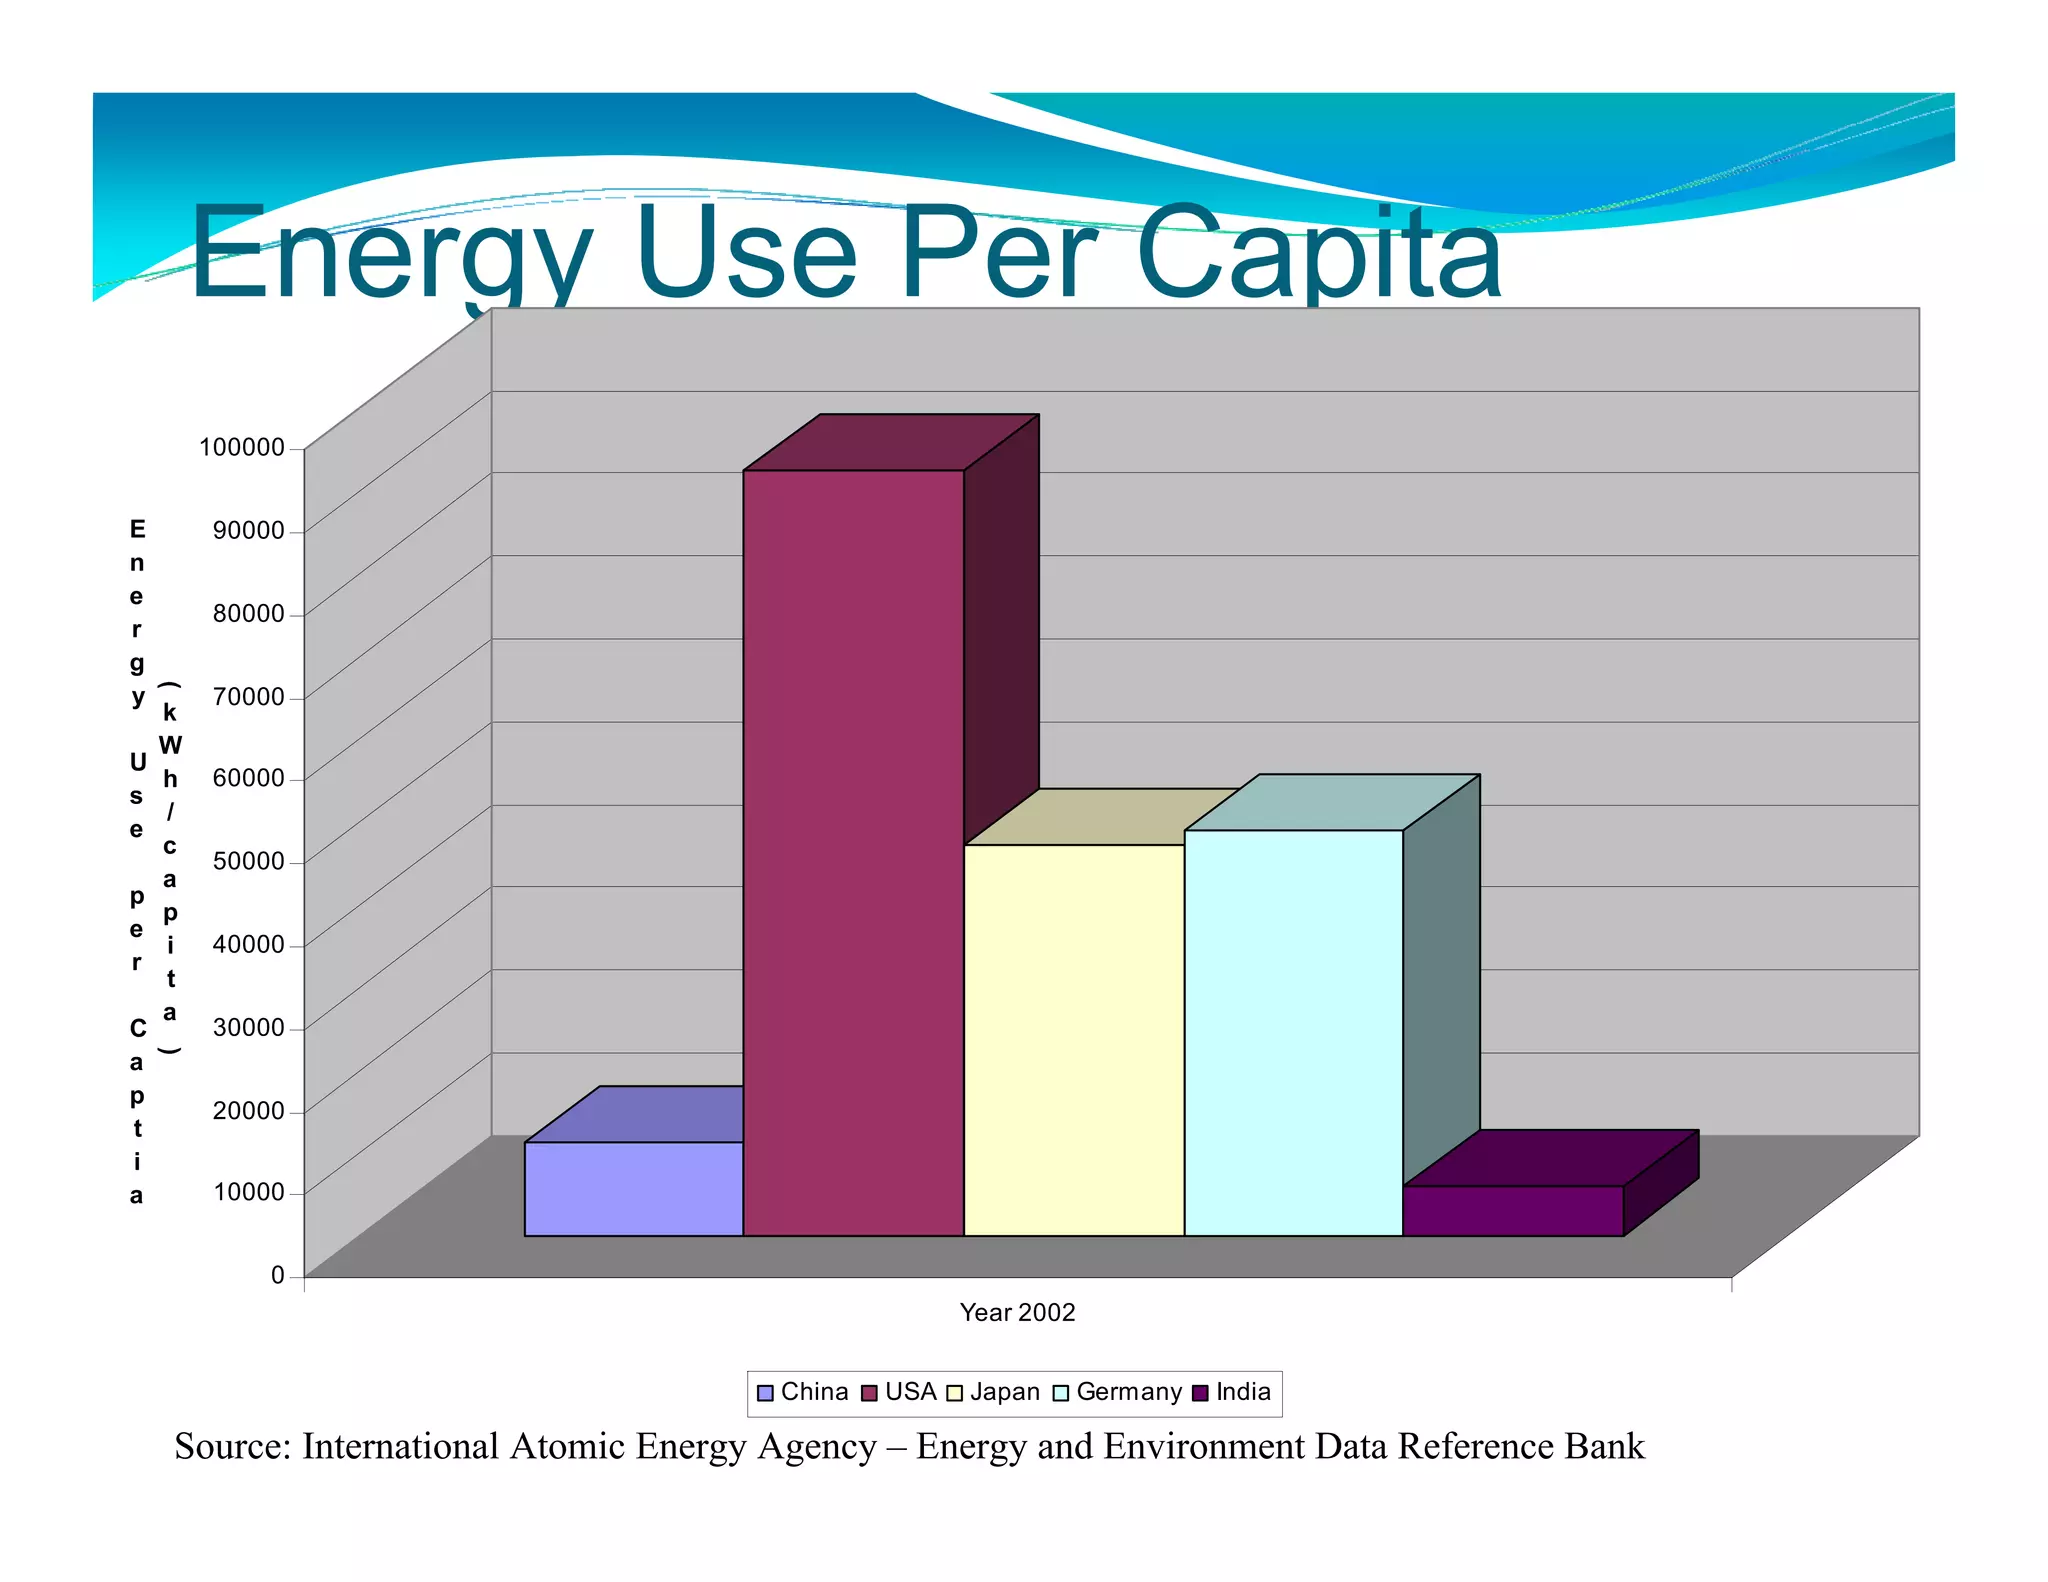
SlideShare a Scribd company logo
Peninsula Hotel
Beverly Hills, California
     November 3, 2008
Presentation by
                Robert H. Edelstein
University of California at Berkeley
A Quagmire of Long-Run and Short-Run
               Issues
Fundamental International
Economic Drivers
• Competition – The World is Flat and Crowded
  (Friedman)
• Globalization and Economic Integration: A Two-edged
  Sword (Stiglitz)
• Capital Market Integration and Securitization – The
  Limits are Imagination
• World Melting Pot of Socio-Political Ideology,
  Resource Environmental Competitiveness, Technology
  and Innovations
• Enhanced Volatility and Responsiveness – Integrated,
  Compacted World
Long View of Fundamental Economic
& Financial Determinants: Summary
    • International Growth Locomotives: China, India &
      United States
    • Future Growth Determinants: Frontier Technologies,
      Globalization, Demographics, Environmental
      Degradation and Energy Resources
Annual Percentage Change in GDP


                                                                          -4
                                                                               -2
                                                                                       0
                                                                                           2
                                                                                                4
                                                                                                      6
                                                                                                            8
                                                                                                                  10
                                                                                                                        12
                                                                                                                             14
                                                                                                                                  16
                                                                                                                                        18
                                                                                19
                                                                                  80
                                                                                19
                                                                                  81
                                                                                19
                                                                                  82
                                                                                19
                                                                                  83
                                                                                19
                                                                                  84
                                                                                19
                                                                                  85
                                                                                19
                                                                                  86
                                                                                19
                                                                                  87
                                                                                19
                                                                                  88
                                                                                19
                                                                                  89
                                                                                19
                                                                                  90
                                                                                19
                                                                                  91
                                                                                19


Source: IMF (World Economic Outlook)
                                                                                  92


                                                China
                                                                                19
                                                                                  93
                                                                                19
                                                                                  94
                                                                                                                                       GDP Growth


                                                                                19
                                                                                  95


                                                USA
                                                                                19
                                                                                  96
                                                                                19
                                                                                  97
                                                                                19
                                                                                  98


                                                Germany
                                                           Time (Years)
                                                                                19
                                                                                  99
                                                                                20
                                                                                  00


                                                India
                                                                                20
                                                                                  01
                                                                                20
                                                                                  02
                                                                                20
                                                                                  03
                                                Japan

                                                                                20
                                                                                  04
                                                                                20
                                                                                  05
                                                                                20
                                                                                  06
                                                                                20
                                                                                  07
                                                                                20
                                                                               *


                                                                                  08
                                                                                20
                                                                               *


                                                                                  09
                                                                                20
                                                                                  10
                                                                               *


                                       are estimates.


                                                                                20
                                                                                  11
                                                                               *


                                                                                20
                                       * Data after 2007
                                                                               *


                                                                                  12
                                                                                20
                                                                                  13
                                                                               *
Energy Use Per Capita
        100000


E        90000
n
e
         80000
r
g
    (


y        70000
    k
    W
U
    h    60000
s
    /
e
    c
         50000
    a
p
    p
e
    i    40000
r
    t
    a
C        30000
    )


a
p
         20000
t
i
a        10000


             0
                                                     Year 2002


                                       China   USA   Japan       Germany   India

    Source: International Atomic Energy Agency – Energy and Environment Data Reference Bank
U.S. Economy and the Deadly
“D’s”
 Deluxe Living
 Dis-saving
 Debt – private and Public
 Deficits – Trade, Governments and Households
 De-Regulation
 Degradation – Environment, etc.
Total Credit Market Debt Held by Rest of World as
 Share of Total US Credit Market Debt
 Outstanding; 1945-2007


Source: Flow of Funds;
Table L 1
Foreign Holdings of US Securities as Share of Total
Amount Outstanding
        Source: US Treasury TIC data; Federal Reserve Flow of Funds
Share of Global Reserves


                                              2007


Source: BIS, IMF
Share of Chinese Reserves in
                                       Dollar Denominated
                                       Securities
      $, Bill


                                                                      73%


                                         56%


Source: Peoples Bank of China, US Treasury, Estimates by Authors
Official Institutional Share of
            Holdings by Foreigners


Source: US Treasury
Capital Markets and M&A Overview
Privatization Trends – 2005/2006


         Drivers for Buyers
•   Abundant supply of institutional and opportunistic capital
•   Strong financing markets and attractive interest rates
•   Reasonable return expectations
•   Improving fundamentals for many asset types
•   Arbitrage between public and private markets / Ability to line-up
    sales of specific assets / portfolios
    Additionally, many Public Companies played a role in
    Privatizations through institutional / jv model:
•   Boards acted strategically and empowered by strong currencies and
    availability of low-cost debt and JV equity
•   Public markets were much more receptive to strategic transactions
    than in the past
Capital Markets and M&A Overview
Privatization Trends – 2005/2006
    Drivers for Sellers
 Motivated seller base influenced by attractive valuations
  and purchase price premiums / multiples
     Valuations / proposals above most NAV estimates
 Aggressive suitors and increased review of strategic
  alternatives
 Constraints of public market
     Short-term accretion attention
     Leverage constraints
     Analyst and Investor perceptions
 Active Boards
 More attention to procedures, responses and corporate
  governance
 Roles for management in private forum, including growth of
  platform
 Increased scrutiny and costs of being a public company
Capital Markets and M&A Overview
                                        2007 Mid-Summer Correction - Context for the Current Situation

Since the 2007 mid-summer correction, the capital markets have undergone a significant re-pricing of risk
    Risk premiums on high yield bonds have ballooned to levels well above their 12-month average of 455 bps and
    all-time low of 262 bps seen 6/1/2007 (1)
    In contrast, high yield default rates remain at an historic low of 0.9% - a record gap between risk premiums and
    defaults (2)
Since July, financial firms have announced $181 billion of write-downs linked to sub-prime exposure (3)
    Major firms have raised $72.3 billion of new capital to shore up balance sheets (4)
In 2007, an estimated $326 billion of residential mortgage payments reset; $412 billion are scheduled to reset during
2008 (5)
(1) Source: BAS High Yield Bond Index.
(2) High yield default rates of 0.9% as of 12/2007. Record gap between risk premiums and default rates as per Moody’s economist John Lonski (Source: Wall Street Journal).
(3) Source: Bloomberg as of 2/29/08.
(4) Source: Bloomberg as of 1/15/2008 and company reports.
(5) Source: Deutsche Bank, Loan Performance and Rosen Consulting Group. Includes rate adjustments and IO expirations.
Capital Markets and M&A Overview
   CMBS Market Overview
Real Estate Company
Valuations


   Sources: FactSet, Company reports and Wall Street Research as of 2/1/08.
What Are The Follow-up “D’s”
for Now?
 De-leveraging – Farewell Cheap Debt
 Distrust and Dismay
 Deflation – Asset Market “Booms” Farewell
 Disarray
 Defaults
Capital Markets Overview
Market Current Situation & Outlook

The M&A market has slowed significantly since its late July 2007 peak
as a result of the credit market “backup”
The current M&A market slowdown is marked by the following
dynamics:
    Large, highly levered financings not available
    Short-term asset flipping is no longer a viable strategy
    Seller’s pricing expectations have been slow to adjust despite market
   expectation of
     cap rate expansion
Going forward, key capital market themes in M&A will include:
   Opportunistic investors, especially sovereign wealth funds, exerting pressure
   on distressed situations
   Likely contraction of valuation multiples / widening of cap rates
   Credit re-pricing and overall leverage reductions
   Increase in joint ventures as institutional real estate capital remains available
   Capital structures increasingly funded by opportunistic players such as hedge
   funds, commitments from multiple institutions, or SWF
House Prices Inflate to Create an Historic Bubble
Relative to underlying household income, the median house price appreciated far to fast.
About two-thirds of the bubble has already been deflated.
Our expectation is for the housing market to overshoot the historic price-to-income ratio.


                    Median House Price/Avg. HH Income
                     February 2008 MML (Recession)
             2.60

                                                                                         2005Q3

             2.40
                                                                                                  Foreclosures
                                                       Wells Bubble Policy Instituted,            break-out to
                                                       First in the Nation, 2003Q4                the upside.
             2.20
                                                          Start of the housing bubble,
                                                          2001Q4
             2.00
     Ratio


             1.80


             1.60
                                                                                                   Correction
                                                                                                   will
                                                                                                   overshoot.
             1.40


             1.20


             1.00
             19 8
             19 9
               70
             19 1
               72
             19 3
             19 4
               75
             19 6
             19 7
             19 8
               79
             19 0
             19 1
             19 2
               83
             19 4
               85
             19 6
               87
             19 8
               89
             19 0
               91
             19 2
               93
             19 4
               95
             19 6
               97
             19 8
               99
             20 0
               01
             20 2
               03
             20 4
               05
             20 6
               07
             20 8
               09
             20 0
               11
               12
               6
               6

               7

               7
               7

               7
               7
               7

               8
               8
               8

               8

               8

               8

               9

               9

               9

               9

               9

               0

               0

               0

               0

               0

               1
             19


             19

             19


             19


             19


             19

             19

             19

             19

             19

             19

             19

             19

             20

             20

             20

             20

             20

             20

             20
Recent Events of Concern

• What Happened to Bear Stearns?
• Why did IndyMac Fail?
• How do FNMA and FHLMC fit into the
 Sub-Prime Crisis? AIG?
• The BIG five: G-S, M-S, Lehman, M-L, and B-S
Policy Action!?

• Why has the Fed acted as the Ultimate
  Source of Liquidity?
• Can the U.S. let a Large Institution Fail?
• What needs to be done in the Short-Run and
  the Long-Run?
ABX-HE Index Prices Have Deteriorated
  This chart shows the ABX index for AAA bonds backed by home equity loans issued
in February 2007 (as of April 22).
 Even AAA bonds have lost about 43% their value in 14 months.
Summary

  The financial markets are still under stress. Losses from
mortgage derivatives are creating counter-party risk, and they
have prevented the normal flow of transactions and credit as a
result.
  The result is that risk spreads are elevated.
  The poor economic outlook has also boosted the risk spread in
the corporate sector foreshadowing increased corporate
bankruptcies, loan and bond defaults.
  The Fed and the Treasury are still engaged!?
Elements for the Short-term and Long-
term Resolution of the Subprime and
Other Financial Crises
 Devise Programs to Stabilize the Housing Market and Housing
 Finance System
 Engender Housing and General Financial Market Viability
 Implement Policies that Avoid Recurrence and Moral Hazards
 Prepare for Potential Wider Domestic Economic Implication of
 the Sub-prime Crisis
 Recognize and Plan for Potential Global Economic and
 Financial System Interactions

                                                               29
Overview Subprime Issues
 Direct Effects
     Delinquencies
     Foreclosures
     home prices
 Lender Industry and Secondary Market Behavior
     New Profit Model
     Underwriting Standards
     Fee Structures
     Accessibility of Secondary Market
 Risk Contagion Effects
     New Construction
     Real Estate Services
     Equity Loans
     Financial Institutions
 Global Effects
     Risk Spread “Adjustments”
     U.S. Consumption and International Trade, World-wide Stock Market/Bond Market


                                                                                     30
Why Were We So
     Susceptible to the
     Subprime Crisis?
•   Diminution of Underwriting Quality
•   Inexperience of Owner-Borrowers
•   Financial “Wizardry”
•   Aggressive, Risk-Taking Investors


                                         31
How Exposed Are We?
 Total US housing stock is 128 million units
 Annual sales since 2000 represent between 4-6% of
 stock
 States with high levels of price declines account for a
 large share of housing stock; and larger share of
 mortgages outstanding
 Nationwide, the ability to buy a home has not changed
 dramatically, but regional variations show large areas
 of vulnerability
 Subprime loans are 12 percent of all outstanding
 mortgages
                                                       32
Per Capita Income and Home Price Indices
Compared, Far West, 1975-2008
 1600
 1400
 1200
 1000
  800
  600
  400
  200
    0
    75
         77
              79
                   81
                        83
                              85
                               87
                               89
                               91
                               93
                               95
                               97
                               99
                               01
                               03
                               05
                               07
   19
        19
             19
                  19
                       19


                            19
                            19
                            19
                            19
                            19
                            19
                            19
                            20
                            20
                            20
                            20
                            19


                            OFHEO index    Per Capita Income Index
Source: Indices created by authors using Office of Federal Housing Enterprise
Oversight index (adjusted to 1975 base); US Bureau of Economic Analysis data.   33
Understanding Variation in Exposure and
Experience Can Help Shape Policy
 Wide variation within the US in housing markets
 (median 2007 home value ranges from $88,000 in
 Mississippi to $536,000 in California)
 Wide variation in exposure to subprime loans (low of
 6% in South Dakota, high of 20% in Nevada)
 Share of subprimes in foreclosure range from 3% in
 Utah to 18% in Michigan
 Factors, such as age, household size, ownership rates,
 and government regulation, can influence the level
 and outcome of exposure.
                                                          34
Local and State Revenue
Impacts
 Loss of Capital Gains Tax
 Loss of Property Tax Base
 Other Transactions Based Fees and Taxes
Some Troubling Conclusions
 Regional differences are significant?
 Homeownership at what social costs?
 Credit tightening needs to be selective, especially where
 economies are weak?


                                                             36
Policy Objectives
 Stability in Housing (and other asset) Markets
   Retaining high home ownership rates
   Arresting drastic value slide
   Maintaining ownership incentives for households with
   negative equity
   Normalizing new and existing market activity
 Liquidity in Mortgage (and other asset) Markets
   Stabilizing financial markets
   Efficient securitization
   Reorganizing Fannie and Freddie to be viable entities (at
   low social costs)
                                                               37
Whose Problem?
•   Homeowners/Borrowers
•   Homebuyers
•   Home-sellers
•   Builders
•   Lenders
•   Securitizers
•   Investors
•   Regulators
•   Taxpayers
•   Government sector
•   International Components

                                 38
Policy Evaluation
Criteria/Benchmarks
 Moral Hazard Issue or Chance of Recurrence
 Fairness and Equity
 Bang for the Buck (Efficiency)
 “Good” vs. “Bad” Subprime Loans
 Distributional (Income and Geographic) Impacts
 Linkages of Housing finance System with Broader
 Financial System and Economy

                                                   39
The Secondary Market
Enigma
1.   FNMA and FHLMC
2.   FDIC and Banks
3.   IB and Securitization
4.   Monoline Insurers
5.   CDS


                             40
Real Sector Constraints for
Policy
 Economic Environment
 Job Creation
 Household Formation
 Wage Growth Prospects


                              41
Policy Perspective
 No Single Policy is the Silver Bullet
 Complex Benefits-Costs Analyses Require Multi-faceted
 Solutions
 Regional-State Differences Require Regionally
 Differentiated Approaches
 Reinvigorate Securitization Process
 Triage “Bad” Loans


                                                         42
Targeting Policy
 Economic Slow-downs
 Credit Tightening
 Loss of Confidence in System


                                43
What Should We Focus on
Next?
 Credit Crunch
 Synchronized World Recession
 China Bubbles Burst
 Dollar Crash (Inflation Risk)
 Geopolitical Risks
Flux = Opportunity
Positive Demographics – Echo – Baby Boom; 72 Million
People in Next 10 Years
Expensive Energy Scenarios – Changing Urban Form and
Urban Density
Financing Real Estate – What’s Next?
U.S. May Represent Best Real Estate Investment
“Opportunistic Plays” During Next Five Years!?
Office – Not Overbuilt, Except O.C., Seattle
Residential – Rebound in Values Over the Next Five
Years; MF vs. SF
Retail – Well-Situated (LxLxL)
Hotels – Dangerous Sector?
Industrial/Warehouse – If Globalization Continues?!
Securitized Real Estate Markets -- ?
Land Play – Have a Hunch---Buy a Bunch will Not
Work!? -- Not for the Meek!

More Related Content

Viewers also liked

RPH Pendidikan Sivik
RPH Pendidikan SivikRPH Pendidikan Sivik
RPH Pendidikan Sivikizyan bakri
 
Morfologi_pembentukan kata
Morfologi_pembentukan kataMorfologi_pembentukan kata
Morfologi_pembentukan kataizyan bakri
 
Synergy Consulting Presentation Eng
Synergy Consulting Presentation EngSynergy Consulting Presentation Eng
Synergy Consulting Presentation Eng
guest83287c
 
Analisis petikan cerpen
Analisis petikan cerpenAnalisis petikan cerpen
Analisis petikan cerpenizyan bakri
 

Viewers also liked (6)

RPH Pendidikan Sivik
RPH Pendidikan SivikRPH Pendidikan Sivik
RPH Pendidikan Sivik
 
Morfologi_pembentukan kata
Morfologi_pembentukan kataMorfologi_pembentukan kata
Morfologi_pembentukan kata
 
Semantik
SemantikSemantik
Semantik
 
3116 proforma
3116 proforma3116 proforma
3116 proforma
 
Synergy Consulting Presentation Eng
Synergy Consulting Presentation EngSynergy Consulting Presentation Eng
Synergy Consulting Presentation Eng
 
Analisis petikan cerpen
Analisis petikan cerpenAnalisis petikan cerpen
Analisis petikan cerpen
 

Similar to Jnf Commercial Real Estate And Capital Group Economy 2008 Lecture

Personalised Medicine In R & D
Personalised Medicine In R & DPersonalised Medicine In R & D
Personalised Medicine In R & D
harsukh
 
Redefining Disease Personalised Medicine2
Redefining Disease Personalised Medicine2Redefining Disease Personalised Medicine2
Redefining Disease Personalised Medicine2
harsukh
 
Financing For Development
Financing For DevelopmentFinancing For Development
Financing For Development
Commonwealth Secretariat
 
AHNS Human Papillomavirus and Head and Neck Cancer
AHNS Human Papillomavirus and Head and Neck CancerAHNS Human Papillomavirus and Head and Neck Cancer
AHNS Human Papillomavirus and Head and Neck Cancer
American Head and Neck Society
 
Does CO2 cause Global Warming?
Does CO2 cause Global Warming?Does CO2 cause Global Warming?
Does CO2 cause Global Warming?
Gaetan Lion
 
Network effect
Network effectNetwork effect
Network effect
Toshiya Jitsuzumi
 
Overview Of Us Mortgage Markets
Overview Of Us Mortgage MarketsOverview Of Us Mortgage Markets
Overview Of Us Mortgage Markets
windiee Green
 
Indonesian Historical Data
Indonesian Historical DataIndonesian Historical Data
Indonesian Historical Data
freychasez
 
Macroeconomic Management in Pakistan
Macroeconomic Management in PakistanMacroeconomic Management in Pakistan
Macroeconomic Management in Pakistan
Sustainable Development Policy Institute
 
1-15 Test 2 Bundle 1 Review
1-15 Test 2 Bundle 1 Review1-15 Test 2 Bundle 1 Review
1-15 Test 2 Bundle 1 Review
nechamkin
 
Rural-Urban Linkages for Growth, Employment and Poverty Reduction
Rural-Urban Linkages for Growth, Employment and Poverty ReductionRural-Urban Linkages for Growth, Employment and Poverty Reduction
Rural-Urban Linkages for Growth, Employment and Poverty Reduction
Joachim von Braun
 
Clean Cities GREET Life cycle NG
Clean Cities GREET Life cycle NGClean Cities GREET Life cycle NG
Clean Cities GREET Life cycle NG
ETCleanFuels
 
Peking presentation
Peking presentationPeking presentation
Academy Pt I W Guard
Academy Pt I W  GuardAcademy Pt I W  Guard
Academy Pt I W Guard
guest7cc3e6
 
globalisation-ppt
 globalisation-ppt globalisation-ppt
globalisation-ppt
pavitarsidhu
 
JOrson_Prague_June11
JOrson_Prague_June11JOrson_Prague_June11
JOrson_Prague_June11
TacTac-RAS
 
Samuel hbv lt ds 1- 2013
Samuel   hbv lt ds 1- 2013Samuel   hbv lt ds 1- 2013
Samuel hbv lt ds 1- 2013
odeckmyn
 
Samuel virus lt du 2012
Samuel virus  lt du 2012Samuel virus  lt du 2012
Samuel virus lt du 2012
odeckmyn
 
The Population Trends that are Reshaping Michigan
The Population Trends that are Reshaping MichiganThe Population Trends that are Reshaping Michigan
The Population Trends that are Reshaping Michigan
University of Michigan, Government Relations
 
KW Office Locations by State Map - July 2010
KW Office Locations by State Map - July 2010KW Office Locations by State Map - July 2010
KW Office Locations by State Map - July 2010
Keller Williams Careers
 

Similar to Jnf Commercial Real Estate And Capital Group Economy 2008 Lecture (20)

Personalised Medicine In R & D
Personalised Medicine In R & DPersonalised Medicine In R & D
Personalised Medicine In R & D
 
Redefining Disease Personalised Medicine2
Redefining Disease Personalised Medicine2Redefining Disease Personalised Medicine2
Redefining Disease Personalised Medicine2
 
Financing For Development
Financing For DevelopmentFinancing For Development
Financing For Development
 
AHNS Human Papillomavirus and Head and Neck Cancer
AHNS Human Papillomavirus and Head and Neck CancerAHNS Human Papillomavirus and Head and Neck Cancer
AHNS Human Papillomavirus and Head and Neck Cancer
 
Does CO2 cause Global Warming?
Does CO2 cause Global Warming?Does CO2 cause Global Warming?
Does CO2 cause Global Warming?
 
Network effect
Network effectNetwork effect
Network effect
 
Overview Of Us Mortgage Markets
Overview Of Us Mortgage MarketsOverview Of Us Mortgage Markets
Overview Of Us Mortgage Markets
 
Indonesian Historical Data
Indonesian Historical DataIndonesian Historical Data
Indonesian Historical Data
 
Macroeconomic Management in Pakistan
Macroeconomic Management in PakistanMacroeconomic Management in Pakistan
Macroeconomic Management in Pakistan
 
1-15 Test 2 Bundle 1 Review
1-15 Test 2 Bundle 1 Review1-15 Test 2 Bundle 1 Review
1-15 Test 2 Bundle 1 Review
 
Rural-Urban Linkages for Growth, Employment and Poverty Reduction
Rural-Urban Linkages for Growth, Employment and Poverty ReductionRural-Urban Linkages for Growth, Employment and Poverty Reduction
Rural-Urban Linkages for Growth, Employment and Poverty Reduction
 
Clean Cities GREET Life cycle NG
Clean Cities GREET Life cycle NGClean Cities GREET Life cycle NG
Clean Cities GREET Life cycle NG
 
Peking presentation
Peking presentationPeking presentation
Peking presentation
 
Academy Pt I W Guard
Academy Pt I W  GuardAcademy Pt I W  Guard
Academy Pt I W Guard
 
globalisation-ppt
 globalisation-ppt globalisation-ppt
globalisation-ppt
 
JOrson_Prague_June11
JOrson_Prague_June11JOrson_Prague_June11
JOrson_Prague_June11
 
Samuel hbv lt ds 1- 2013
Samuel   hbv lt ds 1- 2013Samuel   hbv lt ds 1- 2013
Samuel hbv lt ds 1- 2013
 
Samuel virus lt du 2012
Samuel virus  lt du 2012Samuel virus  lt du 2012
Samuel virus lt du 2012
 
The Population Trends that are Reshaping Michigan
The Population Trends that are Reshaping MichiganThe Population Trends that are Reshaping Michigan
The Population Trends that are Reshaping Michigan
 
KW Office Locations by State Map - July 2010
KW Office Locations by State Map - July 2010KW Office Locations by State Map - July 2010
KW Office Locations by State Map - July 2010
 

Recently uploaded

Income Tax exemption for Start up : Section 80 IAC
Income Tax  exemption for Start up : Section 80 IACIncome Tax  exemption for Start up : Section 80 IAC
Income Tax exemption for Start up : Section 80 IAC
CA Dr. Prithvi Ranjan Parhi
 
Creative Web Design Company in Singapore
Creative Web Design Company in SingaporeCreative Web Design Company in Singapore
Creative Web Design Company in Singapore
techboxsqauremedia
 
ModelingMarketingStrategiesMKS.CollumbiaUniversitypdf
ModelingMarketingStrategiesMKS.CollumbiaUniversitypdfModelingMarketingStrategiesMKS.CollumbiaUniversitypdf
ModelingMarketingStrategiesMKS.CollumbiaUniversitypdf
fisherameliaisabella
 
The Influence of Marketing Strategy and Market Competition on Business Perfor...
The Influence of Marketing Strategy and Market Competition on Business Perfor...The Influence of Marketing Strategy and Market Competition on Business Perfor...
The Influence of Marketing Strategy and Market Competition on Business Perfor...
Adam Smith
 
Call 8867766396 Satta Matka Dpboss Matka Guessing Satta batta Matka 420 Satta...
Call 8867766396 Satta Matka Dpboss Matka Guessing Satta batta Matka 420 Satta...Call 8867766396 Satta Matka Dpboss Matka Guessing Satta batta Matka 420 Satta...
Call 8867766396 Satta Matka Dpboss Matka Guessing Satta batta Matka 420 Satta...
bosssp10
 
How MJ Global Leads the Packaging Industry.pdf
How MJ Global Leads the Packaging Industry.pdfHow MJ Global Leads the Packaging Industry.pdf
How MJ Global Leads the Packaging Industry.pdf
MJ Global
 
Part 2 Deep Dive: Navigating the 2024 Slowdown
Part 2 Deep Dive: Navigating the 2024 SlowdownPart 2 Deep Dive: Navigating the 2024 Slowdown
Part 2 Deep Dive: Navigating the 2024 Slowdown
jeffkluth1
 
LA HUG - Video Testimonials with Chynna Morgan - June 2024
LA HUG - Video Testimonials with Chynna Morgan - June 2024LA HUG - Video Testimonials with Chynna Morgan - June 2024
LA HUG - Video Testimonials with Chynna Morgan - June 2024
Lital Barkan
 
Unveiling the Dynamic Personalities, Key Dates, and Horoscope Insights: Gemin...
Unveiling the Dynamic Personalities, Key Dates, and Horoscope Insights: Gemin...Unveiling the Dynamic Personalities, Key Dates, and Horoscope Insights: Gemin...
Unveiling the Dynamic Personalities, Key Dates, and Horoscope Insights: Gemin...
my Pandit
 
-- June 2024 is National Volunteer Month --
-- June 2024 is National Volunteer Month ---- June 2024 is National Volunteer Month --
-- June 2024 is National Volunteer Month --
NZSG
 
The 10 Most Influential Leaders Guiding Corporate Evolution, 2024.pdf
The 10 Most Influential Leaders Guiding Corporate Evolution, 2024.pdfThe 10 Most Influential Leaders Guiding Corporate Evolution, 2024.pdf
The 10 Most Influential Leaders Guiding Corporate Evolution, 2024.pdf
thesiliconleaders
 
Authentically Social Presented by Corey Perlman
Authentically Social Presented by Corey PerlmanAuthentically Social Presented by Corey Perlman
Authentically Social Presented by Corey Perlman
Corey Perlman, Social Media Speaker and Consultant
 
Organizational Change Leadership Agile Tour Geneve 2024
Organizational Change Leadership Agile Tour Geneve 2024Organizational Change Leadership Agile Tour Geneve 2024
Organizational Change Leadership Agile Tour Geneve 2024
Kirill Klimov
 
Understanding User Needs and Satisfying Them
Understanding User Needs and Satisfying ThemUnderstanding User Needs and Satisfying Them
Understanding User Needs and Satisfying Them
Aggregage
 
Training my puppy and implementation in this story
Training my puppy and implementation in this storyTraining my puppy and implementation in this story
Training my puppy and implementation in this story
WilliamRodrigues148
 
一比一原版新西兰奥塔哥大学毕业证(otago毕业证)如何办理
一比一原版新西兰奥塔哥大学毕业证(otago毕业证)如何办理一比一原版新西兰奥塔哥大学毕业证(otago毕业证)如何办理
一比一原版新西兰奥塔哥大学毕业证(otago毕业证)如何办理
taqyea
 
BeMetals Investor Presentation_June 1, 2024.pdf
BeMetals Investor Presentation_June 1, 2024.pdfBeMetals Investor Presentation_June 1, 2024.pdf
BeMetals Investor Presentation_June 1, 2024.pdf
DerekIwanaka1
 
Company Valuation webinar series - Tuesday, 4 June 2024
Company Valuation webinar series - Tuesday, 4 June 2024Company Valuation webinar series - Tuesday, 4 June 2024
Company Valuation webinar series - Tuesday, 4 June 2024
FelixPerez547899
 
Observation Lab PowerPoint Assignment for TEM 431
Observation Lab PowerPoint Assignment for TEM 431Observation Lab PowerPoint Assignment for TEM 431
Observation Lab PowerPoint Assignment for TEM 431
ecamare2
 
Taurus Zodiac Sign: Unveiling the Traits, Dates, and Horoscope Insights of th...
Taurus Zodiac Sign: Unveiling the Traits, Dates, and Horoscope Insights of th...Taurus Zodiac Sign: Unveiling the Traits, Dates, and Horoscope Insights of th...
Taurus Zodiac Sign: Unveiling the Traits, Dates, and Horoscope Insights of th...
my Pandit
 

Recently uploaded (20)

Income Tax exemption for Start up : Section 80 IAC
Income Tax  exemption for Start up : Section 80 IACIncome Tax  exemption for Start up : Section 80 IAC
Income Tax exemption for Start up : Section 80 IAC
 
Creative Web Design Company in Singapore
Creative Web Design Company in SingaporeCreative Web Design Company in Singapore
Creative Web Design Company in Singapore
 
ModelingMarketingStrategiesMKS.CollumbiaUniversitypdf
ModelingMarketingStrategiesMKS.CollumbiaUniversitypdfModelingMarketingStrategiesMKS.CollumbiaUniversitypdf
ModelingMarketingStrategiesMKS.CollumbiaUniversitypdf
 
The Influence of Marketing Strategy and Market Competition on Business Perfor...
The Influence of Marketing Strategy and Market Competition on Business Perfor...The Influence of Marketing Strategy and Market Competition on Business Perfor...
The Influence of Marketing Strategy and Market Competition on Business Perfor...
 
Call 8867766396 Satta Matka Dpboss Matka Guessing Satta batta Matka 420 Satta...
Call 8867766396 Satta Matka Dpboss Matka Guessing Satta batta Matka 420 Satta...Call 8867766396 Satta Matka Dpboss Matka Guessing Satta batta Matka 420 Satta...
Call 8867766396 Satta Matka Dpboss Matka Guessing Satta batta Matka 420 Satta...
 
How MJ Global Leads the Packaging Industry.pdf
How MJ Global Leads the Packaging Industry.pdfHow MJ Global Leads the Packaging Industry.pdf
How MJ Global Leads the Packaging Industry.pdf
 
Part 2 Deep Dive: Navigating the 2024 Slowdown
Part 2 Deep Dive: Navigating the 2024 SlowdownPart 2 Deep Dive: Navigating the 2024 Slowdown
Part 2 Deep Dive: Navigating the 2024 Slowdown
 
LA HUG - Video Testimonials with Chynna Morgan - June 2024
LA HUG - Video Testimonials with Chynna Morgan - June 2024LA HUG - Video Testimonials with Chynna Morgan - June 2024
LA HUG - Video Testimonials with Chynna Morgan - June 2024
 
Unveiling the Dynamic Personalities, Key Dates, and Horoscope Insights: Gemin...
Unveiling the Dynamic Personalities, Key Dates, and Horoscope Insights: Gemin...Unveiling the Dynamic Personalities, Key Dates, and Horoscope Insights: Gemin...
Unveiling the Dynamic Personalities, Key Dates, and Horoscope Insights: Gemin...
 
-- June 2024 is National Volunteer Month --
-- June 2024 is National Volunteer Month ---- June 2024 is National Volunteer Month --
-- June 2024 is National Volunteer Month --
 
The 10 Most Influential Leaders Guiding Corporate Evolution, 2024.pdf
The 10 Most Influential Leaders Guiding Corporate Evolution, 2024.pdfThe 10 Most Influential Leaders Guiding Corporate Evolution, 2024.pdf
The 10 Most Influential Leaders Guiding Corporate Evolution, 2024.pdf
 
Authentically Social Presented by Corey Perlman
Authentically Social Presented by Corey PerlmanAuthentically Social Presented by Corey Perlman
Authentically Social Presented by Corey Perlman
 
Organizational Change Leadership Agile Tour Geneve 2024
Organizational Change Leadership Agile Tour Geneve 2024Organizational Change Leadership Agile Tour Geneve 2024
Organizational Change Leadership Agile Tour Geneve 2024
 
Understanding User Needs and Satisfying Them
Understanding User Needs and Satisfying ThemUnderstanding User Needs and Satisfying Them
Understanding User Needs and Satisfying Them
 
Training my puppy and implementation in this story
Training my puppy and implementation in this storyTraining my puppy and implementation in this story
Training my puppy and implementation in this story
 
一比一原版新西兰奥塔哥大学毕业证(otago毕业证)如何办理
一比一原版新西兰奥塔哥大学毕业证(otago毕业证)如何办理一比一原版新西兰奥塔哥大学毕业证(otago毕业证)如何办理
一比一原版新西兰奥塔哥大学毕业证(otago毕业证)如何办理
 
BeMetals Investor Presentation_June 1, 2024.pdf
BeMetals Investor Presentation_June 1, 2024.pdfBeMetals Investor Presentation_June 1, 2024.pdf
BeMetals Investor Presentation_June 1, 2024.pdf
 
Company Valuation webinar series - Tuesday, 4 June 2024
Company Valuation webinar series - Tuesday, 4 June 2024Company Valuation webinar series - Tuesday, 4 June 2024
Company Valuation webinar series - Tuesday, 4 June 2024
 
Observation Lab PowerPoint Assignment for TEM 431
Observation Lab PowerPoint Assignment for TEM 431Observation Lab PowerPoint Assignment for TEM 431
Observation Lab PowerPoint Assignment for TEM 431
 
Taurus Zodiac Sign: Unveiling the Traits, Dates, and Horoscope Insights of th...
Taurus Zodiac Sign: Unveiling the Traits, Dates, and Horoscope Insights of th...Taurus Zodiac Sign: Unveiling the Traits, Dates, and Horoscope Insights of th...
Taurus Zodiac Sign: Unveiling the Traits, Dates, and Horoscope Insights of th...
 

Jnf Commercial Real Estate And Capital Group Economy 2008 Lecture

  • 1. Peninsula Hotel Beverly Hills, California November 3, 2008
  • 2. Presentation by Robert H. Edelstein University of California at Berkeley
  • 3.
  • 4. A Quagmire of Long-Run and Short-Run Issues
  • 5. Fundamental International Economic Drivers • Competition – The World is Flat and Crowded (Friedman) • Globalization and Economic Integration: A Two-edged Sword (Stiglitz) • Capital Market Integration and Securitization – The Limits are Imagination • World Melting Pot of Socio-Political Ideology, Resource Environmental Competitiveness, Technology and Innovations • Enhanced Volatility and Responsiveness – Integrated, Compacted World
  • 6. Long View of Fundamental Economic & Financial Determinants: Summary • International Growth Locomotives: China, India & United States • Future Growth Determinants: Frontier Technologies, Globalization, Demographics, Environmental Degradation and Energy Resources
  • 7. Annual Percentage Change in GDP -4 -2 0 2 4 6 8 10 12 14 16 18 19 80 19 81 19 82 19 83 19 84 19 85 19 86 19 87 19 88 19 89 19 90 19 91 19 Source: IMF (World Economic Outlook) 92 China 19 93 19 94 GDP Growth 19 95 USA 19 96 19 97 19 98 Germany Time (Years) 19 99 20 00 India 20 01 20 02 20 03 Japan 20 04 20 05 20 06 20 07 20 * 08 20 * 09 20 10 * are estimates. 20 11 * 20 * Data after 2007 * 12 20 13 *
  • 8. Energy Use Per Capita 100000 E 90000 n e 80000 r g ( y 70000 k W U h 60000 s / e c 50000 a p p e i 40000 r t a C 30000 ) a p 20000 t i a 10000 0 Year 2002 China USA Japan Germany India Source: International Atomic Energy Agency – Energy and Environment Data Reference Bank
  • 9. U.S. Economy and the Deadly “D’s” Deluxe Living Dis-saving Debt – private and Public Deficits – Trade, Governments and Households De-Regulation Degradation – Environment, etc.
  • 10. Total Credit Market Debt Held by Rest of World as Share of Total US Credit Market Debt Outstanding; 1945-2007 Source: Flow of Funds; Table L 1
  • 11. Foreign Holdings of US Securities as Share of Total Amount Outstanding Source: US Treasury TIC data; Federal Reserve Flow of Funds
  • 12. Share of Global Reserves 2007 Source: BIS, IMF
  • 13. Share of Chinese Reserves in Dollar Denominated Securities $, Bill 73% 56% Source: Peoples Bank of China, US Treasury, Estimates by Authors
  • 14. Official Institutional Share of Holdings by Foreigners Source: US Treasury
  • 15. Capital Markets and M&A Overview Privatization Trends – 2005/2006 Drivers for Buyers • Abundant supply of institutional and opportunistic capital • Strong financing markets and attractive interest rates • Reasonable return expectations • Improving fundamentals for many asset types • Arbitrage between public and private markets / Ability to line-up sales of specific assets / portfolios Additionally, many Public Companies played a role in Privatizations through institutional / jv model: • Boards acted strategically and empowered by strong currencies and availability of low-cost debt and JV equity • Public markets were much more receptive to strategic transactions than in the past
  • 16. Capital Markets and M&A Overview Privatization Trends – 2005/2006 Drivers for Sellers Motivated seller base influenced by attractive valuations and purchase price premiums / multiples Valuations / proposals above most NAV estimates Aggressive suitors and increased review of strategic alternatives Constraints of public market Short-term accretion attention Leverage constraints Analyst and Investor perceptions Active Boards More attention to procedures, responses and corporate governance Roles for management in private forum, including growth of platform Increased scrutiny and costs of being a public company
  • 17. Capital Markets and M&A Overview 2007 Mid-Summer Correction - Context for the Current Situation Since the 2007 mid-summer correction, the capital markets have undergone a significant re-pricing of risk Risk premiums on high yield bonds have ballooned to levels well above their 12-month average of 455 bps and all-time low of 262 bps seen 6/1/2007 (1) In contrast, high yield default rates remain at an historic low of 0.9% - a record gap between risk premiums and defaults (2) Since July, financial firms have announced $181 billion of write-downs linked to sub-prime exposure (3) Major firms have raised $72.3 billion of new capital to shore up balance sheets (4) In 2007, an estimated $326 billion of residential mortgage payments reset; $412 billion are scheduled to reset during 2008 (5) (1) Source: BAS High Yield Bond Index. (2) High yield default rates of 0.9% as of 12/2007. Record gap between risk premiums and default rates as per Moody’s economist John Lonski (Source: Wall Street Journal). (3) Source: Bloomberg as of 2/29/08. (4) Source: Bloomberg as of 1/15/2008 and company reports. (5) Source: Deutsche Bank, Loan Performance and Rosen Consulting Group. Includes rate adjustments and IO expirations.
  • 18. Capital Markets and M&A Overview CMBS Market Overview
  • 19. Real Estate Company Valuations Sources: FactSet, Company reports and Wall Street Research as of 2/1/08.
  • 20.
  • 21. What Are The Follow-up “D’s” for Now? De-leveraging – Farewell Cheap Debt Distrust and Dismay Deflation – Asset Market “Booms” Farewell Disarray Defaults
  • 22. Capital Markets Overview Market Current Situation & Outlook The M&A market has slowed significantly since its late July 2007 peak as a result of the credit market “backup” The current M&A market slowdown is marked by the following dynamics: Large, highly levered financings not available Short-term asset flipping is no longer a viable strategy Seller’s pricing expectations have been slow to adjust despite market expectation of cap rate expansion Going forward, key capital market themes in M&A will include: Opportunistic investors, especially sovereign wealth funds, exerting pressure on distressed situations Likely contraction of valuation multiples / widening of cap rates Credit re-pricing and overall leverage reductions Increase in joint ventures as institutional real estate capital remains available Capital structures increasingly funded by opportunistic players such as hedge funds, commitments from multiple institutions, or SWF
  • 23. House Prices Inflate to Create an Historic Bubble Relative to underlying household income, the median house price appreciated far to fast. About two-thirds of the bubble has already been deflated. Our expectation is for the housing market to overshoot the historic price-to-income ratio. Median House Price/Avg. HH Income February 2008 MML (Recession) 2.60 2005Q3 2.40 Foreclosures Wells Bubble Policy Instituted, break-out to First in the Nation, 2003Q4 the upside. 2.20 Start of the housing bubble, 2001Q4 2.00 Ratio 1.80 1.60 Correction will overshoot. 1.40 1.20 1.00 19 8 19 9 70 19 1 72 19 3 19 4 75 19 6 19 7 19 8 79 19 0 19 1 19 2 83 19 4 85 19 6 87 19 8 89 19 0 91 19 2 93 19 4 95 19 6 97 19 8 99 20 0 01 20 2 03 20 4 05 20 6 07 20 8 09 20 0 11 12 6 6 7 7 7 7 7 7 8 8 8 8 8 8 9 9 9 9 9 0 0 0 0 0 1 19 19 19 19 19 19 19 19 19 19 19 19 19 20 20 20 20 20 20 20
  • 24. Recent Events of Concern • What Happened to Bear Stearns? • Why did IndyMac Fail? • How do FNMA and FHLMC fit into the Sub-Prime Crisis? AIG? • The BIG five: G-S, M-S, Lehman, M-L, and B-S
  • 25. Policy Action!? • Why has the Fed acted as the Ultimate Source of Liquidity? • Can the U.S. let a Large Institution Fail? • What needs to be done in the Short-Run and the Long-Run?
  • 26. ABX-HE Index Prices Have Deteriorated This chart shows the ABX index for AAA bonds backed by home equity loans issued in February 2007 (as of April 22). Even AAA bonds have lost about 43% their value in 14 months.
  • 27. Summary The financial markets are still under stress. Losses from mortgage derivatives are creating counter-party risk, and they have prevented the normal flow of transactions and credit as a result. The result is that risk spreads are elevated. The poor economic outlook has also boosted the risk spread in the corporate sector foreshadowing increased corporate bankruptcies, loan and bond defaults. The Fed and the Treasury are still engaged!?
  • 28.
  • 29. Elements for the Short-term and Long- term Resolution of the Subprime and Other Financial Crises Devise Programs to Stabilize the Housing Market and Housing Finance System Engender Housing and General Financial Market Viability Implement Policies that Avoid Recurrence and Moral Hazards Prepare for Potential Wider Domestic Economic Implication of the Sub-prime Crisis Recognize and Plan for Potential Global Economic and Financial System Interactions 29
  • 30. Overview Subprime Issues Direct Effects Delinquencies Foreclosures home prices Lender Industry and Secondary Market Behavior New Profit Model Underwriting Standards Fee Structures Accessibility of Secondary Market Risk Contagion Effects New Construction Real Estate Services Equity Loans Financial Institutions Global Effects Risk Spread “Adjustments” U.S. Consumption and International Trade, World-wide Stock Market/Bond Market 30
  • 31. Why Were We So Susceptible to the Subprime Crisis? • Diminution of Underwriting Quality • Inexperience of Owner-Borrowers • Financial “Wizardry” • Aggressive, Risk-Taking Investors 31
  • 32. How Exposed Are We? Total US housing stock is 128 million units Annual sales since 2000 represent between 4-6% of stock States with high levels of price declines account for a large share of housing stock; and larger share of mortgages outstanding Nationwide, the ability to buy a home has not changed dramatically, but regional variations show large areas of vulnerability Subprime loans are 12 percent of all outstanding mortgages 32
  • 33. Per Capita Income and Home Price Indices Compared, Far West, 1975-2008 1600 1400 1200 1000 800 600 400 200 0 75 77 79 81 83 85 87 89 91 93 95 97 99 01 03 05 07 19 19 19 19 19 19 19 19 19 19 19 19 20 20 20 20 19 OFHEO index Per Capita Income Index Source: Indices created by authors using Office of Federal Housing Enterprise Oversight index (adjusted to 1975 base); US Bureau of Economic Analysis data. 33
  • 34. Understanding Variation in Exposure and Experience Can Help Shape Policy Wide variation within the US in housing markets (median 2007 home value ranges from $88,000 in Mississippi to $536,000 in California) Wide variation in exposure to subprime loans (low of 6% in South Dakota, high of 20% in Nevada) Share of subprimes in foreclosure range from 3% in Utah to 18% in Michigan Factors, such as age, household size, ownership rates, and government regulation, can influence the level and outcome of exposure. 34
  • 35. Local and State Revenue Impacts Loss of Capital Gains Tax Loss of Property Tax Base Other Transactions Based Fees and Taxes
  • 36. Some Troubling Conclusions Regional differences are significant? Homeownership at what social costs? Credit tightening needs to be selective, especially where economies are weak? 36
  • 37. Policy Objectives Stability in Housing (and other asset) Markets Retaining high home ownership rates Arresting drastic value slide Maintaining ownership incentives for households with negative equity Normalizing new and existing market activity Liquidity in Mortgage (and other asset) Markets Stabilizing financial markets Efficient securitization Reorganizing Fannie and Freddie to be viable entities (at low social costs) 37
  • 38. Whose Problem? • Homeowners/Borrowers • Homebuyers • Home-sellers • Builders • Lenders • Securitizers • Investors • Regulators • Taxpayers • Government sector • International Components 38
  • 39. Policy Evaluation Criteria/Benchmarks Moral Hazard Issue or Chance of Recurrence Fairness and Equity Bang for the Buck (Efficiency) “Good” vs. “Bad” Subprime Loans Distributional (Income and Geographic) Impacts Linkages of Housing finance System with Broader Financial System and Economy 39
  • 40. The Secondary Market Enigma 1. FNMA and FHLMC 2. FDIC and Banks 3. IB and Securitization 4. Monoline Insurers 5. CDS 40
  • 41. Real Sector Constraints for Policy Economic Environment Job Creation Household Formation Wage Growth Prospects 41
  • 42. Policy Perspective No Single Policy is the Silver Bullet Complex Benefits-Costs Analyses Require Multi-faceted Solutions Regional-State Differences Require Regionally Differentiated Approaches Reinvigorate Securitization Process Triage “Bad” Loans 42
  • 43. Targeting Policy Economic Slow-downs Credit Tightening Loss of Confidence in System 43
  • 44. What Should We Focus on Next? Credit Crunch Synchronized World Recession China Bubbles Burst Dollar Crash (Inflation Risk) Geopolitical Risks
  • 46. Positive Demographics – Echo – Baby Boom; 72 Million People in Next 10 Years Expensive Energy Scenarios – Changing Urban Form and Urban Density Financing Real Estate – What’s Next? U.S. May Represent Best Real Estate Investment “Opportunistic Plays” During Next Five Years!?
  • 47. Office – Not Overbuilt, Except O.C., Seattle Residential – Rebound in Values Over the Next Five Years; MF vs. SF Retail – Well-Situated (LxLxL) Hotels – Dangerous Sector? Industrial/Warehouse – If Globalization Continues?! Securitized Real Estate Markets -- ? Land Play – Have a Hunch---Buy a Bunch will Not Work!? -- Not for the Meek!