Leverage in Pittsburgh’s Skyline is projected to shift as construction and planned consolidations will likely push vacancy above 10.0 percent by mid-2018.
1. Skyline vacancy to increase, leverage to shift
Pittsburgh
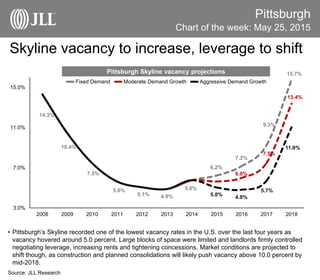
• Pittsburgh’s Skyline recorded one of the lowest vacancy rates in the U.S. over the last four years as
vacancy hovered around 5.0 percent. Large blocks of space were limited and landlords firmly controlled
negotiating leverage, increasing rents and tightening concessions. Market conditions are projected to
shift though, as construction and planned consolidations will likely push vacancy above 10.0 percent by
mid-2018.
Source: JLL Research
Chart of the week: May 25, 2015
6.2%
7.2%
9.3%
15.7%
14.3%
10.4%
7.5%
5.6%
5.1% 4.9%
5.8%
6.0%
7.5%
13.4%
5.0% 4.8%
5.7%
11.0%
3.0%
7.0%
11.0%
15.0%
2008 2009 2010 2011 2012 2013 2014 2015 2016 2017 2018
Fixed Demand Moderate Demand Growth Aggressive Demand Growth
Pittsburgh Skyline vacancy projections