SlideShare a Scribd company logo
Notable leases
Notable portfolio sales
Buyer Seller Bldg(s) | SF
Price
per
s.f.
Westmount Prologis-Class B portfolio 19 | 1,378,731 $49
Hillwood
CBREI/CalSTRS- Tinley Park Class A
portfolio
3 | 1,231,950 $51
Heitman
Dermody/AEW -McCook infill spec
redevelopment
2 | 665,549 $90
Lincoln
Property
Molto- I-55 Class A portfolio 3 | 350,622 $99
IPT
ARES- 7 building national Class A
portfolio
1 | 443,620 $64
Cabot DCT- 4 building Fox Valley Class B 4 | 829,190 $40
Big box activity leads to a dwindling stock of spaces
Industrial Insight
Chicago | Q2 2016
3.4 M
Q2 2016 net absorption (s.f.)
5.14%
Representative Class A cap rate
18.3 M
Total under construction (s.f.)
$4.78
Average asking rent (p.s.f.)
6.9%
Total vacancy
0
Available existing Class A distribution
spaces over 1.0 m.s.f.
7.8 M
YTD completions (s.f.)
6.2%
Metro Chicago April unemployment
Tenant name: submarket Deal type Size (s.f.)
Sears: I-55 Renewal 814,848
Seattle-based e-commerce company: I-55 New lease 767,171
Seattle-based e-commerce company: I-80 Prelease 746,722
Confidential food company: I-80 Prelease 720,000
Best Buy: I-55 BTS 615,160
Leasing recap
The largest lease of the second quarter was a renewal by Sears for 815,000 square
feet at 1701 W. Normantown Road in Romeoville. Sears exercised a fixed rate option
to stay in the Heitman-owned building for five more years. Also in suburban Will
County, a large e-commerce user inked two new leases; for a combined 1.5 million
square feet of new fulfillment and distribution space. At 1125 Remington Boulevard in
Romeoville, RREEF secured the company in 767,161 square feet of second
generation Class A space that is being vacated by 3PL Central American. In Joliet,
news outlets report that the company will create 2,000 full time jobs as they preleased
Hillwood’s to be completed 746,722-square-foot spec building at 201 Emerald Road.
Activity has been brisk at RidgePort Logistics Center where new owner Elion Partners
inked a prelease with a confidential food company to take 720,000 square feet of the
29700 Graaskamp Road building which is currently being expanded to 1.1 million
square feet. The north portion of the building, completed in 2015 is already occupied
by Consolidated Distribution. The Mary Kelley farm site in Bolingbrook, one of the last
remaining tracts for big box development in the I-55 corridor, is now committed to a
615,000-square-foot build-to-suit for Best Buy to be developed by Northern Builders.
Sales recap
A joint venture between Westmount Realty and Partners Group picked up a 1.4
million-square-foot 19 Class B multi-tenant portfolio. The portfolio is 86 percent
occupied and the majority of the properties are around the O’Hare market. In south
suburban Tinley Park, CBREI on behalf of CalSTRS sold a three-building portfolio to
Hillwood. The largest building in the package was the 915,000 square-foot 18801
Oak Park Ave which is fully leased to M Block & Sons through the end of 2017. In the
Fox Valley, DCT sold off four buildings to Cabot for an average price of just under $40
per square-foot as the assets were built in the 1970’s and 1980’s. One other building
traded outside of the portfolio at $34 per square-foot. STAG acquired a 250,000-
square-foot building at 1726 Blackhawk Drive in West Chicago leased to World
Tableware. Across the border in Pleasant Prairie, CenterPoint sold the 891,567-
square-foot S.C. Johnson distribution center at 9800 72nd Avenue to Exeter at a 6.2
cap rate. In Aurora, LIM acquired the newly completed 304,560 square-foot PPG
build-to-suit at 2570 Orchard Gateway Road from developer Conor Commercial for
$28 million.
Notable land trades- Transportation advantaged sites: Big Box exurban and infill
In Joliet, CBREI and First Industrial exited its position on a 262-acre
site in between Route 6 and the Des Plaines River this spring with a
$4.4 million sale to Ketone Partners. A local developer is under
contract on 75 acres on the upland portion of the site with drawings for
a million square-foot building. Ketone also plans to develop a 175,000-
square-foot, rear-load building on a pad fronting Route 6. There is hope
that state and local leaders will move forward with the Houbolt Road
Bridge spanning the river on the east portion of the site which will
alleviate the heavy truck traffic at the nation’s largest inland port at the
nearby UP and BNSF intermodals.
In Niles, MFRI sold an obsolete manufacturing facility at 7720 N Lehigh
in infill North Cook County, to Molto Properties for just under $11 per
land square foot in May. Molto will clear the 8.2-acre parcel and start
construction on a 136,000-square-foot speculative building this year.
Florida-based Elion Partners acquired 1,100 acres of land making up
the RidgePort Logistics Center in Wilmington. The seller was a
partnership of Ridge Development and Prudential and Ridge will
continue to be involved in future development of the BNSF rail served
park. The sale price was $55 million and the site has the potential to
accommodate up to 12 million square feet of new product.
Midwest Industrial Funds sold a 9.3-acre redevelopment site located at
8500 W. 68th Street in Bedford Park to Penske Truck Leasing for $3.3
million. Midwest Industrial acquired the site in 2014 and had completed
design and engineering work fleet maintenance structure with heavy
trailer parking. This site is in close proximity to both the CSX intermodal
and numerous other trucking and logistics users clustered along the
Stevenson Expressway and I-294.
Historical absorption and vacancy Average total asking rent ($ p.s.f.)
O’Hare Class A large block availabilities: Existing & under const.
©2016 Jones Lang LaSalle IP, Inc. All rights reserved.For more information, contact: Christian Beaudoin | christian.beaudoin@am.jll.com George Cutro | george.cutro@am.jll.com
Chad Buch | chad.buch@am.jll.com Paul Marsh | paul.marsh@am.jll.com
$4.44
$4.13 $4.12 $4.12
$4.27 $4.35
$4.74 $4.78
$2.00
$3.00
$4.00
$5.00
2009 2010 2011 2012 2013 2014 2015 2Q 2016
0.0%
3.0%
6.0%
9.0%
12.0%
15.0%
-10,000,000
0
10,000,000
20,000,000
2010 2011 2012 2013 2014 2015 YTD
2016
Net absorption Total vacancy
9234 Belmont Ave, 179,164
2801 S Busse Rd, 171,548
555 Northwest Ave, 588,233 1800 Nicholas Blvd, 131,728 3710-3720 River Rd, 90,555
855 N Wood Dale, 231,679 3801 Rose St, 102,020 11501 W Irving Park Rd, 88,060
UC- 3400 Wolf Rd, 491,089 UC- 11333 Addison St, 194,260 251 Wille Rd, 77,450
UC- 3801 Centrella St, 367,389 UC-11600 W Grand Ave, 182,923 371-377 Meyer Rd, 67,320
200K SF+ Big Box 100K-200K SF 50K-100K SF
Industrial Statistics
Chicago | Q2 2016
Inventory
(s.f.)
Quarterly
total net
absorption
(s.f.)
YTD
total net
absorption
(s.f.)
YTD
total net
absorption
(% of stock)
Total
vacancy
(%)
Total
availability
(%)
Average
total asking
rent
($ p.s.f.)
Quarterly
completions
(s.f.)
YTD
completions
(s.f.)
Under
construction
(s.f.)
Lake County
Warehouse / Distribution 35,945,949 -39,855 250,519 0.7% 13.0% 14.6% $5.49 646,848 716,848 400,758
Manufacturing 31,234,667 75,233 -85,400 -0.3% 6.2% 7.2% $5.63 0 0 0
General 93,277 40,165 40,165 43.1% 0.0% 0.0% $0.00 40,165 40,165 20,000
Total industrial 67,273,893 75,543 205,284 0.3% 9.8% 11.2% $5.52 687,013 757,013 420,758
North Cook County
Warehouse / Distribution 15,492,706 -43,309 88,289 0.6% 7.1% 8.5% $5.65 0 217,280 0
Manufacturing 32,750,865 -92,349 91,181 0.3% 5.2% 7.0% $5.52 0 0 0
General 73,274 0 0 0.0% 0.0% 0.0% $0.00 0 0 0
Total industrial 48,316,845 -135,658 179,470 0.4% 5.8% 7.5% $5.59 0 217,280 0
Northwest Cook County
Warehouse / Distribution 13,244,377 59,662 10,911 0.1% 10.2% 11.5% $5.02 0 423,672 0
Manufacturing 13,134,247 205,816 141,327 1.1% 9.0% 9.2% $4.72 0 0 0
General 80,592 0 0 0.0% 0.0% 0.0% $0.00 0 0 0
Total industrial 26,459,216 265,478 152,238 0.6% 9.6% 10.3% $4.87 0 423,672 0
O'Hare
Warehouse / Distribution 55,703,656 -721,496 182,130 0.3% 6.2% 9.1% $5.93 0 0 440,000
Manufacturing 37,863,339 126,390 -111,515 -0.3% 5.6% 7.2% $5.41 0 0 0
General 29,015 0 0 0.0% 0.0% 0.0% $0.00 0 0 0
Total industrial 93,596,010 -595,106 70,615 0.1% 5.9% 8.4% $5.76 0 0 440,000
West Cook County
Warehouse / Distribution 42,848,916 -218,891 -285,567 -0.7% 14.1% 15.9% $5.21 0 0 1,518,784
Manufacturing 50,017,590 -757,844 -638,099 -1.3% 6.1% 7.3% $5.13 0 0 0
General 24,600 0 0 0.0% 0.0% 0.0% $0.00 0 0 0
Total industrial 92,891,106 -976,735 -923,666 -1.0% 9.8% 11.3% $5.20 0 0 1,518,784
North Chicago
Warehouse / Distribution 18,701,998 -453,218 -521,868 -2.8% 6.3% 6.6% $10.71 0 0 40,700
Manufacturing 41,119,098 356,296 264,115 0.6% 6.1% 6.9% $7.43 0 0 0
General 25,000 0 0 0.0% 0.0% 0.0% $0.00 0 0 0
Total industrial 59,846,096 -96,922 -257,753 -0.4% 6.2% 6.8% $8.61 0 0 40,700
South Chicago
Warehouse / Distribution 34,628,291 164,926 273,481 0.8% 6.7% 7.5% $6.43 41,298 261,156 227,043
Manufacturing 61,144,678 217,037 69,456 0.1% 6.7% 8.2% $5.82 0 0 196,000
General 103,790 0 0 0.0% 0.0% 0.0% $0.00 0 0 0
Total industrial 95,876,759 381,963 342,937 0.4% 6.7% 7.9% $6.04 41,298 261,156 423,043
George Cutro - Director, Industrial Research
8755 W Higgins Rd Suite 750 Chicago, IL 60631 tel +1 773 458 1433 george.cutro@am.jll.com
2016 Jones Lang LaSalle IP, Inc. All rights reserved.
Chicago | Q2 2016
Inventory
(s.f.)
Quarterly
total net
absorption
(s.f.)
YTD
total net
absorption
(s.f.)
YTD
total net
absorption
(% of stock)
Total
vacancy
(%)
Total
availability
(%)
Average
total asking
rent
($ p.s.f.)
Quarterly
completions
(s.f.)
YTD
completions
(s.f.)
Under
construction
(s.f.)
South Suburbs
Warehouse / Distribution 40,186,428 754,770 498,622 1.2% 6.7% 9.2% $3.97 0 0 0
Manufacturing 43,314,506 221,011 107,237 0.2% 6.6% 7.4% $6.09 33,000 33,000 0
General 1,167,630 0 0 0.0% 0.0% 0.0% $0.00 0 0 0
Total industrial 84,668,564 975,781 605,859 0.7% 6.5% 8.2% $4.40 33,000 33,000 0
I-57 Corridor
Warehouse / Distribution 20,667,475 -96,017 3,171 0.0% 8.8% 8.8% $3.79 0 0 0
Manufacturing 9,454,414 -17,911 -15,464 -0.2% 3.6% 3.6% $6.25 0 0 185,000
General 275,905 28,405 28,405 10.3% 55.3% 55.3% $0.00 0 0 0
Total industrial 30,397,794 -85,523 16,112 0.1% 7.6% 7.6% $3.81 0 0 185,000
I-80 Corridor
Warehouse / Distribution 57,984,028 2,648,977 3,898,134 6.7% 5.0% 5.9% $4.21 1,618,575 1,958,509 6,406,401
Manufacturing 15,821,275 92,038 73,371 0.5% 5.4% 5.4% $7.42 0 0 202,812
General 135,070 0 0 0.0% 0.0% 0.0% $0.00 0 0 0
Total industrial 73,940,373 2,741,015 3,971,505 5.4% 5.1% 5.8% $4.33 1,618,575 1,958,509 6,609,213
I-55 Corridor
Warehouse / Distribution 68,230,815 279,245 1,003,565 1.5% 5.8% 8.5% $5.09 89,887 504,143 2,784,273
Manufacturing 12,277,888 241,560 414,352 3.4% 2.6% 7.2% $6.35 0 0 0
General 54,200 0 0 0.0% 26.2% 26.2% $0.00 0 0 0
Total industrial 80,562,903 520,805 1,417,917 1.8% 5.3% 8.3% $5.18 89,887 504,143 2,784,273
I-88 Corridor
Warehouse / Distribution 37,074,672 1,408,932 1,420,175 3.8% 4.9% 8.1% $4.40 1,078,846 1,223,846 1,472,425
Manufacturing 22,651,181 -119,751 5,017 0.0% 4.9% 6.0% $4.97 0 0 43,000
General 124,340 0 0 0.0% 0.0% 0.0% $0.00 0 0 0
Total industrial 59,850,193 1,289,181 1,425,192 2.4% 4.9% 7.3% $4.50 1,078,846 1,223,846 1,515,425
North DuPage County
Warehouse / Distribution 46,154,822 -865,091 -667,001 -1.4% 6.4% 9.4% $5.05 0 89,000 1,451,044
Manufacturing 33,285,673 95,634 108,477 0.3% 3.8% 5.9% $6.07 0 0 0
General 12,690 0 0 0.0% 0.0% 0.0% $0.00 0 0 0
Total industrial 79,453,185 -769,457 -558,524 -0.7% 5.3% 8.0% $5.27 0 89,000 1,451,044
Fox Valley
Warehouse / Distribution 18,049,021 -474,953 -712,147 -3.9% 7.4% 10.5% $4.05 0 0 0
Manufacturing 17,446,771 -69,409 186,419 1.1% 3.0% 3.3% $5.04 0 299,520 430,696
General 0 0 0 0.0% 0.0% 0.0% $0.00 0 0 0
Total industrial 35,495,792 -544,362 -525,728 -1.5% 5.3% 6.9% $4.25 0 299,520 430,696
North Kane County
Warehouse / Distribution 15,250,346 -116,302 -140,674 -0.9% 14.9% 15.9% $5.02 0 82,922 1,109,143
Manufacturing 14,850,953 -30,542 142,228 1.0% 4.4% 4.4% $4.73 0 0 156,400
General 13,200 0 0 0.0% 0.0% 0.0% $0.00 0 0 0
Total industrial 30,114,499 -146,844 1,554 0.0% 9.7% 10.2% $4.95 0 82,922 1,265,543
8755 W Higgins Rd Suite 750 Chicago, IL 60631 tel +1 773 458 1433 george.cutro@am.jll.com
2016 Jones Lang LaSalle IP, Inc. All rights reserved.
George Cutro - Director, Industrial Research
Chicago | Q2 2016
Inventory
(s.f.)
Quarterly
total net
absorption
(s.f.)
YTD
total net
absorption
(s.f.)
YTD
total net
absorption
(% of stock)
Total
vacancy
(%)
Total
availability
(%)
Average
total asking
rent
($ p.s.f.)
Quarterly
completions
(s.f.)
YTD
completions
(s.f.)
Under
construction
(s.f.)
McHenry County
Warehouse / Distribution 10,630,867 55,711 -11,893 -0.1% 1.8% 4.3% $4.63 0 0 0
Manufacturing 18,858,696 -71,637 150,769 0.8% 19.2% 19.6% $3.58 0 0 0
General 0 0 0 0.0% 0.0% 0.0% $0.00 0 0 0
Total industrial 29,489,563 -15,926 138,876 0.5% 12.9% 14.0% $3.71 0 0 0
Rockford
Warehouse / Distribution 10,320,576 -9,920 48,696 0.5% 8.4% 12.1% $3.24 0 0 0
Manufacturing 13,617,911 -58,941 -74,343 -0.5% 12.2% 12.4% $3.36 0 0 0
General 0 0 0 0.0% 0.0% 0.0% $0.00 0 0 0
Total industrial 23,938,487 -68,861 -25,647 -0.1% 10.6% 12.3% $3.33 0 0 0
I-39 Corridor
Warehouse / Distribution 13,716,499 50,867 28,267 0.2% 5.5% 7.7% $3.92 0 0 978,120
Manufacturing 18,166,489 4,270 229,140 1.3% 5.1% 7.2% $3.03 0 210,000 0
General 34,450 0 0 0.0% 0.0% 0.0% $0.00 0 0 0
Total industrial 31,917,438 55,137 257,407 0.8% 5.3% 7.4% $3.35 0 210,000 978,120
Northwest Indiana
Warehouse / Distribution 9,544,984 297,840 259,936 2.7% 11.3% 12.1% $3.93 159,813 159,813 38,121
Manufacturing 21,249,968 362,048 377,048 1.8% 8.1% 8.9% $3.24 300,000 300,000 0
General 0 0 0 0.0% 0.0% 0.0% $0.00 0 0 0
Total industrial 30,794,952 659,888 636,984 2.1% 9.1% 9.9% $3.54 459,813 459,813 38,121
Southeast Wisconsin
Warehouse / Distribution 28,545,291 -121,202 -570,851 -2.0% 7.6% 8.7% $4.60 601,491 683,391 200,696
Manufacturing 24,546,010 30,265 746,850 3.0% 2.8% 4.1% $3.29 0 629,585 0
General 43,624 0 0 0.0% 0.0% 0.0% $0.00 0 0 0
Total industrial 53,134,925 -90,937 175,999 0.3% 5.4% 6.5% $4.41 601,491 1,312,976 200,696
Warehouse & Distribution 592,921,717 2,560,676 5,055,895 0.9% 7.6% 9.6% $4.88 4,236,758 6,320,580 17,067,508
Manufacturing 532,806,219 809,214 2,182,166 0.4% 6.2% 7.4% $4.55 333,000 1,472,105 1,213,908
General 2,290,657 68,570 68,570 3.0% 7.3% 7.3% $0.00 40,165 40,165 20,000
Totals 1,128,018,593 3,438,460 7,306,631 0.6% 6.9% 8.5% $4.78 4,609,923 7,832,850 18,301,416
George Cutro - Director, Industrial Research
8755 W Higgins Rd Suite 750 Chicago, IL 60631 tel +1 773 458 1433 george.cutro@am.jll.com
2016 Jones Lang LaSalle IP, Inc. All rights reserved.

More Related Content

What's hot

Q4 2012 Cincinnati Market Trends Industrial
Q4 2012 Cincinnati Market Trends IndustrialQ4 2012 Cincinnati Market Trends Industrial
Q4 2012 Cincinnati Market Trends Industrialcolliersohio
 
NCEast Alliance 2016 State of the Region
NCEast Alliance 2016 State of the RegionNCEast Alliance 2016 State of the Region
NCEast Alliance 2016 State of the RegionNCEast Alliance
 
JLL Pittsburgh Industrial Insight & Statistics - Q2 2021
JLL Pittsburgh Industrial Insight & Statistics - Q2 2021JLL Pittsburgh Industrial Insight & Statistics - Q2 2021
JLL Pittsburgh Industrial Insight & Statistics - Q2 2021Tobiah Bilski
 
JLL Pittsburgh Industrial Insight & Statistics - Q1 2017
JLL Pittsburgh Industrial Insight & Statistics - Q1 2017JLL Pittsburgh Industrial Insight & Statistics - Q1 2017
JLL Pittsburgh Industrial Insight & Statistics - Q1 2017Tobiah Bilski
 
University Of Toronto Nature Of Employment Lands
University Of Toronto Nature Of Employment LandsUniversity Of Toronto Nature Of Employment Lands
University Of Toronto Nature Of Employment Landsalorius
 
JLL Detroit Industrial Insight & Statistics - Q1 2019
JLL Detroit Industrial Insight & Statistics - Q1 2019JLL Detroit Industrial Insight & Statistics - Q1 2019
JLL Detroit Industrial Insight & Statistics - Q1 2019Harrison West
 
Austin’s industrial market closes 2018 with new buildings and high absorption
Austin’s industrial market closes 2018 with new buildings and high absorptionAustin’s industrial market closes 2018 with new buildings and high absorption
Austin’s industrial market closes 2018 with new buildings and high absorptionColliers International | Houston
 
JLL Cleveland Industrial Outlook: Q4 2016
JLL Cleveland Industrial Outlook: Q4 2016JLL Cleveland Industrial Outlook: Q4 2016
JLL Cleveland Industrial Outlook: Q4 2016Andrew Batson
 
JLL Cleveland Industrial Outlook: Q3 2018
JLL Cleveland Industrial Outlook: Q3 2018JLL Cleveland Industrial Outlook: Q3 2018
JLL Cleveland Industrial Outlook: Q3 2018Andrew Batson
 
JLL Detroit Industrial Insight & Statistics - Q4 2017
JLL Detroit Industrial Insight & Statistics - Q4 2017JLL Detroit Industrial Insight & Statistics - Q4 2017
JLL Detroit Industrial Insight & Statistics - Q4 2017Harrison West
 
Detroit Q3 2018 Industrial Market Report
Detroit Q3 2018 Industrial Market ReportDetroit Q3 2018 Industrial Market Report
Detroit Q3 2018 Industrial Market ReportDavid Abraham, MAI, SRA
 
JLL Cincinnati Industrial Outlook - Q3 2016
JLL Cincinnati Industrial Outlook - Q3 2016JLL Cincinnati Industrial Outlook - Q3 2016
JLL Cincinnati Industrial Outlook - Q3 2016Ross Bratcher
 
St. Louis Industrial Outlook Q3 2016
St. Louis Industrial Outlook Q3 2016St. Louis Industrial Outlook Q3 2016
St. Louis Industrial Outlook Q3 2016Blaise Tomazic
 

What's hot (15)

Q4 2012 Cincinnati Market Trends Industrial
Q4 2012 Cincinnati Market Trends IndustrialQ4 2012 Cincinnati Market Trends Industrial
Q4 2012 Cincinnati Market Trends Industrial
 
NCEast Alliance 2016 State of the Region
NCEast Alliance 2016 State of the RegionNCEast Alliance 2016 State of the Region
NCEast Alliance 2016 State of the Region
 
JLL Pittsburgh Industrial Insight & Statistics - Q2 2021
JLL Pittsburgh Industrial Insight & Statistics - Q2 2021JLL Pittsburgh Industrial Insight & Statistics - Q2 2021
JLL Pittsburgh Industrial Insight & Statistics - Q2 2021
 
JLL Pittsburgh Industrial Insight & Statistics - Q1 2017
JLL Pittsburgh Industrial Insight & Statistics - Q1 2017JLL Pittsburgh Industrial Insight & Statistics - Q1 2017
JLL Pittsburgh Industrial Insight & Statistics - Q1 2017
 
Q3 2020 | Austin Industrial | Research & Forecast Report
Q3 2020 | Austin Industrial | Research & Forecast ReportQ3 2020 | Austin Industrial | Research & Forecast Report
Q3 2020 | Austin Industrial | Research & Forecast Report
 
University Of Toronto Nature Of Employment Lands
University Of Toronto Nature Of Employment LandsUniversity Of Toronto Nature Of Employment Lands
University Of Toronto Nature Of Employment Lands
 
JLL Detroit Industrial Insight & Statistics - Q1 2019
JLL Detroit Industrial Insight & Statistics - Q1 2019JLL Detroit Industrial Insight & Statistics - Q1 2019
JLL Detroit Industrial Insight & Statistics - Q1 2019
 
Austin’s industrial market closes 2018 with new buildings and high absorption
Austin’s industrial market closes 2018 with new buildings and high absorptionAustin’s industrial market closes 2018 with new buildings and high absorption
Austin’s industrial market closes 2018 with new buildings and high absorption
 
JLL Cleveland Industrial Outlook: Q4 2016
JLL Cleveland Industrial Outlook: Q4 2016JLL Cleveland Industrial Outlook: Q4 2016
JLL Cleveland Industrial Outlook: Q4 2016
 
JLL Cleveland Industrial Outlook: Q3 2018
JLL Cleveland Industrial Outlook: Q3 2018JLL Cleveland Industrial Outlook: Q3 2018
JLL Cleveland Industrial Outlook: Q3 2018
 
Q1 2021 Austin Office Report
Q1 2021 Austin Office ReportQ1 2021 Austin Office Report
Q1 2021 Austin Office Report
 
JLL Detroit Industrial Insight & Statistics - Q4 2017
JLL Detroit Industrial Insight & Statistics - Q4 2017JLL Detroit Industrial Insight & Statistics - Q4 2017
JLL Detroit Industrial Insight & Statistics - Q4 2017
 
Detroit Q3 2018 Industrial Market Report
Detroit Q3 2018 Industrial Market ReportDetroit Q3 2018 Industrial Market Report
Detroit Q3 2018 Industrial Market Report
 
JLL Cincinnati Industrial Outlook - Q3 2016
JLL Cincinnati Industrial Outlook - Q3 2016JLL Cincinnati Industrial Outlook - Q3 2016
JLL Cincinnati Industrial Outlook - Q3 2016
 
St. Louis Industrial Outlook Q3 2016
St. Louis Industrial Outlook Q3 2016St. Louis Industrial Outlook Q3 2016
St. Louis Industrial Outlook Q3 2016
 

Viewers also liked

Técnicas De Investigación
Técnicas De InvestigaciónTécnicas De Investigación
Técnicas De InvestigaciónDavid Cardona
 
EL PATRIMONIO EMPRESARIAL Y LAS CUENTAS ANUALES
EL PATRIMONIO EMPRESARIAL Y LAS CUENTAS ANUALESEL PATRIMONIO EMPRESARIAL Y LAS CUENTAS ANUALES
EL PATRIMONIO EMPRESARIAL Y LAS CUENTAS ANUALESaarasha013
 
Dossier maltrattamento bambini 2016 web
Dossier maltrattamento bambini 2016 webDossier maltrattamento bambini 2016 web
Dossier maltrattamento bambini 2016 webAgi
 
Presentation cideg cursos y asesorias online
Presentation cideg cursos y asesorias onlinePresentation cideg cursos y asesorias online
Presentation cideg cursos y asesorias onlineCarlos Ruiz Bolivar
 
EL PROCESO ADMINISTRATIVO
EL PROCESO ADMINISTRATIVOEL PROCESO ADMINISTRATIVO
EL PROCESO ADMINISTRATIVOaarasha013
 
La Función Financiera
La Función FinancieraLa Función Financiera
La Función Financieraaarasha013
 
LA ORGANIZACIÓN DE LA EMPRESA
LA ORGANIZACIÓN DE LA EMPRESALA ORGANIZACIÓN DE LA EMPRESA
LA ORGANIZACIÓN DE LA EMPRESAaarasha013
 

Viewers also liked (10)

Wanderlust
Wanderlust Wanderlust
Wanderlust
 
Técnicas De Investigación
Técnicas De InvestigaciónTécnicas De Investigación
Técnicas De Investigación
 
EL PATRIMONIO EMPRESARIAL Y LAS CUENTAS ANUALES
EL PATRIMONIO EMPRESARIAL Y LAS CUENTAS ANUALESEL PATRIMONIO EMPRESARIAL Y LAS CUENTAS ANUALES
EL PATRIMONIO EMPRESARIAL Y LAS CUENTAS ANUALES
 
Dossier maltrattamento bambini 2016 web
Dossier maltrattamento bambini 2016 webDossier maltrattamento bambini 2016 web
Dossier maltrattamento bambini 2016 web
 
Presentation cideg cursos y asesorias online
Presentation cideg cursos y asesorias onlinePresentation cideg cursos y asesorias online
Presentation cideg cursos y asesorias online
 
EL PROCESO ADMINISTRATIVO
EL PROCESO ADMINISTRATIVOEL PROCESO ADMINISTRATIVO
EL PROCESO ADMINISTRATIVO
 
La Función Financiera
La Función FinancieraLa Función Financiera
La Función Financiera
 
LA ORGANIZACIÓN DE LA EMPRESA
LA ORGANIZACIÓN DE LA EMPRESALA ORGANIZACIÓN DE LA EMPRESA
LA ORGANIZACIÓN DE LA EMPRESA
 
Entre citas y suturas
Entre citas y suturasEntre citas y suturas
Entre citas y suturas
 
Laia es... ¡maravillosa!
Laia es... ¡maravillosa!Laia es... ¡maravillosa!
Laia es... ¡maravillosa!
 

Similar to JLL Chicago Industrial Insights Q2 2016

JLL Houston Industrial Report Q4
JLL Houston Industrial Report Q4JLL Houston Industrial Report Q4
JLL Houston Industrial Report Q4Rebecca Moraitakis
 
JLL Q4 Houston Industrial Insight
JLL Q4 Houston Industrial InsightJLL Q4 Houston Industrial Insight
JLL Q4 Houston Industrial InsightDavidDominy1
 
JLL Louisville Industrial Outlook - Q3 2019
JLL Louisville Industrial Outlook - Q3 2019JLL Louisville Industrial Outlook - Q3 2019
JLL Louisville Industrial Outlook - Q3 2019Alex Westcott
 
JLL Columbus Industrial Outlook: Q3 2016
JLL Columbus Industrial Outlook: Q3 2016JLL Columbus Industrial Outlook: Q3 2016
JLL Columbus Industrial Outlook: Q3 2016Peter McStravick
 
JLL Pittsburgh Industrial Insight & Statistics - Q4 2020
JLL Pittsburgh Industrial Insight & Statistics - Q4 2020JLL Pittsburgh Industrial Insight & Statistics - Q4 2020
JLL Pittsburgh Industrial Insight & Statistics - Q4 2020Tobiah Bilski
 
Mid-Year Suburban Market Report
Mid-Year Suburban Market ReportMid-Year Suburban Market Report
Mid-Year Suburban Market ReportAmy Binstein
 
Last_Mile_Hines2017_Submission
Last_Mile_Hines2017_SubmissionLast_Mile_Hines2017_Submission
Last_Mile_Hines2017_SubmissionDaniel Mihalov
 
JLL Louisville Industrial Outlook - Q2 2018
JLL Louisville Industrial Outlook - Q2 2018JLL Louisville Industrial Outlook - Q2 2018
JLL Louisville Industrial Outlook - Q2 2018Alex Westcott
 
JLL Columbus Industrial Outlook: Q1 2017
JLL Columbus Industrial Outlook: Q1 2017JLL Columbus Industrial Outlook: Q1 2017
JLL Columbus Industrial Outlook: Q1 2017Andrew Batson
 
2Q16 CBD Market Report
2Q16 CBD Market Report2Q16 CBD Market Report
2Q16 CBD Market ReportAmy Binstein
 
JLL Pittsburgh Industrial Insight & Statistics - Q3 2020
JLL Pittsburgh Industrial Insight & Statistics - Q3 2020JLL Pittsburgh Industrial Insight & Statistics - Q3 2020
JLL Pittsburgh Industrial Insight & Statistics - Q3 2020Tobiah Bilski
 
Jll Louisville Industrial Outlook - Q1 2020
Jll Louisville Industrial Outlook - Q1 2020Jll Louisville Industrial Outlook - Q1 2020
Jll Louisville Industrial Outlook - Q1 2020Alex Westcott
 
JLL Louisville Industrial Outlook - Q3 2019
JLL Louisville Industrial Outlook - Q3 2019JLL Louisville Industrial Outlook - Q3 2019
JLL Louisville Industrial Outlook - Q3 2019Alex Westcott
 
JLL Louisville Industrial Outlook - Q3 2019
JLL Louisville Industrial Outlook - Q3 2019JLL Louisville Industrial Outlook - Q3 2019
JLL Louisville Industrial Outlook - Q3 2019Alex Westcott
 
JLL Louisville Industrial Outlook - Q1 2019
JLL Louisville Industrial Outlook - Q1 2019JLL Louisville Industrial Outlook - Q1 2019
JLL Louisville Industrial Outlook - Q1 2019Alex Westcott
 
JLL Louisville Industrial Outlook - Q1 2019
JLL Louisville Industrial Outlook - Q1 2019JLL Louisville Industrial Outlook - Q1 2019
JLL Louisville Industrial Outlook - Q1 2019Alex Westcott
 
Q2 2017: Columbus Industrial Trends 2017
Q2 2017: Columbus Industrial Trends 2017Q2 2017: Columbus Industrial Trends 2017
Q2 2017: Columbus Industrial Trends 2017Kyle Ghiloni
 
JLL Cleveland Industrial Outlook: Q4 2018
JLL Cleveland Industrial Outlook: Q4 2018JLL Cleveland Industrial Outlook: Q4 2018
JLL Cleveland Industrial Outlook: Q4 2018Andrew Batson
 
JLL Cleveland Industrial Outlook: Q4 2018
JLL Cleveland Industrial Outlook: Q4 2018JLL Cleveland Industrial Outlook: Q4 2018
JLL Cleveland Industrial Outlook: Q4 2018Andrew Batson
 

Similar to JLL Chicago Industrial Insights Q2 2016 (20)

Houston industrial report suite q1 2018
Houston industrial report suite q1 2018Houston industrial report suite q1 2018
Houston industrial report suite q1 2018
 
JLL Houston Industrial Report Q4
JLL Houston Industrial Report Q4JLL Houston Industrial Report Q4
JLL Houston Industrial Report Q4
 
JLL Q4 Houston Industrial Insight
JLL Q4 Houston Industrial InsightJLL Q4 Houston Industrial Insight
JLL Q4 Houston Industrial Insight
 
JLL Louisville Industrial Outlook - Q3 2019
JLL Louisville Industrial Outlook - Q3 2019JLL Louisville Industrial Outlook - Q3 2019
JLL Louisville Industrial Outlook - Q3 2019
 
JLL Columbus Industrial Outlook: Q3 2016
JLL Columbus Industrial Outlook: Q3 2016JLL Columbus Industrial Outlook: Q3 2016
JLL Columbus Industrial Outlook: Q3 2016
 
JLL Pittsburgh Industrial Insight & Statistics - Q4 2020
JLL Pittsburgh Industrial Insight & Statistics - Q4 2020JLL Pittsburgh Industrial Insight & Statistics - Q4 2020
JLL Pittsburgh Industrial Insight & Statistics - Q4 2020
 
Mid-Year Suburban Market Report
Mid-Year Suburban Market ReportMid-Year Suburban Market Report
Mid-Year Suburban Market Report
 
Last_Mile_Hines2017_Submission
Last_Mile_Hines2017_SubmissionLast_Mile_Hines2017_Submission
Last_Mile_Hines2017_Submission
 
JLL Louisville Industrial Outlook - Q2 2018
JLL Louisville Industrial Outlook - Q2 2018JLL Louisville Industrial Outlook - Q2 2018
JLL Louisville Industrial Outlook - Q2 2018
 
JLL Columbus Industrial Outlook: Q1 2017
JLL Columbus Industrial Outlook: Q1 2017JLL Columbus Industrial Outlook: Q1 2017
JLL Columbus Industrial Outlook: Q1 2017
 
2Q16 CBD Market Report
2Q16 CBD Market Report2Q16 CBD Market Report
2Q16 CBD Market Report
 
JLL Pittsburgh Industrial Insight & Statistics - Q3 2020
JLL Pittsburgh Industrial Insight & Statistics - Q3 2020JLL Pittsburgh Industrial Insight & Statistics - Q3 2020
JLL Pittsburgh Industrial Insight & Statistics - Q3 2020
 
Jll Louisville Industrial Outlook - Q1 2020
Jll Louisville Industrial Outlook - Q1 2020Jll Louisville Industrial Outlook - Q1 2020
Jll Louisville Industrial Outlook - Q1 2020
 
JLL Louisville Industrial Outlook - Q3 2019
JLL Louisville Industrial Outlook - Q3 2019JLL Louisville Industrial Outlook - Q3 2019
JLL Louisville Industrial Outlook - Q3 2019
 
JLL Louisville Industrial Outlook - Q3 2019
JLL Louisville Industrial Outlook - Q3 2019JLL Louisville Industrial Outlook - Q3 2019
JLL Louisville Industrial Outlook - Q3 2019
 
JLL Louisville Industrial Outlook - Q1 2019
JLL Louisville Industrial Outlook - Q1 2019JLL Louisville Industrial Outlook - Q1 2019
JLL Louisville Industrial Outlook - Q1 2019
 
JLL Louisville Industrial Outlook - Q1 2019
JLL Louisville Industrial Outlook - Q1 2019JLL Louisville Industrial Outlook - Q1 2019
JLL Louisville Industrial Outlook - Q1 2019
 
Q2 2017: Columbus Industrial Trends 2017
Q2 2017: Columbus Industrial Trends 2017Q2 2017: Columbus Industrial Trends 2017
Q2 2017: Columbus Industrial Trends 2017
 
JLL Cleveland Industrial Outlook: Q4 2018
JLL Cleveland Industrial Outlook: Q4 2018JLL Cleveland Industrial Outlook: Q4 2018
JLL Cleveland Industrial Outlook: Q4 2018
 
JLL Cleveland Industrial Outlook: Q4 2018
JLL Cleveland Industrial Outlook: Q4 2018JLL Cleveland Industrial Outlook: Q4 2018
JLL Cleveland Industrial Outlook: Q4 2018
 

Recently uploaded

Types and Sources of Mortgage Leads: What You Need to Know
Types and Sources of Mortgage Leads: What You Need to KnowTypes and Sources of Mortgage Leads: What You Need to Know
Types and Sources of Mortgage Leads: What You Need to KnowLead Generation Media
 
2BHK-3BHK NEW FLAT FOR SALE IN TUPUDANA,RANCHI.
2BHK-3BHK NEW FLAT FOR SALE IN TUPUDANA,RANCHI.2BHK-3BHK NEW FLAT FOR SALE IN TUPUDANA,RANCHI.
2BHK-3BHK NEW FLAT FOR SALE IN TUPUDANA,RANCHI.aashiyanastardevelop
 
Investing In The US As A Canadian… And How To Do It RIGHT!! (feat. Erwin Szet...
Investing In The US As A Canadian… And How To Do It RIGHT!! (feat. Erwin Szet...Investing In The US As A Canadian… And How To Do It RIGHT!! (feat. Erwin Szet...
Investing In The US As A Canadian… And How To Do It RIGHT!! (feat. Erwin Szet...Volition Properties
 
Oeiras Tech City, Developed by RE Capital and REIG, Will Become Lisbon's Futu...
Oeiras Tech City, Developed by RE Capital and REIG, Will Become Lisbon's Futu...Oeiras Tech City, Developed by RE Capital and REIG, Will Become Lisbon's Futu...
Oeiras Tech City, Developed by RE Capital and REIG, Will Become Lisbon's Futu...Newman George Leech
 
Listing Turkey - Sinpaş Queen Bomonti Katalog
Listing Turkey - Sinpaş Queen Bomonti KatalogListing Turkey - Sinpaş Queen Bomonti Katalog
Listing Turkey - Sinpaş Queen Bomonti KatalogListing Turkey
 
Optimizing Your MCA Lead Capture Process for Better Results
Optimizing Your MCA Lead Capture Process for Better ResultsOptimizing Your MCA Lead Capture Process for Better Results
Optimizing Your MCA Lead Capture Process for Better ResultsLead Generation Media
 
Top 10 International Schools in Bangalore
Top 10 International Schools in BangaloreTop 10 International Schools in Bangalore
Top 10 International Schools in BangaloreTharaniDowluru
 
One FNG by Group 108 Sector 142 Noida Construction Update
One FNG by Group 108 Sector 142 Noida Construction UpdateOne FNG by Group 108 Sector 142 Noida Construction Update
One FNG by Group 108 Sector 142 Noida Construction UpdateOne FNG
 
Avrupa Konutlari Yenimahalle - Listing Turkey
Avrupa Konutlari Yenimahalle - Listing TurkeyAvrupa Konutlari Yenimahalle - Listing Turkey
Avrupa Konutlari Yenimahalle - Listing TurkeyListing Turkey
 
Killer Referans Bahcesehir Catalog Listing Turkey
Killer Referans Bahcesehir Catalog Listing TurkeyKiller Referans Bahcesehir Catalog Listing Turkey
Killer Referans Bahcesehir Catalog Listing TurkeyListing Turkey
 
Urbanrise Paradise on Earth - Unveiling Unprecedented Luxury in Exquisite Vil...
Urbanrise Paradise on Earth - Unveiling Unprecedented Luxury in Exquisite Vil...Urbanrise Paradise on Earth - Unveiling Unprecedented Luxury in Exquisite Vil...
Urbanrise Paradise on Earth - Unveiling Unprecedented Luxury in Exquisite Vil...JagadishKR1
 
Sefakoy Sinpas Boulevard Istanbul - Presentation
Sefakoy Sinpas Boulevard Istanbul - PresentationSefakoy Sinpas Boulevard Istanbul - Presentation
Sefakoy Sinpas Boulevard Istanbul - PresentationListing Turkey
 
MC Heights-Best Construction Company in jhang
MC Heights-Best Construction Company in jhangMC Heights-Best Construction Company in jhang
MC Heights-Best Construction Company in jhanglaraibfatim009
 
How to Scan Tenants in NYC - You Should Know!
How to Scan Tenants in NYC - You Should Know!How to Scan Tenants in NYC - You Should Know!
How to Scan Tenants in NYC - You Should Know!BelgiumManagement
 
Torun Center Residences Istanbul - Listing Turkey
Torun Center Residences Istanbul - Listing TurkeyTorun Center Residences Istanbul - Listing Turkey
Torun Center Residences Istanbul - Listing TurkeyListing Turkey
 
Sinpas Gokorman Presentation. - Listing Turkey
Sinpas Gokorman Presentation. - Listing TurkeySinpas Gokorman Presentation. - Listing Turkey
Sinpas Gokorman Presentation. - Listing TurkeyListing Turkey
 
What is BDA? Understanding the Bangalore Development Authority
What is BDA? Understanding the Bangalore Development AuthorityWhat is BDA? Understanding the Bangalore Development Authority
What is BDA? Understanding the Bangalore Development Authoritydemocontentcheck
 

Recently uploaded (17)

Types and Sources of Mortgage Leads: What You Need to Know
Types and Sources of Mortgage Leads: What You Need to KnowTypes and Sources of Mortgage Leads: What You Need to Know
Types and Sources of Mortgage Leads: What You Need to Know
 
2BHK-3BHK NEW FLAT FOR SALE IN TUPUDANA,RANCHI.
2BHK-3BHK NEW FLAT FOR SALE IN TUPUDANA,RANCHI.2BHK-3BHK NEW FLAT FOR SALE IN TUPUDANA,RANCHI.
2BHK-3BHK NEW FLAT FOR SALE IN TUPUDANA,RANCHI.
 
Investing In The US As A Canadian… And How To Do It RIGHT!! (feat. Erwin Szet...
Investing In The US As A Canadian… And How To Do It RIGHT!! (feat. Erwin Szet...Investing In The US As A Canadian… And How To Do It RIGHT!! (feat. Erwin Szet...
Investing In The US As A Canadian… And How To Do It RIGHT!! (feat. Erwin Szet...
 
Oeiras Tech City, Developed by RE Capital and REIG, Will Become Lisbon's Futu...
Oeiras Tech City, Developed by RE Capital and REIG, Will Become Lisbon's Futu...Oeiras Tech City, Developed by RE Capital and REIG, Will Become Lisbon's Futu...
Oeiras Tech City, Developed by RE Capital and REIG, Will Become Lisbon's Futu...
 
Listing Turkey - Sinpaş Queen Bomonti Katalog
Listing Turkey - Sinpaş Queen Bomonti KatalogListing Turkey - Sinpaş Queen Bomonti Katalog
Listing Turkey - Sinpaş Queen Bomonti Katalog
 
Optimizing Your MCA Lead Capture Process for Better Results
Optimizing Your MCA Lead Capture Process for Better ResultsOptimizing Your MCA Lead Capture Process for Better Results
Optimizing Your MCA Lead Capture Process for Better Results
 
Top 10 International Schools in Bangalore
Top 10 International Schools in BangaloreTop 10 International Schools in Bangalore
Top 10 International Schools in Bangalore
 
One FNG by Group 108 Sector 142 Noida Construction Update
One FNG by Group 108 Sector 142 Noida Construction UpdateOne FNG by Group 108 Sector 142 Noida Construction Update
One FNG by Group 108 Sector 142 Noida Construction Update
 
Avrupa Konutlari Yenimahalle - Listing Turkey
Avrupa Konutlari Yenimahalle - Listing TurkeyAvrupa Konutlari Yenimahalle - Listing Turkey
Avrupa Konutlari Yenimahalle - Listing Turkey
 
Killer Referans Bahcesehir Catalog Listing Turkey
Killer Referans Bahcesehir Catalog Listing TurkeyKiller Referans Bahcesehir Catalog Listing Turkey
Killer Referans Bahcesehir Catalog Listing Turkey
 
Urbanrise Paradise on Earth - Unveiling Unprecedented Luxury in Exquisite Vil...
Urbanrise Paradise on Earth - Unveiling Unprecedented Luxury in Exquisite Vil...Urbanrise Paradise on Earth - Unveiling Unprecedented Luxury in Exquisite Vil...
Urbanrise Paradise on Earth - Unveiling Unprecedented Luxury in Exquisite Vil...
 
Sefakoy Sinpas Boulevard Istanbul - Presentation
Sefakoy Sinpas Boulevard Istanbul - PresentationSefakoy Sinpas Boulevard Istanbul - Presentation
Sefakoy Sinpas Boulevard Istanbul - Presentation
 
MC Heights-Best Construction Company in jhang
MC Heights-Best Construction Company in jhangMC Heights-Best Construction Company in jhang
MC Heights-Best Construction Company in jhang
 
How to Scan Tenants in NYC - You Should Know!
How to Scan Tenants in NYC - You Should Know!How to Scan Tenants in NYC - You Should Know!
How to Scan Tenants in NYC - You Should Know!
 
Torun Center Residences Istanbul - Listing Turkey
Torun Center Residences Istanbul - Listing TurkeyTorun Center Residences Istanbul - Listing Turkey
Torun Center Residences Istanbul - Listing Turkey
 
Sinpas Gokorman Presentation. - Listing Turkey
Sinpas Gokorman Presentation. - Listing TurkeySinpas Gokorman Presentation. - Listing Turkey
Sinpas Gokorman Presentation. - Listing Turkey
 
What is BDA? Understanding the Bangalore Development Authority
What is BDA? Understanding the Bangalore Development AuthorityWhat is BDA? Understanding the Bangalore Development Authority
What is BDA? Understanding the Bangalore Development Authority
 

JLL Chicago Industrial Insights Q2 2016

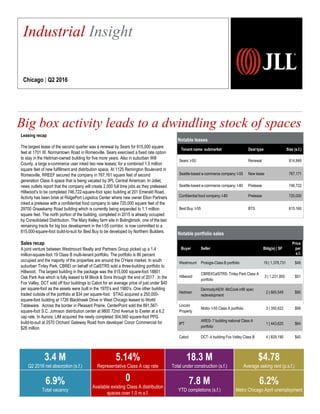
  • 1. Notable leases Notable portfolio sales Buyer Seller Bldg(s) | SF Price per s.f. Westmount Prologis-Class B portfolio 19 | 1,378,731 $49 Hillwood CBREI/CalSTRS- Tinley Park Class A portfolio 3 | 1,231,950 $51 Heitman Dermody/AEW -McCook infill spec redevelopment 2 | 665,549 $90 Lincoln Property Molto- I-55 Class A portfolio 3 | 350,622 $99 IPT ARES- 7 building national Class A portfolio 1 | 443,620 $64 Cabot DCT- 4 building Fox Valley Class B 4 | 829,190 $40 Big box activity leads to a dwindling stock of spaces Industrial Insight Chicago | Q2 2016 3.4 M Q2 2016 net absorption (s.f.) 5.14% Representative Class A cap rate 18.3 M Total under construction (s.f.) $4.78 Average asking rent (p.s.f.) 6.9% Total vacancy 0 Available existing Class A distribution spaces over 1.0 m.s.f. 7.8 M YTD completions (s.f.) 6.2% Metro Chicago April unemployment Tenant name: submarket Deal type Size (s.f.) Sears: I-55 Renewal 814,848 Seattle-based e-commerce company: I-55 New lease 767,171 Seattle-based e-commerce company: I-80 Prelease 746,722 Confidential food company: I-80 Prelease 720,000 Best Buy: I-55 BTS 615,160 Leasing recap The largest lease of the second quarter was a renewal by Sears for 815,000 square feet at 1701 W. Normantown Road in Romeoville. Sears exercised a fixed rate option to stay in the Heitman-owned building for five more years. Also in suburban Will County, a large e-commerce user inked two new leases; for a combined 1.5 million square feet of new fulfillment and distribution space. At 1125 Remington Boulevard in Romeoville, RREEF secured the company in 767,161 square feet of second generation Class A space that is being vacated by 3PL Central American. In Joliet, news outlets report that the company will create 2,000 full time jobs as they preleased Hillwood’s to be completed 746,722-square-foot spec building at 201 Emerald Road. Activity has been brisk at RidgePort Logistics Center where new owner Elion Partners inked a prelease with a confidential food company to take 720,000 square feet of the 29700 Graaskamp Road building which is currently being expanded to 1.1 million square feet. The north portion of the building, completed in 2015 is already occupied by Consolidated Distribution. The Mary Kelley farm site in Bolingbrook, one of the last remaining tracts for big box development in the I-55 corridor, is now committed to a 615,000-square-foot build-to-suit for Best Buy to be developed by Northern Builders. Sales recap A joint venture between Westmount Realty and Partners Group picked up a 1.4 million-square-foot 19 Class B multi-tenant portfolio. The portfolio is 86 percent occupied and the majority of the properties are around the O’Hare market. In south suburban Tinley Park, CBREI on behalf of CalSTRS sold a three-building portfolio to Hillwood. The largest building in the package was the 915,000 square-foot 18801 Oak Park Ave which is fully leased to M Block & Sons through the end of 2017. In the Fox Valley, DCT sold off four buildings to Cabot for an average price of just under $40 per square-foot as the assets were built in the 1970’s and 1980’s. One other building traded outside of the portfolio at $34 per square-foot. STAG acquired a 250,000- square-foot building at 1726 Blackhawk Drive in West Chicago leased to World Tableware. Across the border in Pleasant Prairie, CenterPoint sold the 891,567- square-foot S.C. Johnson distribution center at 9800 72nd Avenue to Exeter at a 6.2 cap rate. In Aurora, LIM acquired the newly completed 304,560 square-foot PPG build-to-suit at 2570 Orchard Gateway Road from developer Conor Commercial for $28 million.
  • 2. Notable land trades- Transportation advantaged sites: Big Box exurban and infill In Joliet, CBREI and First Industrial exited its position on a 262-acre site in between Route 6 and the Des Plaines River this spring with a $4.4 million sale to Ketone Partners. A local developer is under contract on 75 acres on the upland portion of the site with drawings for a million square-foot building. Ketone also plans to develop a 175,000- square-foot, rear-load building on a pad fronting Route 6. There is hope that state and local leaders will move forward with the Houbolt Road Bridge spanning the river on the east portion of the site which will alleviate the heavy truck traffic at the nation’s largest inland port at the nearby UP and BNSF intermodals. In Niles, MFRI sold an obsolete manufacturing facility at 7720 N Lehigh in infill North Cook County, to Molto Properties for just under $11 per land square foot in May. Molto will clear the 8.2-acre parcel and start construction on a 136,000-square-foot speculative building this year. Florida-based Elion Partners acquired 1,100 acres of land making up the RidgePort Logistics Center in Wilmington. The seller was a partnership of Ridge Development and Prudential and Ridge will continue to be involved in future development of the BNSF rail served park. The sale price was $55 million and the site has the potential to accommodate up to 12 million square feet of new product. Midwest Industrial Funds sold a 9.3-acre redevelopment site located at 8500 W. 68th Street in Bedford Park to Penske Truck Leasing for $3.3 million. Midwest Industrial acquired the site in 2014 and had completed design and engineering work fleet maintenance structure with heavy trailer parking. This site is in close proximity to both the CSX intermodal and numerous other trucking and logistics users clustered along the Stevenson Expressway and I-294. Historical absorption and vacancy Average total asking rent ($ p.s.f.) O’Hare Class A large block availabilities: Existing & under const. ©2016 Jones Lang LaSalle IP, Inc. All rights reserved.For more information, contact: Christian Beaudoin | christian.beaudoin@am.jll.com George Cutro | george.cutro@am.jll.com Chad Buch | chad.buch@am.jll.com Paul Marsh | paul.marsh@am.jll.com $4.44 $4.13 $4.12 $4.12 $4.27 $4.35 $4.74 $4.78 $2.00 $3.00 $4.00 $5.00 2009 2010 2011 2012 2013 2014 2015 2Q 2016 0.0% 3.0% 6.0% 9.0% 12.0% 15.0% -10,000,000 0 10,000,000 20,000,000 2010 2011 2012 2013 2014 2015 YTD 2016 Net absorption Total vacancy 9234 Belmont Ave, 179,164 2801 S Busse Rd, 171,548 555 Northwest Ave, 588,233 1800 Nicholas Blvd, 131,728 3710-3720 River Rd, 90,555 855 N Wood Dale, 231,679 3801 Rose St, 102,020 11501 W Irving Park Rd, 88,060 UC- 3400 Wolf Rd, 491,089 UC- 11333 Addison St, 194,260 251 Wille Rd, 77,450 UC- 3801 Centrella St, 367,389 UC-11600 W Grand Ave, 182,923 371-377 Meyer Rd, 67,320 200K SF+ Big Box 100K-200K SF 50K-100K SF
  • 3. Industrial Statistics Chicago | Q2 2016 Inventory (s.f.) Quarterly total net absorption (s.f.) YTD total net absorption (s.f.) YTD total net absorption (% of stock) Total vacancy (%) Total availability (%) Average total asking rent ($ p.s.f.) Quarterly completions (s.f.) YTD completions (s.f.) Under construction (s.f.) Lake County Warehouse / Distribution 35,945,949 -39,855 250,519 0.7% 13.0% 14.6% $5.49 646,848 716,848 400,758 Manufacturing 31,234,667 75,233 -85,400 -0.3% 6.2% 7.2% $5.63 0 0 0 General 93,277 40,165 40,165 43.1% 0.0% 0.0% $0.00 40,165 40,165 20,000 Total industrial 67,273,893 75,543 205,284 0.3% 9.8% 11.2% $5.52 687,013 757,013 420,758 North Cook County Warehouse / Distribution 15,492,706 -43,309 88,289 0.6% 7.1% 8.5% $5.65 0 217,280 0 Manufacturing 32,750,865 -92,349 91,181 0.3% 5.2% 7.0% $5.52 0 0 0 General 73,274 0 0 0.0% 0.0% 0.0% $0.00 0 0 0 Total industrial 48,316,845 -135,658 179,470 0.4% 5.8% 7.5% $5.59 0 217,280 0 Northwest Cook County Warehouse / Distribution 13,244,377 59,662 10,911 0.1% 10.2% 11.5% $5.02 0 423,672 0 Manufacturing 13,134,247 205,816 141,327 1.1% 9.0% 9.2% $4.72 0 0 0 General 80,592 0 0 0.0% 0.0% 0.0% $0.00 0 0 0 Total industrial 26,459,216 265,478 152,238 0.6% 9.6% 10.3% $4.87 0 423,672 0 O'Hare Warehouse / Distribution 55,703,656 -721,496 182,130 0.3% 6.2% 9.1% $5.93 0 0 440,000 Manufacturing 37,863,339 126,390 -111,515 -0.3% 5.6% 7.2% $5.41 0 0 0 General 29,015 0 0 0.0% 0.0% 0.0% $0.00 0 0 0 Total industrial 93,596,010 -595,106 70,615 0.1% 5.9% 8.4% $5.76 0 0 440,000 West Cook County Warehouse / Distribution 42,848,916 -218,891 -285,567 -0.7% 14.1% 15.9% $5.21 0 0 1,518,784 Manufacturing 50,017,590 -757,844 -638,099 -1.3% 6.1% 7.3% $5.13 0 0 0 General 24,600 0 0 0.0% 0.0% 0.0% $0.00 0 0 0 Total industrial 92,891,106 -976,735 -923,666 -1.0% 9.8% 11.3% $5.20 0 0 1,518,784 North Chicago Warehouse / Distribution 18,701,998 -453,218 -521,868 -2.8% 6.3% 6.6% $10.71 0 0 40,700 Manufacturing 41,119,098 356,296 264,115 0.6% 6.1% 6.9% $7.43 0 0 0 General 25,000 0 0 0.0% 0.0% 0.0% $0.00 0 0 0 Total industrial 59,846,096 -96,922 -257,753 -0.4% 6.2% 6.8% $8.61 0 0 40,700 South Chicago Warehouse / Distribution 34,628,291 164,926 273,481 0.8% 6.7% 7.5% $6.43 41,298 261,156 227,043 Manufacturing 61,144,678 217,037 69,456 0.1% 6.7% 8.2% $5.82 0 0 196,000 General 103,790 0 0 0.0% 0.0% 0.0% $0.00 0 0 0 Total industrial 95,876,759 381,963 342,937 0.4% 6.7% 7.9% $6.04 41,298 261,156 423,043 George Cutro - Director, Industrial Research 8755 W Higgins Rd Suite 750 Chicago, IL 60631 tel +1 773 458 1433 george.cutro@am.jll.com 2016 Jones Lang LaSalle IP, Inc. All rights reserved.
  • 4. Chicago | Q2 2016 Inventory (s.f.) Quarterly total net absorption (s.f.) YTD total net absorption (s.f.) YTD total net absorption (% of stock) Total vacancy (%) Total availability (%) Average total asking rent ($ p.s.f.) Quarterly completions (s.f.) YTD completions (s.f.) Under construction (s.f.) South Suburbs Warehouse / Distribution 40,186,428 754,770 498,622 1.2% 6.7% 9.2% $3.97 0 0 0 Manufacturing 43,314,506 221,011 107,237 0.2% 6.6% 7.4% $6.09 33,000 33,000 0 General 1,167,630 0 0 0.0% 0.0% 0.0% $0.00 0 0 0 Total industrial 84,668,564 975,781 605,859 0.7% 6.5% 8.2% $4.40 33,000 33,000 0 I-57 Corridor Warehouse / Distribution 20,667,475 -96,017 3,171 0.0% 8.8% 8.8% $3.79 0 0 0 Manufacturing 9,454,414 -17,911 -15,464 -0.2% 3.6% 3.6% $6.25 0 0 185,000 General 275,905 28,405 28,405 10.3% 55.3% 55.3% $0.00 0 0 0 Total industrial 30,397,794 -85,523 16,112 0.1% 7.6% 7.6% $3.81 0 0 185,000 I-80 Corridor Warehouse / Distribution 57,984,028 2,648,977 3,898,134 6.7% 5.0% 5.9% $4.21 1,618,575 1,958,509 6,406,401 Manufacturing 15,821,275 92,038 73,371 0.5% 5.4% 5.4% $7.42 0 0 202,812 General 135,070 0 0 0.0% 0.0% 0.0% $0.00 0 0 0 Total industrial 73,940,373 2,741,015 3,971,505 5.4% 5.1% 5.8% $4.33 1,618,575 1,958,509 6,609,213 I-55 Corridor Warehouse / Distribution 68,230,815 279,245 1,003,565 1.5% 5.8% 8.5% $5.09 89,887 504,143 2,784,273 Manufacturing 12,277,888 241,560 414,352 3.4% 2.6% 7.2% $6.35 0 0 0 General 54,200 0 0 0.0% 26.2% 26.2% $0.00 0 0 0 Total industrial 80,562,903 520,805 1,417,917 1.8% 5.3% 8.3% $5.18 89,887 504,143 2,784,273 I-88 Corridor Warehouse / Distribution 37,074,672 1,408,932 1,420,175 3.8% 4.9% 8.1% $4.40 1,078,846 1,223,846 1,472,425 Manufacturing 22,651,181 -119,751 5,017 0.0% 4.9% 6.0% $4.97 0 0 43,000 General 124,340 0 0 0.0% 0.0% 0.0% $0.00 0 0 0 Total industrial 59,850,193 1,289,181 1,425,192 2.4% 4.9% 7.3% $4.50 1,078,846 1,223,846 1,515,425 North DuPage County Warehouse / Distribution 46,154,822 -865,091 -667,001 -1.4% 6.4% 9.4% $5.05 0 89,000 1,451,044 Manufacturing 33,285,673 95,634 108,477 0.3% 3.8% 5.9% $6.07 0 0 0 General 12,690 0 0 0.0% 0.0% 0.0% $0.00 0 0 0 Total industrial 79,453,185 -769,457 -558,524 -0.7% 5.3% 8.0% $5.27 0 89,000 1,451,044 Fox Valley Warehouse / Distribution 18,049,021 -474,953 -712,147 -3.9% 7.4% 10.5% $4.05 0 0 0 Manufacturing 17,446,771 -69,409 186,419 1.1% 3.0% 3.3% $5.04 0 299,520 430,696 General 0 0 0 0.0% 0.0% 0.0% $0.00 0 0 0 Total industrial 35,495,792 -544,362 -525,728 -1.5% 5.3% 6.9% $4.25 0 299,520 430,696 North Kane County Warehouse / Distribution 15,250,346 -116,302 -140,674 -0.9% 14.9% 15.9% $5.02 0 82,922 1,109,143 Manufacturing 14,850,953 -30,542 142,228 1.0% 4.4% 4.4% $4.73 0 0 156,400 General 13,200 0 0 0.0% 0.0% 0.0% $0.00 0 0 0 Total industrial 30,114,499 -146,844 1,554 0.0% 9.7% 10.2% $4.95 0 82,922 1,265,543 8755 W Higgins Rd Suite 750 Chicago, IL 60631 tel +1 773 458 1433 george.cutro@am.jll.com 2016 Jones Lang LaSalle IP, Inc. All rights reserved. George Cutro - Director, Industrial Research
  • 5. Chicago | Q2 2016 Inventory (s.f.) Quarterly total net absorption (s.f.) YTD total net absorption (s.f.) YTD total net absorption (% of stock) Total vacancy (%) Total availability (%) Average total asking rent ($ p.s.f.) Quarterly completions (s.f.) YTD completions (s.f.) Under construction (s.f.) McHenry County Warehouse / Distribution 10,630,867 55,711 -11,893 -0.1% 1.8% 4.3% $4.63 0 0 0 Manufacturing 18,858,696 -71,637 150,769 0.8% 19.2% 19.6% $3.58 0 0 0 General 0 0 0 0.0% 0.0% 0.0% $0.00 0 0 0 Total industrial 29,489,563 -15,926 138,876 0.5% 12.9% 14.0% $3.71 0 0 0 Rockford Warehouse / Distribution 10,320,576 -9,920 48,696 0.5% 8.4% 12.1% $3.24 0 0 0 Manufacturing 13,617,911 -58,941 -74,343 -0.5% 12.2% 12.4% $3.36 0 0 0 General 0 0 0 0.0% 0.0% 0.0% $0.00 0 0 0 Total industrial 23,938,487 -68,861 -25,647 -0.1% 10.6% 12.3% $3.33 0 0 0 I-39 Corridor Warehouse / Distribution 13,716,499 50,867 28,267 0.2% 5.5% 7.7% $3.92 0 0 978,120 Manufacturing 18,166,489 4,270 229,140 1.3% 5.1% 7.2% $3.03 0 210,000 0 General 34,450 0 0 0.0% 0.0% 0.0% $0.00 0 0 0 Total industrial 31,917,438 55,137 257,407 0.8% 5.3% 7.4% $3.35 0 210,000 978,120 Northwest Indiana Warehouse / Distribution 9,544,984 297,840 259,936 2.7% 11.3% 12.1% $3.93 159,813 159,813 38,121 Manufacturing 21,249,968 362,048 377,048 1.8% 8.1% 8.9% $3.24 300,000 300,000 0 General 0 0 0 0.0% 0.0% 0.0% $0.00 0 0 0 Total industrial 30,794,952 659,888 636,984 2.1% 9.1% 9.9% $3.54 459,813 459,813 38,121 Southeast Wisconsin Warehouse / Distribution 28,545,291 -121,202 -570,851 -2.0% 7.6% 8.7% $4.60 601,491 683,391 200,696 Manufacturing 24,546,010 30,265 746,850 3.0% 2.8% 4.1% $3.29 0 629,585 0 General 43,624 0 0 0.0% 0.0% 0.0% $0.00 0 0 0 Total industrial 53,134,925 -90,937 175,999 0.3% 5.4% 6.5% $4.41 601,491 1,312,976 200,696 Warehouse & Distribution 592,921,717 2,560,676 5,055,895 0.9% 7.6% 9.6% $4.88 4,236,758 6,320,580 17,067,508 Manufacturing 532,806,219 809,214 2,182,166 0.4% 6.2% 7.4% $4.55 333,000 1,472,105 1,213,908 General 2,290,657 68,570 68,570 3.0% 7.3% 7.3% $0.00 40,165 40,165 20,000 Totals 1,128,018,593 3,438,460 7,306,631 0.6% 6.9% 8.5% $4.78 4,609,923 7,832,850 18,301,416 George Cutro - Director, Industrial Research 8755 W Higgins Rd Suite 750 Chicago, IL 60631 tel +1 773 458 1433 george.cutro@am.jll.com 2016 Jones Lang LaSalle IP, Inc. All rights reserved.