Downloaded 41 times


![9. Literature Review
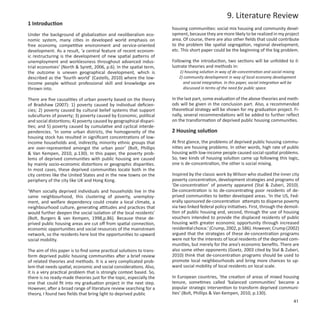
On the regional level, ‘the challenge is to extend the market area
beyond the local arena, or to focus on people who will bring
money into the area (tourists)’ (Marais & Botes, 2007, p.391).
For example, industry area disappeared or decayed in some de-
veloped areas, tourism might become a new development po-
tential if it has good natural or cultural resources, and this will
bring new opportunities to local residents, especially for peo-
ple without professional skills and knowledge to work in other
areas. The important thing here is to reveal the potentials on
regional scale and surrounding areas that could make direct con-
nections to the resident of deprived communities. This could be
implemented by both big projects and small interventions.
3.2 Social integration by Public space
If local economy development could improve the living condi-
tion of low-income groups by material revenue, then social inte-
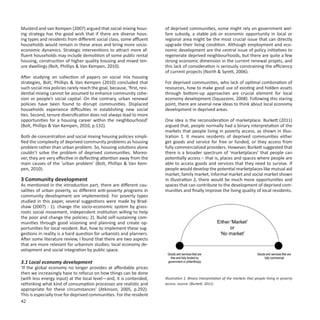
Illustration 2. A more complex understanding of the many different ‘marketplac- gration will improve the quality of their social life through more
es’ with which people living in poverty engage. source: (Burkett, 2011) communication and connection to the outside world.
The sencond idea is to develop local economy on different spatial In the project called ‘promoting the mobilization of low-income
levels. North & Syrett (2006) noted that it is the central concern people to reduce and eliminate poverty’ in Canadian cities, sev-
to effectively linked deprived areas into the process of economic eral recommendations were listed. The first recommendation
growth, that the interventions should best operate on different is to ‘Provide opportunities and spaces for people living in pov-
spatial levels. erty to come together, and name, explore, and address issues’.
Shared community spaces are strongly needed from the partici-
On the neighbourhood level, although economic initiatives are pants. This includes a range of physical spaces: gathering places,
not able to create large scale employment opportunities, how- artistic places or ‘cultural sanctuaries’, recreation places (includ-
ever, some bottom-up initiatives could develop local capacities, ing lower priced recreation centres, access to local schools in
encourage mutual aid and self-help on community and individ- summer, and bike lanes), green space and community gardens
ual scale, and finally promote the quality of quality of everyday (with sheds and bathrooms), and places for children (Ravensber-
life, social inclusion and political participation (North & Syrett, gen & VanderPlaat, 2009, p.398).
2006).
Public space in deprived communities could contribute to the
‘The poor people are experts in making the most of scarce re- regeneration of deprived communities in several terms, like the
sources under adverse circumstances, and have always used in- space for social communication, the space for local economy
stitutions of mutual support and risk- sharing in order to do so development, and the space for leisure activities with nice land-
[...] Self-help approaches can and should be part of strategies scape.
to tackle exploitation and marginalization … to accessible public
services and the redistribution of income and wealth’ (Berner ‘As Jacobs (1961) long ago emphasized, specific physical char-
& Phillips, 2005,p.19, 27). The failure of some top-down inter- acteristics of streets and land uses (e.g. relatively dense, mixed
ventions by the government might because the real need of use spaces) can bring together people engaged in a diversity of
local poor residents is never the first priority but behind other activities at all hours of the day and night. This, in turn, creates a
socio-economic interests. However, self-help will not be realized safe and pleasurable environment, which functions, on the one
by their own because community is neither ‘havens of coopera- hand, to reproduce existing social relations and facilitate com-
tion’ nor ‘homogeneous’ group (Berner & Phillips, 2005, p.27) munity bonding and, on the other hand, to create the conditions
but a complicated urban area. So, the guide and suggestions to support local economic activity. As such, the economic poten-
from both public sector and private sector, like the government, tial of public space is entwined with and may even be dependent
NGOs, and independent organizations, would help to realize on social and environmental features’ (Grodach, 2009, p.477).
self-help programs.
43](https://image.slidesharecdn.com/p1-111112081836-phpapp02/85/Jing-Feng-P2-report-Complex-Cities-Studio-2011-47-320.jpg)
![‘When public spaces are successful [...] they will increase op- Housing solutions, evolved from sociology studies, derived from
portunities to participate in communal activity. This fellowship de-concentration of poverty in the United States to social mix
in the open nurtures the growth of public life, which is stunted housing strategies in Europe. Till now, it is still a popular devel-
by the social isolation of ghettos and suburbs. In the parks, pla- opment strategy in urban regeneration project. There seems
zas, markets, waterfronts, and natural areas of our cities, people no doubt in the research field that social mix is the right goal
from different cultural groups can come together in a supportive to achieve. Social mix means communities built up with public
context of mutual enjoyment. As these experiences are repeat- housing at a proper rate and residents with different socio-eco-
ed, public spaces become vessels to carry positive communal nomic background and ethnics. Indeed, social mix could bring
meanings’ (Carr, Francis, Rivlin & Stone, 1993, p. 344). more diversity and dynamic to the neighbourhoods. But, will so-
cial mix solve the basic living problems of poor residents who are
So, if the public space in deprived communities can develop into eager to find a job and find someone to talk in the time of eco-
a place with lively social and economic activities. It will greatly nomic recession? As mentioned above, to some extent, housing
improve the living environment of the whole area and even be- solutions are deflecting attention away from the main causes of
came a precious value to attract other people. Finally, it could the ‘urban problem’. Generally speaking, housing solutions are
promote the social integration of deprived communities into top-down projects on a higher level and the aim is not to help
larger urban area. the real poor. So, some other strategies should concentrate help
the poor residents on a lower level. For example, urban strategy
4 Conclusions could be community development.
Transforming deprived public housing community is a complicat-
ed and practical issue. It needs varieties of research disciplines Kotval (2006, p.87) argues that the goal of community planning
and studying fields both in theory and practice. So, it is impor- is to ‘create a better physical, social and economic environment
tant to realize that the problems will not be solved by a solution for communities and the people that invest their social and eco-
within one studying field, but need interdisciplinary coopera- nomic capital in a place’. There are many ways for community
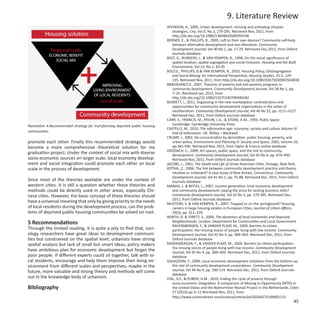
tion. As illustrated in this short paper, after a limited literature development, and two aspects are more relevant for urbanism
review, the theory of housing solution and community develop- studies: local economy development and social integration by
ment might bring light to the transformation of deprived public public space. Several new ideas in local economy development
housing communities. Illustration 3 shows the basic finding of brought new light to deprived communities. First, the broader
this paper. It will be illustrated in the next paragraph. definition of market place, including mutual aid market, informal
market, social market, would bring more life chances to poor
residents who need cheap consumption. Second, different levels
of spatial interventions should coordinate to achieve economic
development. On the neighbourhood level, bottom-up initia-
tives, like self help programs, would not only create employment
and additional sources of income, but also build social networks,
local participation and cooperation, and develop community
and individual capacities. On the regional level, links to regional
context should be built up. For example, attracting people who
will bring money to the area, like tourists.
For many socially segregated residents of deprived communi-
ties, social integration will improve the quality of their social life
through more communication and connection to the outside
world. This could happened in public space, where enables lively
social and economic activities.
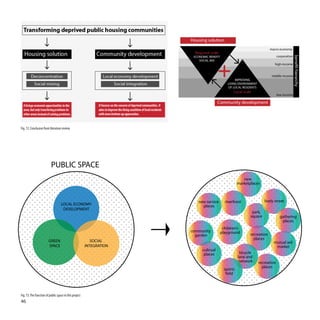
Illustration 4 shows the recommendation strategy for transform-
Illustration 3. Theories and methods of Transforming deprived public housing ing deprived public housing communities: the combination of
communities illustrated in the paper. housing solution by more top-down approaches on larger scale
and community development by more bottom-up approaches
on local scale. These two methods should compensate and
44](https://image.slidesharecdn.com/p1-111112081836-phpapp02/85/Jing-Feng-P2-report-Complex-Cities-Studio-2011-48-320.jpg)


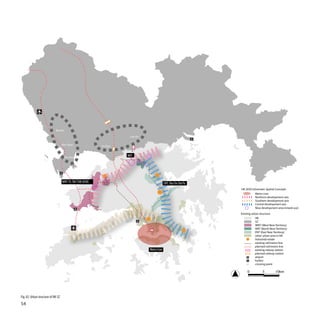


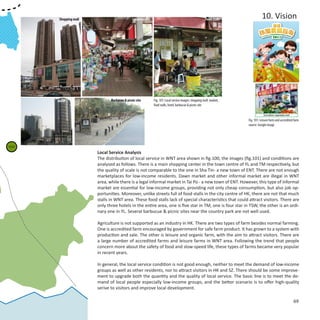


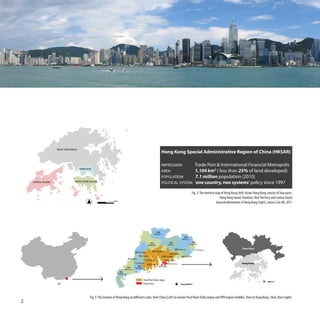
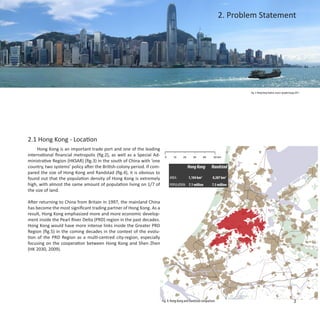
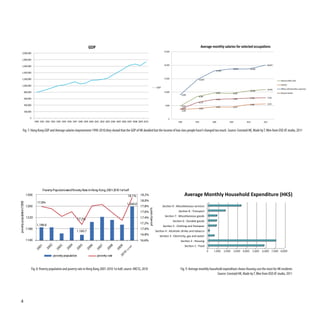
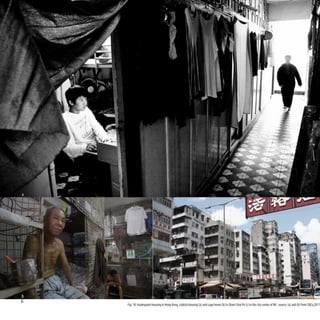
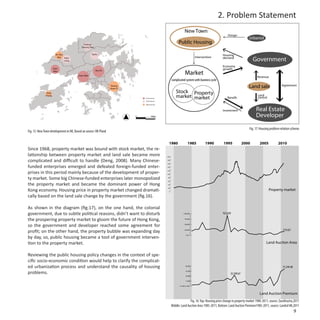
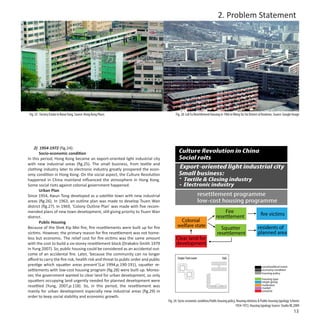
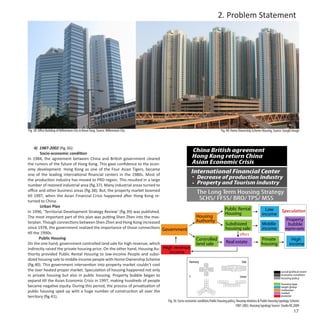
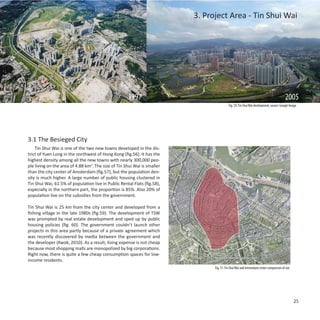
The document discusses Hong Kong's housing problem and its causes. It notes that while Hong Kong has a very strong economy, there are also high levels of inequality. The GDP has doubled in recent decades but incomes for low-income workers have not increased much. Housing costs are a huge burden for many residents, with over 1 million people living in poverty and 100,000 households living in inadequate housing like cage homes. The housing problem is a result of the interplay between the government, property market, developers, and changing economic conditions over time. The document examines Hong Kong's land use and the relationship between land sales and the property market to help understand the current housing crisis.


