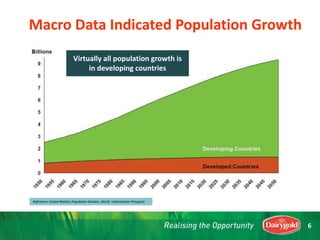
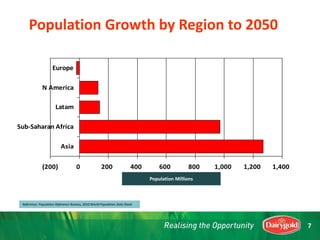
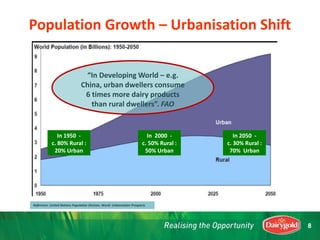
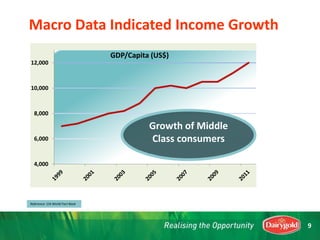
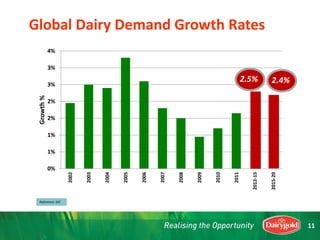
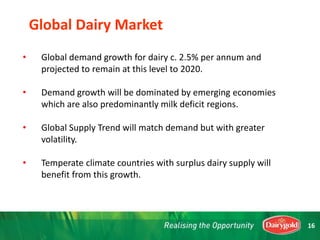
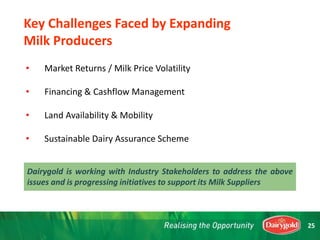
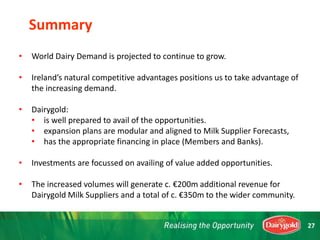
1) The global dairy market is projected to experience continued demand growth of around 2.5% annually due to increasing populations, urbanization, and rising incomes in developing countries. This will outpace global milk supply growth.
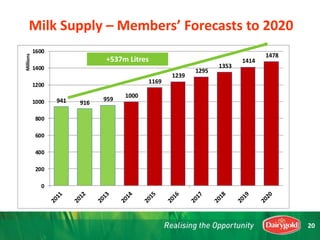
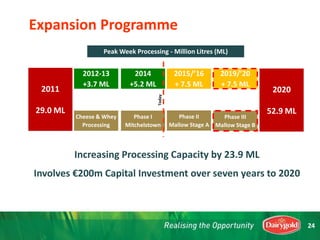
2) Dairygold is well positioned to take advantage of opportunities in this growing global market by sourcing milk locally from its cooperative members and supplying dairy products globally. It plans to increase its processing capacity and milk volume handled by over 23 million liters by 2020 through strategic expansion projects.
3) The increased volumes are expected to generate an additional €200 million in revenue for Dairygold milk suppliers and €350 million for the wider community, realizing opportunities for growth in a sustainable manner.