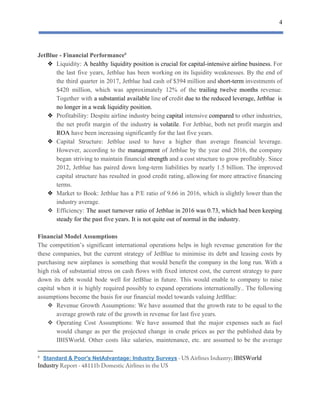
JetBlue 
Corporate​ ​Financial​ ​Modeling​ ​Project
By:​ ​Michelle​ ​Liu,​ ​Varun​ ​Gupta​ ​and​ ​Yiyao​ ​Zhou


1
 
Industry​ ​Overview​ ​-​ ​Aviation
The global GDP has been estimated to strengthen to 2.7 percent in 2017 in the wake of rising1
economic activity and global financing conditions. Similarly the growth in the advanced
economies like the United States of America is expected to accelerate towards 2 percent.
Increasing economic activity is a direct consequence of higher consumer spending and job
growth in the US. One such area which has become attractive from an investment point of view
is the travel and tourism industry. Last year, the travel and tourism industry accounted for nearly
5% of the country’s GDP . The industry caters to both business and leisure travelers with nearly2
4 out of 5 domestic trips (80%) being leisure trips. This shows a higher leisure spending by the
population.​ ​Majority​ ​of​ ​this​ ​travel​ ​is​ ​being​ ​serviced​ ​by​ ​the​ ​airline​ ​industry.
As per the bureau of transportation statistics the load factor for airlines is expected to be nearly
85% in 2017 . The first half of 2017 saw the average fares rise by 1.2% from $352 in Q1 2017 to3
$356 in Q2 2017, which is equivalent to an increase of more than 17% from the recession low of
$302 . Our understanding is that the air travel will continue to be an integral part of this equation4
and there remains immense growth opportunities within the United States region. The industry is
highly competitive with more than 10 airline companies in the region. Some of them have both
domestic​ ​and​ ​international​ ​operations.
Jetblue with nearly 6% market share is our chosen company for further analysis and valuation.
JetBlue Airways Corporation (NASDAQ: JBLU) is an American low-cost carrier headquartered
in the Long Island City that incorporated in Delaware in August 1998. It is the sixth largest
passenger carrier in the US serving 101 destinations in the U.S., Mexico, the Caribbean, Central
America and South America. JetBlue built its reputation as a customer-friendly airline in the
highly​ ​competitive​ ​industry.
Since its inception, the New York airliner has been growing steadily and has become the 5th
largest passenger carrier in the US. The oil price decline in the last 8 years enabled the company
to explore new markets and grow its reach. Its domestic presence has benefited the company to
remain immune towards foreign currency fluctuations and low operational fees from huge
international presence. With the positive forward looking statements from the management and
strong domestic demand for travel and consumer spending, we share the belief with the
management​ ​that​ ​the​ ​company​ ​would​ ​be​ ​able​ ​to​ ​sustain​ ​the​ ​current​ ​growth.
1
​ ​​http://www.worldbank.org/en/publication/global-economic-prospect 
2
​ ​​http://airlines.org/data/ 
3
​ ​​http://airlines.org/dataset/annual-results-u-s-airlines-2/ 
4
​ ​​https://www.bts.gov/newsroom/2nd-quarter-2017-air-fare-data
 
2
 
Airlines​ ​Industry​ ​-​ ​Porter’s​ ​Five​ ​Forces
The industry is highly competitive with more than a dozen companies fighting for a piece of the
pie. Alongside JetBlue, we have companies namely, Delta, United, American, Southwest and
half a dozen more with smaller market share than JetBlue. JetBlue has been gradually growing
its market share, but still lags behind the legacy companies like Delta and Southwest. The airline
initially began operations following its competition with low cost airline model. But, they
gradually caught up by differentiating themselves by providing in-flight entertainment on
domestic flights. Their mission is to provide the most affordable flying experience with superior
service. They were the first in the industry to offer comfort in flight by additional 2 inches of
leg-room and 100% fat free snacks on board. They also have the common room for all
passengers and the most favourable loyalty program with a chance to get double rewards for
members.
The​ ​following​ ​section​ ​provides​ ​the​ ​Porter’s​ ​five​ ​forces​ ​analysis​ ​for​ ​JetBlue:
❖ Threat​ ​of​ ​New​ ​Entrants​ ​-​ ​LOW
JetBlue operates primarily in the domestic airline industry which has high barriers to
entry and means that the threat of new entrants is low. This is because the start-up costs
are high, which includes the aircraft purchase, the onboarding of skilled labour and high
network​ ​expansion.
❖ Bargaining​ ​Power​ ​of​ ​Suppliers​ ​-​ ​MEDIUM
Within the domestic airline industry, the main suppliers are airplane and technology parts
manufacturers. With limited suppliers and long term contracts with these suppliers the
bargaining​ ​power​ ​is​ ​relatively​ ​medium​ ​for​ ​airlines​ ​such​ ​JetBlue.
❖ Bargaining​ ​Power​ ​of​ ​Customers​ ​-​ ​LOW
Customers are primary source of income for the company and compared to the handful of
companies in the industry there are far greater number of customers. Majority of
customers have a relatively small purchase size, so the bargaining power of these
customers​ ​is​ ​low.
❖ Threat​ ​of​ ​Substitutes​ ​-​ ​HIGH
Switching cost is minimal within the industry. Most customers select an airline according
to the destination, cost and time, despite there may be some preference on a specific
service​ ​provider.​ ​Thus​ ​the​ ​threat​ ​of​ ​switching​ ​is​ ​high.
❖ Rivalry​ ​Between​ ​the​ ​Existing​ ​Firms​ ​-​ ​HIGH
Having a lot of competition from the likes of Delta, United, American and Southwest, the
competition is intense. If the competition gets fierce the revenue of JetBlue and other
airlines​ ​would​ ​suffer.​ ​But​ ​these​ ​companies​ ​primarily​ ​compete​ ​on​ ​service​ ​differentiation.
3
 
Business​ ​Model​ ​&​ ​Value​ ​Drivers5
Jetblue offers customers a distinctive flying experience referred to as the ‘JetBlue Experience’,
on which JetBlue has built its reputation. The ​‘award winning service’ focuses on the entire
customer experience, from booking itinerary to arrival at final destination. ​Essentially​, we think
JetBlue actually survives among the big legendary airlines based on a cost-sensitive business
model,​ ​additionally,​ ​the​ ​company​ ​is​ ​implementing​ ​its​ ​expanding​ ​and​ ​growth​ ​strategy.
The​​ ​value​ ​driver​ ​of​ ​Jetblue​ ​can​ ​be​ ​summarized​ ​as​ ​the​ ​following​ ​three:
❖ Differentiated Product and Culture: The customers of Jetblue are neither high-traffic
business travelers nor ultra-price sensitive travelers. The ​‘​Jetblue Experience’ which is
the differentiated product for Jetblue ​is the key reason to attract new customers and
provide reasons for existing customers to come back. ​Airlines business is labor intensive.
In light of its competitive strengths, it has a service ​orientated culture ​grounded in five
key​ ​values:​ ​safety,​ ​caring,​ ​integrity,​ ​passion​ ​and​ ​fun.
❖ Competitive Costs: ​For the past decades, the cost structure had ​allowed Jetblue to price
fares lower than many competitors serving as one of the principal reasons ​for its growth.
Currently​, according to the management, ​the cost advantage of ​Jetblue ​is mainly due to
the high aircraft ​utilization​, new and ​efficient aircraft, relatively low distribution costs,
and​ ​a​ ​​productive​​ ​workforce.
❖ High-value Geography: ​Jetblue’s network ​is ​predominantly point-to-point ​system​. ​It ​has
been trying to ​optimize destinations, ​strengthen our network and ​increase unit revenues
by​ ​developing​ ​good​ ​understanding​ ​of​ ​the​ ​customers'​ ​travel​ ​purpose.
Risks​ ​Factors​ ​for​ ​the​ ​Company
We have classified the material possible external and internal risks that might affect Jetblue’s
operation​ ​and​ ​growth​ ​performance,​ ​whereas​ ​the​ ​risks​ ​are​ ​not​ ​limited​ ​to​ ​the​ ​following
❖ External​ ​risks
​ ​​ ​​ ​​ ​​ ​​ ​​ ​​ ​​ ​​ ​​ ​​ ​​ ​​ ​​ ​​ ​​ ​​ ​➣​ ​​ ​Rising​ ​fuel​ ​costs
​ ​​ ​​ ​​ ​​ ​​ ​​ ​​ ​​ ​​ ​​ ​​ ​​ ​​ ​​ ​​ ​​ ​​ ​➣​ ​​ ​Extreme​ ​​competition
​ ​​ ​​ ​​ ​​ ​​ ​​ ​​ ​​ ​​ ​​ ​​ ​​ ​​ ​​ ​​ ​​ ​​ ​➣​ ​​ ​Sensitivity​ ​to​ ​changes​ ​in​ ​economic​ ​environment
❖ Internal​ ​Risks
​ ​​ ​​ ​​ ​​ ​​ ​​ ​​ ​​ ​​ ​​ ​​ ​​ ​​ ​​ ​​ ​​ ​​ ​➣​ ​​ ​​ ​Unionization,​ ​work​ ​stoppers,​ ​slowdowns​ ​or​ ​increased​ ​labor​ ​costs
➢ Higher​ ​maintenance​ ​and​ ​salaries​ ​cost​ ​due​ ​to​ ​fleet​ ​and​ ​workforce​ ​aging
5
​ ​​JetBlue’s​ ​2016​ ​Annual​ ​Report​ ​on​ ​Form​ ​10-K 
4
 
JetBlue​ ​-​ ​Financial​ ​Performance6
❖ Liquidity: ​A healthy liquidity position is crucial for capital-intensive airline business. For
the last five years, Jetblue has been working on its liquidity weaknesses. By the end of
the ​third ​quarter in 2017, Jetblue had cash of $394 million and ​short-term investments of
$420 million, ​which was approximately 12% of the trailing twelve months revenue.
Together with ​a substantial available line ​of credit due to the reduced leverage, Jetblue is
no​ ​longer​ ​in​ ​a​ ​weak​ ​liquidity​ ​position.
❖ Profitability: Despite airline industry being ​capital intensive ​compared to other industries,
the net profit margin of the industry ​is ​volatile​. For Jetblue, both net profit margin and
ROA​​ ​have​ ​been​ ​increasing​ ​significantly​ ​for​ ​the​ ​last​ ​five​ ​years.
❖ Capital Structure: Jetblue used to have a higher than average financial leverage.
However, according to the ​management of Jetblue by the year end 2016, the company
began striving to maintain financial ​strength and a cost structure to grow profitably. Since
2012, Jetblue has paired down long-term liabilities by nearly 1.5 billion. The improved
capital structure has resulted in good credit rating, allowing for more attractive financing
terms.
❖ Market to Book: Jetblue has a P/E ratio of 9.66 in 2016, which is slightly lower than the
industry​ ​average.
❖ Efficiency: ​The ​asset turnover ratio of Jetblue in 2016 was 0.73, which had been keeping
steady​ ​for​ ​the​ ​past​ ​five​ ​years.​ ​It​ ​is​ ​not​ ​quite​ ​out​ ​of​ ​normal​ ​in​ ​the​ ​industry.
Financial​ ​Model​ ​Assumptions
The competition’s significant international operations helps in high revenue generation for the
these companies, but the current strategy of JetBlue to minimise its debt and leasing costs by
purchasing new airplanes is something that would benefit the company in the long run. With a
high risk of substantial stress on cash flows with fixed interest cost, the current strategy to pare
down its debt would bode well for JetBlue in future. This would enable to company to raise
capital when it is highly required possibly to expand operations internationally.. The following
assumptions​ ​become​ ​the​ ​basis​ ​for​ ​our​ ​financial​ ​model​ ​towards​ ​valuing​ ​JetBlue:
❖ Revenue Growth Assumptions: We have assumed that the growth rate to be equal to the
average​ ​growth​ ​rate​ ​of​ ​the​ ​growth​ ​in​ ​revenue​ ​for​ ​last​ ​five​ ​years.
❖ Operating Cost Assumptions: We have assumed that the major expenses such as fuel
would change as per the projected change in crude prices as per the published data by
IBISWorld. Other costs like salaries, maintenance, etc. are assumed to be the average
6
​ ​​Standard​ ​&​ ​Poor's​ ​NetAdvantage:​ ​Industry​ ​Surveys​​ ​-​ ​US​ ​Airlines​ ​Industry;​ ​​IBISWorld  
Industry​​ ​Report​ ​-​ ​48111b​ ​Domestic​ ​Airlines​ ​in​ ​the​ ​US 
 
5
 
percentage of revenue calculated from past 5 years, since this would be directly
correlated​ ​to​ ​the​ ​top-line​ ​growth​ ​as​ ​assumed.
❖ Capital Expenditure Assumptions: All capex items in the Model are assumed to be the
average​ ​percentage​ ​growth​ ​from​ ​last​ ​5​ ​years​ ​net​ ​of​ ​any​ ​skewness​ ​due​ ​to​ ​any​ ​outlier.
❖ Working Capital Assumptions: We have used the current assets excluding cash to
compute​ ​the​ ​change​ ​in​ ​working​ ​capital​ ​over​ ​the​ ​years.
❖ Capital Structure Assumptions: The company has not paid any cash dividends and has
clearly laid out that they do not have any intentions to do so in the future. Other than this,
we have used the latest debt schedule in the annual report to calculate the book value of
debt.​ ​The​ ​debt​ ​cost​ ​is​ ​based​ ​on​ ​the​ ​interest​ ​expense​ ​net​ ​of​ ​current​ ​taxes.
Modeling​ ​Results
Based on our ​assumptions​, the financial model computes the fair value of the traded common
stock of JetBlue at a price of $38.56 with an enterprise value of $14.2 billion. This gives an
absolute upside potential of 75% from the current price of $22.10. The calculated price,
considers the effective tax rate of nearly 38%. Our assumption of terminal growth rate of 8.5% is
near about the consensus estimates in the airline industry and specific for JetBlue. The WACC of
10.35% as calculated using the Bloomberg Beta and estimated CAPM is well below its last
Return on investment of ~14%. We also tried to run a sensitivity analysis with changes to the
WACC and Terminal Growth Rate, giving a snapshot of how the equity value and the share price
fluctuates​ ​when​ ​the​ ​two​ ​inputs​ ​change:
6
 
Scenario​ ​Analysis
Among our assumptions, big uncertainty comes from the four areas. These scenarios are defined
as the ‘Base Case’, ‘Best Case’ and the ‘Worst Case’. The underlying basis of these scenarios
remains the macro changes affecting specific financials of the company. Accordingly, we drive
our​ ​scenario​ ​analysis​ ​mainly​ ​based​ ​on​ ​changes​ ​to​ ​the​ ​four​ ​assumptions:
❖ Revenue Growth Assumptions: We tried to factor in changes to the valuation when we
see a 0.5% change in the revenue growth of the company due to increased competition or
sudden​ ​shift​ ​in​ ​leisure​ ​spending​ ​affecting​ ​the​ ​topline​ ​growth.
❖ Fuel Cost Assumptions: We tried to factor in the changes to the costs specific to the
geopolitics driving the commodity price of Crude oil. Our assumption is that there can be
a 1% correction in the crude price from current levels after the last OPEC production cap
and increased shale production in the US. This is considered to be a best case scenario for
managing the cost for the company. Whereas there is also a risk of civil unrest in some of
the​ ​major​ ​economies​ ​producing​ ​oil​ ​which​ ​can​ ​impact​ ​the​ ​prices​ ​by​ ​0.5%​ ​higher.
❖ Terminal Growth Rate Assumptions: Considering a rapid growth rate in the initial years
the company can see a small increment in the terminal growth rate of 0.5% which
significantly impacts the value. Whereas the worst case is thought to be with a higher
terminal​ ​growth​ ​rate​ ​by​ ​1%​ ​reducing​ ​the​ ​probable​ ​growth​ ​in​ ​initial​ ​years.
❖ Discount Rate Assumptions: Our discount rate scenario is primarily affected by the
change in debt cost with the rising interest rate scenario in the economy. We have
assumed that with the given policy of reducing its debt levels, the company can see a
slight change of 1% to its WACC in the worst case. Whereas, the best case is assumed to
be with a WACC correction by 0.5% given the overall debt level to continue to be
reduced.
7
 
Lastly, it is worth mentioning that if the proposed Tax Reform Plan, which was passed by senate
republicans early this December, would be passed on the conference, the influence on tax-related
elements​ ​in​ ​our​ ​financial​ ​statements​ ​and​ ​WACC​ ​estimation​ ​would​ ​be​ ​significant.

Jetblue Valuation

  • 1.
        JetBlue  Corporate​ ​Financial​ ​Modeling​​Project By:​ ​Michelle​ ​Liu,​ ​Varun​ ​Gupta​ ​and​ ​Yiyao​ ​Zhou      
  • 2.
    1   Industry​ ​Overview​ ​-​​Aviation The global GDP has been estimated to strengthen to 2.7 percent in 2017 in the wake of rising1 economic activity and global financing conditions. Similarly the growth in the advanced economies like the United States of America is expected to accelerate towards 2 percent. Increasing economic activity is a direct consequence of higher consumer spending and job growth in the US. One such area which has become attractive from an investment point of view is the travel and tourism industry. Last year, the travel and tourism industry accounted for nearly 5% of the country’s GDP . The industry caters to both business and leisure travelers with nearly2 4 out of 5 domestic trips (80%) being leisure trips. This shows a higher leisure spending by the population.​ ​Majority​ ​of​ ​this​ ​travel​ ​is​ ​being​ ​serviced​ ​by​ ​the​ ​airline​ ​industry. As per the bureau of transportation statistics the load factor for airlines is expected to be nearly 85% in 2017 . The first half of 2017 saw the average fares rise by 1.2% from $352 in Q1 2017 to3 $356 in Q2 2017, which is equivalent to an increase of more than 17% from the recession low of $302 . Our understanding is that the air travel will continue to be an integral part of this equation4 and there remains immense growth opportunities within the United States region. The industry is highly competitive with more than 10 airline companies in the region. Some of them have both domestic​ ​and​ ​international​ ​operations. Jetblue with nearly 6% market share is our chosen company for further analysis and valuation. JetBlue Airways Corporation (NASDAQ: JBLU) is an American low-cost carrier headquartered in the Long Island City that incorporated in Delaware in August 1998. It is the sixth largest passenger carrier in the US serving 101 destinations in the U.S., Mexico, the Caribbean, Central America and South America. JetBlue built its reputation as a customer-friendly airline in the highly​ ​competitive​ ​industry. Since its inception, the New York airliner has been growing steadily and has become the 5th largest passenger carrier in the US. The oil price decline in the last 8 years enabled the company to explore new markets and grow its reach. Its domestic presence has benefited the company to remain immune towards foreign currency fluctuations and low operational fees from huge international presence. With the positive forward looking statements from the management and strong domestic demand for travel and consumer spending, we share the belief with the management​ ​that​ ​the​ ​company​ ​would​ ​be​ ​able​ ​to​ ​sustain​ ​the​ ​current​ ​growth. 1 ​ ​​http://www.worldbank.org/en/publication/global-economic-prospect  2 ​ ​​http://airlines.org/data/  3 ​ ​​http://airlines.org/dataset/annual-results-u-s-airlines-2/  4 ​ ​​https://www.bts.gov/newsroom/2nd-quarter-2017-air-fare-data  
  • 3.
    2   Airlines​ ​Industry​ ​-​​Porter’s​ ​Five​ ​Forces The industry is highly competitive with more than a dozen companies fighting for a piece of the pie. Alongside JetBlue, we have companies namely, Delta, United, American, Southwest and half a dozen more with smaller market share than JetBlue. JetBlue has been gradually growing its market share, but still lags behind the legacy companies like Delta and Southwest. The airline initially began operations following its competition with low cost airline model. But, they gradually caught up by differentiating themselves by providing in-flight entertainment on domestic flights. Their mission is to provide the most affordable flying experience with superior service. They were the first in the industry to offer comfort in flight by additional 2 inches of leg-room and 100% fat free snacks on board. They also have the common room for all passengers and the most favourable loyalty program with a chance to get double rewards for members. The​ ​following​ ​section​ ​provides​ ​the​ ​Porter’s​ ​five​ ​forces​ ​analysis​ ​for​ ​JetBlue: ❖ Threat​ ​of​ ​New​ ​Entrants​ ​-​ ​LOW JetBlue operates primarily in the domestic airline industry which has high barriers to entry and means that the threat of new entrants is low. This is because the start-up costs are high, which includes the aircraft purchase, the onboarding of skilled labour and high network​ ​expansion. ❖ Bargaining​ ​Power​ ​of​ ​Suppliers​ ​-​ ​MEDIUM Within the domestic airline industry, the main suppliers are airplane and technology parts manufacturers. With limited suppliers and long term contracts with these suppliers the bargaining​ ​power​ ​is​ ​relatively​ ​medium​ ​for​ ​airlines​ ​such​ ​JetBlue. ❖ Bargaining​ ​Power​ ​of​ ​Customers​ ​-​ ​LOW Customers are primary source of income for the company and compared to the handful of companies in the industry there are far greater number of customers. Majority of customers have a relatively small purchase size, so the bargaining power of these customers​ ​is​ ​low. ❖ Threat​ ​of​ ​Substitutes​ ​-​ ​HIGH Switching cost is minimal within the industry. Most customers select an airline according to the destination, cost and time, despite there may be some preference on a specific service​ ​provider.​ ​Thus​ ​the​ ​threat​ ​of​ ​switching​ ​is​ ​high. ❖ Rivalry​ ​Between​ ​the​ ​Existing​ ​Firms​ ​-​ ​HIGH Having a lot of competition from the likes of Delta, United, American and Southwest, the competition is intense. If the competition gets fierce the revenue of JetBlue and other airlines​ ​would​ ​suffer.​ ​But​ ​these​ ​companies​ ​primarily​ ​compete​ ​on​ ​service​ ​differentiation.
  • 4.
    3   Business​ ​Model​ ​&​​Value​ ​Drivers5 Jetblue offers customers a distinctive flying experience referred to as the ‘JetBlue Experience’, on which JetBlue has built its reputation. The ​‘award winning service’ focuses on the entire customer experience, from booking itinerary to arrival at final destination. ​Essentially​, we think JetBlue actually survives among the big legendary airlines based on a cost-sensitive business model,​ ​additionally,​ ​the​ ​company​ ​is​ ​implementing​ ​its​ ​expanding​ ​and​ ​growth​ ​strategy. The​​ ​value​ ​driver​ ​of​ ​Jetblue​ ​can​ ​be​ ​summarized​ ​as​ ​the​ ​following​ ​three: ❖ Differentiated Product and Culture: The customers of Jetblue are neither high-traffic business travelers nor ultra-price sensitive travelers. The ​‘​Jetblue Experience’ which is the differentiated product for Jetblue ​is the key reason to attract new customers and provide reasons for existing customers to come back. ​Airlines business is labor intensive. In light of its competitive strengths, it has a service ​orientated culture ​grounded in five key​ ​values:​ ​safety,​ ​caring,​ ​integrity,​ ​passion​ ​and​ ​fun. ❖ Competitive Costs: ​For the past decades, the cost structure had ​allowed Jetblue to price fares lower than many competitors serving as one of the principal reasons ​for its growth. Currently​, according to the management, ​the cost advantage of ​Jetblue ​is mainly due to the high aircraft ​utilization​, new and ​efficient aircraft, relatively low distribution costs, and​ ​a​ ​​productive​​ ​workforce. ❖ High-value Geography: ​Jetblue’s network ​is ​predominantly point-to-point ​system​. ​It ​has been trying to ​optimize destinations, ​strengthen our network and ​increase unit revenues by​ ​developing​ ​good​ ​understanding​ ​of​ ​the​ ​customers'​ ​travel​ ​purpose. Risks​ ​Factors​ ​for​ ​the​ ​Company We have classified the material possible external and internal risks that might affect Jetblue’s operation​ ​and​ ​growth​ ​performance,​ ​whereas​ ​the​ ​risks​ ​are​ ​not​ ​limited​ ​to​ ​the​ ​following ❖ External​ ​risks ​ ​​ ​​ ​​ ​​ ​​ ​​ ​​ ​​ ​​ ​​ ​​ ​​ ​​ ​​ ​​ ​​ ​​ ​➣​ ​​ ​Rising​ ​fuel​ ​costs ​ ​​ ​​ ​​ ​​ ​​ ​​ ​​ ​​ ​​ ​​ ​​ ​​ ​​ ​​ ​​ ​​ ​​ ​➣​ ​​ ​Extreme​ ​​competition ​ ​​ ​​ ​​ ​​ ​​ ​​ ​​ ​​ ​​ ​​ ​​ ​​ ​​ ​​ ​​ ​​ ​​ ​➣​ ​​ ​Sensitivity​ ​to​ ​changes​ ​in​ ​economic​ ​environment ❖ Internal​ ​Risks ​ ​​ ​​ ​​ ​​ ​​ ​​ ​​ ​​ ​​ ​​ ​​ ​​ ​​ ​​ ​​ ​​ ​​ ​➣​ ​​ ​​ ​Unionization,​ ​work​ ​stoppers,​ ​slowdowns​ ​or​ ​increased​ ​labor​ ​costs ➢ Higher​ ​maintenance​ ​and​ ​salaries​ ​cost​ ​due​ ​to​ ​fleet​ ​and​ ​workforce​ ​aging 5 ​ ​​JetBlue’s​ ​2016​ ​Annual​ ​Report​ ​on​ ​Form​ ​10-K 
  • 5.
    4   JetBlue​ ​-​ ​Financial​​Performance6 ❖ Liquidity: ​A healthy liquidity position is crucial for capital-intensive airline business. For the last five years, Jetblue has been working on its liquidity weaknesses. By the end of the ​third ​quarter in 2017, Jetblue had cash of $394 million and ​short-term investments of $420 million, ​which was approximately 12% of the trailing twelve months revenue. Together with ​a substantial available line ​of credit due to the reduced leverage, Jetblue is no​ ​longer​ ​in​ ​a​ ​weak​ ​liquidity​ ​position. ❖ Profitability: Despite airline industry being ​capital intensive ​compared to other industries, the net profit margin of the industry ​is ​volatile​. For Jetblue, both net profit margin and ROA​​ ​have​ ​been​ ​increasing​ ​significantly​ ​for​ ​the​ ​last​ ​five​ ​years. ❖ Capital Structure: Jetblue used to have a higher than average financial leverage. However, according to the ​management of Jetblue by the year end 2016, the company began striving to maintain financial ​strength and a cost structure to grow profitably. Since 2012, Jetblue has paired down long-term liabilities by nearly 1.5 billion. The improved capital structure has resulted in good credit rating, allowing for more attractive financing terms. ❖ Market to Book: Jetblue has a P/E ratio of 9.66 in 2016, which is slightly lower than the industry​ ​average. ❖ Efficiency: ​The ​asset turnover ratio of Jetblue in 2016 was 0.73, which had been keeping steady​ ​for​ ​the​ ​past​ ​five​ ​years.​ ​It​ ​is​ ​not​ ​quite​ ​out​ ​of​ ​normal​ ​in​ ​the​ ​industry. Financial​ ​Model​ ​Assumptions The competition’s significant international operations helps in high revenue generation for the these companies, but the current strategy of JetBlue to minimise its debt and leasing costs by purchasing new airplanes is something that would benefit the company in the long run. With a high risk of substantial stress on cash flows with fixed interest cost, the current strategy to pare down its debt would bode well for JetBlue in future. This would enable to company to raise capital when it is highly required possibly to expand operations internationally.. The following assumptions​ ​become​ ​the​ ​basis​ ​for​ ​our​ ​financial​ ​model​ ​towards​ ​valuing​ ​JetBlue: ❖ Revenue Growth Assumptions: We have assumed that the growth rate to be equal to the average​ ​growth​ ​rate​ ​of​ ​the​ ​growth​ ​in​ ​revenue​ ​for​ ​last​ ​five​ ​years. ❖ Operating Cost Assumptions: We have assumed that the major expenses such as fuel would change as per the projected change in crude prices as per the published data by IBISWorld. Other costs like salaries, maintenance, etc. are assumed to be the average 6 ​ ​​Standard​ ​&​ ​Poor's​ ​NetAdvantage:​ ​Industry​ ​Surveys​​ ​-​ ​US​ ​Airlines​ ​Industry;​ ​​IBISWorld   Industry​​ ​Report​ ​-​ ​48111b​ ​Domestic​ ​Airlines​ ​in​ ​the​ ​US   
  • 6.
    5   percentage of revenuecalculated from past 5 years, since this would be directly correlated​ ​to​ ​the​ ​top-line​ ​growth​ ​as​ ​assumed. ❖ Capital Expenditure Assumptions: All capex items in the Model are assumed to be the average​ ​percentage​ ​growth​ ​from​ ​last​ ​5​ ​years​ ​net​ ​of​ ​any​ ​skewness​ ​due​ ​to​ ​any​ ​outlier. ❖ Working Capital Assumptions: We have used the current assets excluding cash to compute​ ​the​ ​change​ ​in​ ​working​ ​capital​ ​over​ ​the​ ​years. ❖ Capital Structure Assumptions: The company has not paid any cash dividends and has clearly laid out that they do not have any intentions to do so in the future. Other than this, we have used the latest debt schedule in the annual report to calculate the book value of debt.​ ​The​ ​debt​ ​cost​ ​is​ ​based​ ​on​ ​the​ ​interest​ ​expense​ ​net​ ​of​ ​current​ ​taxes. Modeling​ ​Results Based on our ​assumptions​, the financial model computes the fair value of the traded common stock of JetBlue at a price of $38.56 with an enterprise value of $14.2 billion. This gives an absolute upside potential of 75% from the current price of $22.10. The calculated price, considers the effective tax rate of nearly 38%. Our assumption of terminal growth rate of 8.5% is near about the consensus estimates in the airline industry and specific for JetBlue. The WACC of 10.35% as calculated using the Bloomberg Beta and estimated CAPM is well below its last Return on investment of ~14%. We also tried to run a sensitivity analysis with changes to the WACC and Terminal Growth Rate, giving a snapshot of how the equity value and the share price fluctuates​ ​when​ ​the​ ​two​ ​inputs​ ​change:
  • 7.
    6   Scenario​ ​Analysis Among ourassumptions, big uncertainty comes from the four areas. These scenarios are defined as the ‘Base Case’, ‘Best Case’ and the ‘Worst Case’. The underlying basis of these scenarios remains the macro changes affecting specific financials of the company. Accordingly, we drive our​ ​scenario​ ​analysis​ ​mainly​ ​based​ ​on​ ​changes​ ​to​ ​the​ ​four​ ​assumptions: ❖ Revenue Growth Assumptions: We tried to factor in changes to the valuation when we see a 0.5% change in the revenue growth of the company due to increased competition or sudden​ ​shift​ ​in​ ​leisure​ ​spending​ ​affecting​ ​the​ ​topline​ ​growth. ❖ Fuel Cost Assumptions: We tried to factor in the changes to the costs specific to the geopolitics driving the commodity price of Crude oil. Our assumption is that there can be a 1% correction in the crude price from current levels after the last OPEC production cap and increased shale production in the US. This is considered to be a best case scenario for managing the cost for the company. Whereas there is also a risk of civil unrest in some of the​ ​major​ ​economies​ ​producing​ ​oil​ ​which​ ​can​ ​impact​ ​the​ ​prices​ ​by​ ​0.5%​ ​higher. ❖ Terminal Growth Rate Assumptions: Considering a rapid growth rate in the initial years the company can see a small increment in the terminal growth rate of 0.5% which significantly impacts the value. Whereas the worst case is thought to be with a higher terminal​ ​growth​ ​rate​ ​by​ ​1%​ ​reducing​ ​the​ ​probable​ ​growth​ ​in​ ​initial​ ​years. ❖ Discount Rate Assumptions: Our discount rate scenario is primarily affected by the change in debt cost with the rising interest rate scenario in the economy. We have assumed that with the given policy of reducing its debt levels, the company can see a slight change of 1% to its WACC in the worst case. Whereas, the best case is assumed to be with a WACC correction by 0.5% given the overall debt level to continue to be reduced.
  • 8.
    7   Lastly, it isworth mentioning that if the proposed Tax Reform Plan, which was passed by senate republicans early this December, would be passed on the conference, the influence on tax-related elements​ ​in​ ​our​ ​financial​ ​statements​ ​and​ ​WACC​ ​estimation​ ​would​ ​be​ ​significant.