Download to read offline


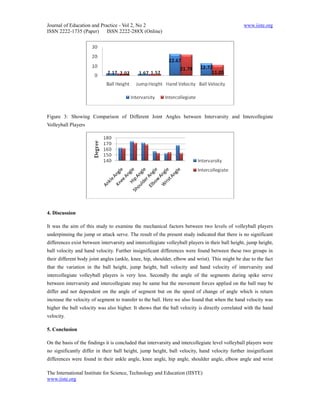

The study compares biomechanical parameters of spike serves between intervarsity and intercollegiate male volleyball players, using kinematic analysis on 12 selected athletes. Results indicate no significant differences in ball height, jump height, ball velocity, or hand velocity, as well as joint angles between the two groups. The findings suggest that both levels exhibit similar biomechanics in the spike serve performance.


![11.[6 12]assessing the relationship of kinematics with dribbling performance ...](https://cdn.slidesharecdn.com/ss_thumbnails/11-6-12assessingtherelationshipofkinematicswithdribblingperformanceofbasketballatdifferentphases-120512235435-phpapp01-thumbnail.jpg?width=640&height=640&fit=bounds)


