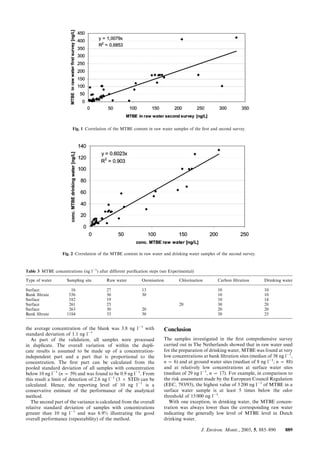
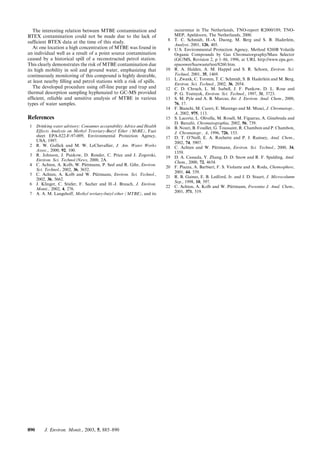
Survey of the occurrence of residues of methyl tertiary butyl ether
(MTBE) in Dutch drinking water sources and drinking water
Pepijn Morgenstern,a
Ans F. M. Versteegh,a
Gert A. L. de Korte,b
Ronald Hoogerbrugge,b
Dennis Mooibroek,b
Andre´ Banninkc
and
Elbert A. Hogendoorn*b
a
National Institute for Public Health and the Environment (RIVM), Center for Inspectorate
Research, Emergency Response and Drinking Water, PO Box 1, 3720 BA Bilthoven,
The Netherlands
b
National Institute for Public Health and the Environment (RIVM), Laboratory for
Analytical Chemistry , The Netherlands. E-mail: elbert.hogendoorn@rivm.nl;
Fax: 131 30 2744424
c
The Netherlands Waterworks Association (VEWIN), PO Box 1019, 2280 CA Rijswijk,
The Netherlands
Received 8th May 2003, Accepted 3rd September 2003
First published as an Advance Article on the web 6th October 2003
An indicative survey has been carried out in The Netherlands investigating the presence of methyl tertiary butyl
ether (MTBE) in drinking water and the corresponding sources. In total, 71 different sites used for the
preparation of drinking water in The Netherlands were sampled in two successive seasons in 2001 involving the
analysis of 156 samples. (ground water (n ~ 88), surface water (n ~ 17), bank filtrate water (n ~ 6) and
drinking water (n ~ 45)). To combine high sample throughput with high selectivity and sensitivity, off-line
purge and trap for sampling and gas chromatography mass spectrometry equipped with an automated thermal
desorption sampler (TDS-GC-MS) was selected as the preferred analytical methodology. The developed
procedure enabled the analysis of at least 40 samples per day and provided a limit of quantification of 2 ng l21
.
In the first period 63 samples of raw water were analyzed. Concentrations ranged between v10 ng l21
and
420 ng l21
with a median concentration below 10 ng l21
. The second period was focused at the re-sampling of
positive locations (MTBE w 10 ng l21
) and a few additional drinking water utilities of which both the raw and
drinking water of the utilities were analyzed. The median concentration of MTBE in the selected set of
drinking water samples was 20 ng l21
(n ~ 45). At one location MTBE was found at a level of 2 900 ng l21
caused by point source contamination of the ground water (11 900 ng l21
). Special attention has been paid to
the quality of the results by analyzing all samples in duplicate and the analysis of control samples during each
series of analyses.
Introduction
Since the introduction in the late 1970’s, methyl tertiary butyl
ether (MTBE) has been progressively and successfully used in
the United States (US) and the European Union (EU) as an
oxygenate additive in gasoline to enhance the octane index and
improve combustion efficiency. However, the success of MTBE
is counteracted by its potential threat to contaminate drinking
water sources, most importantly by the possible leaks from
underground and above ground petroleum storage tank systems.
Due to its small molecular size and relatively high solubility in
water, MTBE moves rapidly in ground water, faster than other
constituents of gasoline. This phenomenon can result in so-
called point-source contamination of wells. Non-point sources,
such as watercraft and air deposition via vehicle or industrial
emissions contribute to the contamination of surface water.1
Reviews2,3
on the occurrence of MTBE in drinking water
sources in the US clearly reveal that the presence of MTBE is a
concern and conclude that problems can be expected to worsen
if the use of MTBE is still expanding.
In comparison with the US, the amount of MTBE additive in
European petrol is distinctly less. However, a complete EU
inventory on MTBE in ground water is not available yet.
Recently, monitoring results became available about the
occurrence of MTBE in Germany at locations involving river
and waste water,4
riverbank filtered water and related drinking
water,5
and ground water.6
In 1987, the Soil Protection Act came into force in The
Netherlands. This legislation enforced all petrol stations to
reconstruct paving in such a way that petrol cannot leak into
the soil anymore and to clean existing soil contaminations. This
process was finalized in the mid 1990’s and included the closure
of a lot of small petrol stations; hence, gasoline-soil pollutions
were not expected to be a large problem in The Netherlands.
However, in a preliminary study carried out in The Nether-
lands in 1999 and involving the analyses of a few ground water
samples near petrol stations, MTBE contaminations were
found in two out of the four locations investigated.7
In order to be more actually and comprehensively informed,
our Institute in cooperation with The Netherlands Waterworks
Association (VEWIN) conducted a priority study on the
occurrence of MTBE in drinking water sources and drinking
water in between assignment of the Inspectorate of the
Ministry of Housing, Spatial Planning and the Environment
(VROM). It must be notified that additional information on
the presence of metabolites of MTBE and other gasoline-soil
pollution such benzene, toluene, xylenes will be relevant and
valuable. However, expecting low contamination levels as a
result of the enforcement of the Dutch Soil Protection Act and
the need to supply MTBE data as soon as possible, these
compounds were on purpose not included in this study. The
strategy consisted of the measurement of MTBE in most of
the vulnerable ground and surface water sites used for the
production of drinking water, followed by a second screening
DOI: 10.1039/b305187k J. Environ. Monit., 2003, 5, 885–890 885
This journal is # The Royal Society of Chemistry 2003
involving the re-sampling of the raw water of all positive
locations (MTBE concentration w10 ng l21
) and their drinking
water.
Because of the urgency to be informed and the required
reliability of data, selectivity and sensitivity (reporting level of
10 ng l21
), special considerations were made in the selection of
the applied methodology.
Recently, the pros and cons of various analytical methodol-
ogies for the analysis of both fuel oxygenates and metabolites
in the environmental matrices water and air have been
reviewed.8
On-line purge and trap (P&T) gas chromatography
with mass spectrometry (GC-MS) is frequently and routinely
applied for the analysis of MTBE in water samples.6,9,10
However, this robust and selective procedure does not provide
the required sensitivity as well as approach of direct aqueous
injection.11–13
Attractive upcoming approaches providing improved effi-
ciency are the head space technique14–16,17
and solid-phase
micro extraction (SPME) hyphenated to GC-MS. The latter
technique performs SPME direct in water8,18–20
or in the
headspace mode.4,5,21,22
As regards simplicity and automation
and a reported limit of detection of around 10 ng l21
, these
techniques are both attractive. Unfortunately, these techniques
were not available at our laboratory at the time of this study.
Therefore, it was decided to employ off-line P&T as an
efficient technique for the simultaneous extraction of MTBE
out of six relatively large volumes of samples in less than 20 min
followed by the automated analyses of the trapping tubes
employing an Automated Thermal Desorption system coupled
to GC-MS. This approach enabled a sample throughput of
more than 40 samples per day and provided a limit of detection
of 2 ng l21
.
Experimental
Sampling. The selection of the treatment plants where
drinking water is produced included almost all points used
for the intake of surface water and the majority of vulnerable
ground water and bank filtrate water sources. An anonymous
overview of sampling sites is made in Table 1 and includes
information about the depth of the filter of the water
withdrawn from ground water locations.
The project consisted of two series of samplings carried out
in the summer and autumn of 2001. The first screening involved
the sampling of 63 locations of pumping stations, in which only
raw (source) water samples were taken.
In a second series both raw water and drinking water were
sampled at the positive locations (MTBE content w10 ng l21
),
together with a few new locations, which could not be analyzed
in the first series. Additionally, at a few locations individual
wells were sampled and at six stations samples were taken
corresponding to the steps of the treatment process. Water
samples were collected in 250 ml glass bottles using standard
water sampling techniques for volatile organic compounds.
After collection, samples were immediately stored under dark
and cool (approximately 4 uC) conditions and analyzed within
48 h.
Depending on the type of water and location the following
purification steps are usually applied:
Ground water: pH correction, aeration and ‘rapid’ sand
filtration.
Surface water: before storage in open reservoirs or dunes first
treatment consists of pH-correction, coagulation/flocculation
and rapid sand filtration. The additional purification at the
treatment plant usually consists of one or more of the following
steps (i) granular activated carbon filtration, (ii) rapid sand
filtration, (iii) ozonisation, (iv) aeration and (v) disinfection by
means of a slow sand filtration or the use of chlorine (Cl2). At
one location, surface water is not stored before use but directly
undergoes a treatment consisting of a combination of an ultra-
filtration and a reverse osmosis step.
Bank filtration water: This water is extracted from wells near
a river of a lake and, therefore, consists of both infiltrated
surface water and ground water. With exclusion of the storage
step, purification steps are similar to those applied for surface
water.
Standards, materials and instruments. Methyl tertiary butyl
ether (MTBE) and its isotopic analogue d3-MTBE were
bought as high purity standard solutions of 10 mg ml21
from Merck and Aldrich, respectively. For calibration and
validation experiments, the MTBE solution was diluted at
concentrations of 10, 100 and 1000 ng l21
and for the use of
internal standard, d3-MTBE was diluted to a concentration of
1 mg ml21
. The dilution steps were performed with methanol.
For their use as an internal standard or recovery experiments, a
volume of 10 ml of the methanol standard solutions was added
to a volume of 100 ml of water sample. The standard solutions
and stock solution were kept at approximately 4 uC and
approximately 225 uC, respectively. Carbopack B, 60/80 mesh
was used as material (150 mg) for the trapping glass tubes used
for trapping and thermal desorption and conditioned as
described below. After conditioning the tubes were capped
and stored at room temperature.
A six position purge and trap system model 6/100 of
Euroglass was used for trapping and an Automated Thermo
Desorber (ATD) TurboMatrix of Perkin Elmer for the
desorption. The ATD system was coupled to a model TOP
Series 8000 gas chromatography of Fisons equipped with a 30 m
DB-5MS capillary column (0.25 mm) with a film thickness of
0.25 mm, and hyphenated to a model MD 800 mass spectro-
meter of Interscience (VG Masslab)
Sample pre-treatment. A 100 ml aliquot of water is
introduced to the purge vessel of the purge and trap (P&T)
system. After adding 10 ml of the d3-MTBE (10 ng) internal
standard solution, the sample was purged with nitrogen for
30 min at a flow rate of 50 ml min21
at a temperature of
80 uC. During each P&T series, one or two positions were used
to process blank water sample(s). After P&T, the Carbopack
cartridges were removed from the coolers and capped before
analyzing.
Instrumental analysis. The collected P&T sample tubes were
placed in the turret of the ATD. The samples were
automatically processed involving (i) desorption of compounds
with an inert gas at elevated temperature (200 uC), (ii)
concentration of the compounds in a cold trap at 230 uC,
and (iii) the transfer of compounds to the GC column through
a heated transfer line (175 uC) by rapidly heating the cold trap
to 300 uC. In order to suppress band broadening of MTBE, a
split mode with a ratio of 1:5 and a 0.32 mm (inner diameter)
fused silica transfer liner was used. The GC column
temperature was first held at 40 uC for 5 min then increased
to 180 uC at a rate of 20 uC min21
and held for 5 min at the final
temperature. Helium served as carrier gas at a pressure of
80 kPa.
Scanning of the EI fragments was performed in full scan
mode with a scan range of 40–110 m/z. Mass chromatography
of m/z 73 and m/z 76 in full scan mode was used for the
quantification of MTBE by the internal standard d3-MTBE
respectively.
General precautions. Occasionally, a low concentration of
MTBE was found (about 3 ng l21
) in purified water indicating
the possibility of air contamination. Therefore, before use, the
886 J. Environ. Monit., 2003, 5, 885–890
Table 1 MTBE concentration in the water samples (ng l21
) of the indivuidual sampling sites
Code of Type of a
Depth of
MTBE content of
first survey/ng l21c
MTBE content of second survey/ng l21c
sampling site water filterb
/m Raw water Raw water Drinking water
11 G 2–83 23 24 21
16 S 32 270 10
22 G 26–107 v10 n.s n.s
28 G 28–50 v10 n.s n.s
39 G –85 v10 n.s n.s
42 G 50–62 v10 n.s n.s
53 S 177 245 n.s
53 BF n.s 50 10
64 G 11–28 36 29 26
69 G 24–147 12 v10 v10
70 G 32–77 95 v10 v10
73 G 50–65 122 106 61
79 G 13–29 10 10 10
87 S 126 154 n.s
93 G 27–31 176 160 100
94 BF n.s 220 140
98 S v10 n.s n.s
105 G –67 v10 n.s n.s
115 G 25–27 161 169 126
124 G 8–100 10 10 10
126 G n.a. n.s 15 15
130 G 19–90 v10 n.s n.s
138 G 9–19 v10 n.s n.s
139 G 3–27 v10 n.s n.s
140 G 20–60 v10 n.s n.s
160 G 53–183 v10 n.s n.s
161 G 25–61 v10 n.s n.s
165 G n.a. n.s 15 25
169 G n.a. n.s 10 10
177 G 65–113 v10 n.s n.s
178 G 24–76 v10 n.s n.s
180 G 48–75 10 50 57
182 S 20 19 14
198 G 23–65 13 25 26
199 G 33–47 412 209 133
201 G 8–18 45 10 10
202 G 36–62 48 v10 13
205 G 7–64 80 34 21
209 G 10–28 10 10 10
214 G 15–40 11 10 10
215 G 12–52 10 10 10
216 G 18–34 51 46 14
217 G 17–36 v10 n.s n.s
218 G 17–30 n.s 35 38
219 G 21–39 v10 n.s n.s
220 G 17–37 v10 n.s n.s
223 G 20–34 v10 n.s n.s
226 G 21–40 v10 n.s n.s
227 G 15–44 103 300 2860
231 G 39–82 10 85 28
232 G 29–75 v10 n.s n.s
240 G 28–65 10 10 10
242 G 14–31 10 10 10
249 G 30–90 n.s 14 10
250 G 10–60 174 142 63
257 G 20–73 81 103 53
259 G n.a n.s v10 v10
260 G 43–148 v10
261 S n.s 25 28
263 S n.s 30 20
276 G 29–72 10 55 34
286 G n.a n.s. 14 16
304 BF 27 30 28
1018 G 40–80 v10 n.s 48
1052 G n.a 10 10 10
1053 G n.a 13 19 14
1176 G 9–19 10 v10 v10
1181 S 181 3158 n.s
1183 S 424 330 n.s
1184 BF 42 33 25
1185 G n.a. v10 n.s n.s
1191 S 18 11 n.s
a
BF, Bank filtrate water; G, ground water; S, surface water. b
Upper–lower side; n.a., information not available. c
n.s., not sampled.
J. Environ. Monit., 2003, 5, 885–890 887
charcoal tubes were heated for at least 1 h at a temperature of
200 uC with a flow of nitrogen and, the water used for
validation was firstly purged and heated to at least 80 uC for
about 10 min.
Validation. Before operation, the method was validated by
means of a calibration curve (range 0–1000 ng l21
) where all
calibration standards were analyzed in quadruplicate to
determine the precision and accuracy of the procedure.
The validation of the study consisted of (i) the processing all
samples in duplicate, (ii) analysis of samples within 48 h after
sampling, (iii) the analysis of a number of samples (n ~ 12)
delivered as blind duplicates, (iv) the analysis of at least one
RIVM drinking water as a blank and at least one drinking
water spiked at a level of 100 ng l21
during the processing of
each analytical series of samples, and (v) the analysis
of transported RIVM drinking water sampled at a number
of pumping station locations.
Results and discussion
Results of surveys
The MTBE concentrations of the water samples of all
individual sampling sites of both the first and the second
survey are listed in Table 1.
As regards both the first (I) and second (II) survey, an
overview of the concentration ranges found in the various types
of water samples is given in Table 2. As can be seen from this
Table, the two bank filtrate samples contained low levels of
MTBE and that in 7 out of 8 surface water samples MTBE was
found with a median concentration of 30 ng l21
.
In the 53 ground water samples investigated, the MTBE
concentration was 21 times below the level of 10 ng l21
, in
27 samples the MTBE concentration ranged between 10 and
100 ng l21
, in three samples between 120 and 180 ng l21
and in
one sample MTBE was found at a level of 410 ng l21
.
In the second screening, 49 raw water and 45 drinking water
samples were collected from in total 50 different locations
including the 40 sites positively found at the first screening.
The highest concentration of MTBE (3 200 ng l21
) was found
at the river Lek intake location (Nieuwegein) located nearby a
landing place of boats. It is assumed that such a sample
location can lead to considerable variation in MTBE
concentration due to cleaning activities.
The concentrations of MTBE in the raw bank filtrate water
and ground water samples were relatively low with values for
the median of 42 and 10 ng l21
, respectively.
In almost all drinking water samples, the concentration of
MTBE was low (v150 ng l21
) and at 10 locations the
concentration was below the reporting limit (v10 ng l21
). One
must bear in mind that the second screening involved the
selection of positive raw water locations. In most cases the
concentration of MTBE in the drinking water was lower in
comparison to the corresponding (raw) water of the source. A
clear exception was the presence of MTBE at a concentration
of 300 ng l21
in the raw water of one of the wells while the
produced drinking water contained 2 860 ng l21
of MTBE.
Analysis of the six individual wells of the station revealed a
concentration of 11 900 ng l21
of MTBE. According to Klinger
et al.6
such a high concentration indicates a source point
contamination, which appeared to be caused by a nearby petrol
station recently reconstructed. Obviously, this well was further
monitored including the analysis of BTEX. However, only
benzene was occasionally found at low concentrations (about
100 ng l21
). This clearly demonstrates the large difference in
mobility in ground water between BTEX compounds and
MTBE that can be obtained making it difficult to draw a
correlation between the occurrence of these compounds. This
difficulty has been reported earlier.6,15
This case further shows
that, an unfavorable ratio of the MTBE concentration in the
raw water and drinking water of a station might indicate the
presence of point source contamination(s).
The correlation between the MTBE concentrations in raw
water samples (excluding sample site 226)) of the same source
in two successive periods is shown in Fig. 1. A highly significant
correlation (p v 0.0001) is found, however, for individual
points considerable variance is present. The value 1.0 of the
slope of the regression line indicates that no systematic
difference between the levels for the two periods is found.
However, one should be aware for local sources of variations in
time.
The correlation between the concentrations of MTBE in raw
and drinking waters (excluding sampling site 226) is shown in
Fig. 2. The correlation is higher than the correlation found
between raw water of different periods. This is consistent with
the hypothesis that levels in drinking water are predominantly
caused by the levels in the water samples of the raw material.
The slope of the trend line is found to be 0.60 indicating a
decrease of the MTBE concentration after purification with
approximately 40%.
The collection of the precise information on the applied
purification processes of all sampling sites was not included in
the design of this study making it not possible to adequately
investigate the effect of various purification steps on the
reduction of MTBE concentration. Only for six sampling sites
(limited) information was collected and the results are given in
Table 3. Statistically evaluation (Anova, Single Factor) of the
data showed a significant effect of the first step (raw water –
ozone) on the reduction of the MTBE concentration. However,
as regards the other two steps, ozone–carbon and carbon–
drinking water the reduction of the MTBE concentration was
not significant. Therefore, considering both the limited amount
of data and the uncertainty due to the low concentration of
MTBE in the raw water (v50 ng l21
) of the samples, a clear
conclusion cannot be made.
Performance of analytical method
Over the tested range (0–1000 ng l21
) the calibration plot was
linear (r ~ 0.9999) and the RSDs of the MTBE signals of the
five calibration points were below 8% (n ~ 4, each point). In
total 20 series of samples were analyzed involving 23 recovery
experiments (spiking level, 100 ng l21
) and 23 blank water
samples. The average recovery was 110% with an RSD of 5%;
Table 2 Results of first (I) second (II) survey
Type of water
Number of
samples (n)
Lowest
concentration/ng l21
Highest
concentration/ng l21
Median
concentration/ng l21
Number of samples
below RLa
I II I II I II I II I II
Surface water 8 9 v10 v10 420 3200 30 29 1 0
Bank filtration 2 4 27 30 42 220 35 42 0 0
Ground water 53 36 v10 v10 410 300 6 10 21 15
Drinking water 45 v10 2900 20 10
a
RL, reporting level of 10 ng l21
.
888 J. Environ. Monit., 2003, 5, 885–890
the average concentration of the blank was 3.8 ng l21
with
standard deviation of 1.1 ng l21
As part of the validation, all samples were processed
in duplicate. The overall variation of within the dupli-
cate results is assumed to be made up of a concentration-
independent part and a part that is proportional to the
concentration. The first part can be calculated from the
pooled standard deviation of all samples with concentration
below 10 ng l21
(n ~ 59) and was found to be 0.9 ng l21
. From
this result a limit of detection of 2.6 ng l21
(3 6 STD) can be
calculated. Hence, the reporting level of 10 ng l21
is a
conservative estimate of the performance of the analytical
method.
The second part of the variance is calculated from the overall
relative standard deviation of samples with concentrations
greater than 10 ng l21
and was 6.9% illustrating the good
overall performance (repeatability) of the method.
Conclusion
The samples investigated in the first comprehensive survey
carried out in The Netherlands showed that in raw water used
for the preparation of drinking water, MTBE was found at very
low concentrations at bank filtration sites (median of 38 ng l21
,
n ~ 6) and at ground water sites (median of 8 ng l21
; n ~ 88)
and at relatively low concentrations at surface water sites
(median of 29 ng l21
, n ~ 17). For example, in comparison to
the risk assessment made by the European Council Regulation
(EEC, 793/93), the highest value of 3 200 ng l21
of MTBE in a
surface water sample is at least 5 times below the odor
threshold of 15 000 ng l21
.
With one exception, in drinking water, the MTBE concen-
tration was always lower than the corresponding raw water
indicating the generally low level of MTBE level in Dutch
drinking water.
Fig. 1 Correlation of the MTBE content in raw water samples of the first and second survey.
Fig. 2 Correlation of the MTBE content in raw water and drinking water samples of the second survey.
Table 3 MTBE concentrations (ng l21
) after different purification steps (see Experimental)
Type of water Sampling site Raw water Ozonisation Chlorination Carbon filtration Drinking water
Surface 16 27 13 10 10
Bank filtrate 53b 50 30 10 10
Surface 182 19 10 14
Surface 261 25 20 30 28
Surface 263 30 20 20 20
Bank filtrate 1184 33 30 30 25
J. Environ. Monit., 2003, 5, 885–890 889
The interesting relation between MTBE contamination and
BTEX contamination could not be made due to the lack of
sufficient BTEX data at the time of this study.
At one location a high concentration of MTBE was found in
an individual well as a result of a point source contamination
caused by a historical spill of a reconstructed petrol station.
This clearly demonstrates the risk of MTBE contamination due
its high mobility in soil and ground water, emphasizing that
continuously monitoring of this compound is highly desirable,
at least nearby filling and petrol stations with a risk of spills.
The developed procedure using off-line purge and trap and
thermal desorption sampling hyphenated to GC-MS provided
efficient, reliable and sensitive analysis of MTBE in various
types of water samples.
References
1 Drinking water advisory: Consumer acceptability Advice and Health
Effects Analysis on Methyl Teteriary-Butyl Ether (MtBE), Fact
sheet EPA-822-F-97-009, Environmental Protection Agency,
USA, 1997.
2 R. W. Gullick and M. W. LeChevallier, J. Am. Water Works
Assoc., 2000, 92, 100.
3 R. Johnson, J. Pankow, D. Render, C. Price and J. Zogorski,
Environ. Sci. Technol./News, 2000, 2A.
4 C. Achten, A. Kolb, W. Pu¨ttmann, P. Seel and R. Gihr, Environ.
Sci. Technol., 2002, 36, 3652.
5 C. Achten, A. Kolb and W. Pu¨ttmann, Environ. Sci. Technol.,
2002, 36, 3662.
6 J. Klinger, C. Stieler, F. Sacher and H.-J. Brauch, J. Environ.
Monit., 2002, 4, 276.
7 A. A. M. Langehoff, Methyl tertiary-butyl ether (MTBE), and its
occurrence in The Netherlands, TNO-report R2000/189, TNO-
MEP, Apeldoorn, The Netherlands, 2000.
8 T. C. Schmidt, H.-A. Duong, M. Berg and S. B. Haderlein,
Analyst, 2001, 126, 405.
9 U.S. Environmental Protection Agency, Method 8260B Volatile
Organic Compounds by Gas Chromatorgraphy/Mass Selector
(GC/MS, Revision 2, p 1–86, 1996, at URL http://www.epa.gov.
epaoswer/hazwaste/test/8260.htm.
10 R. A. Halden, A. M. Happel and S. R. Schoen, Environ. Sci.
Technol, 2001, 35, 1469.
11 L. Zwank, C. Torsten, T. C. Schmidt, S. B. Haderlein and M. Berg,
Environ. Sci. Technol., 2002, 36, 2054.
12 C. D. Chruch, L. M. Isabell, J. F. Pankow, D. L. Rose and
P. G. Tratnyek, Environ. Sci. Technol., 1997, 31, 3723.
13 S. M. Pyle and A. B. Marcus, Int. J. Environ. Anal. Chem., 2000,
76, 17.
14 F. Bianchi, M. Careri, E. Marengo and M. Musci, J. Chromatogr.,
A, 2002, 975, 113.
15 S. Lacorte, L. Olivella, M. Rosell, M. Figueras, A. Ginebreda and
D. Barcelo´, Chromatographia, 2002, 56, 739.
16 B. Nouri, B. Fouillet, G. Toussaint, R. Chambon and P. Chambon,
J. Chromatogr., A, 1996, 726, 153.
17 D. T. O’Neill, E. A. Rochette and P. J. Ramsey, Anal. Chem.,
2002, 74, 5907.
18 C. Achten and W. Pu¨ttmann, Environ. Sci. Technol., 2000, 34,
1359.
19 D. A. Cassada, Y. Zhang, D. D. Snow and R. F. Spalding, Anal.
Chem., 2000, 72, 4654.
20 F. Piazza, A. Barbieri, F. S. Violante and A. Roda, Chemosphere,
2001, 44, 539.
21 R. B. Gaines, E. B. Ledford, Jr. and J. D. Stuart, J. Microcolumn
Sep., 1998, 10, 597.
22 C. Achten, A. Kolb and W. Pu¨ttmann, Fresenius J. Anal. Chem.,
2001, 371, 519.
890 J. Environ. Monit., 2003, 5, 885–890

JEM MTBE artikel b305187k

  • 1.
    Survey of theoccurrence of residues of methyl tertiary butyl ether (MTBE) in Dutch drinking water sources and drinking water Pepijn Morgenstern,a Ans F. M. Versteegh,a Gert A. L. de Korte,b Ronald Hoogerbrugge,b Dennis Mooibroek,b Andre´ Banninkc and Elbert A. Hogendoorn*b a National Institute for Public Health and the Environment (RIVM), Center for Inspectorate Research, Emergency Response and Drinking Water, PO Box 1, 3720 BA Bilthoven, The Netherlands b National Institute for Public Health and the Environment (RIVM), Laboratory for Analytical Chemistry , The Netherlands. E-mail: elbert.hogendoorn@rivm.nl; Fax: 131 30 2744424 c The Netherlands Waterworks Association (VEWIN), PO Box 1019, 2280 CA Rijswijk, The Netherlands Received 8th May 2003, Accepted 3rd September 2003 First published as an Advance Article on the web 6th October 2003 An indicative survey has been carried out in The Netherlands investigating the presence of methyl tertiary butyl ether (MTBE) in drinking water and the corresponding sources. In total, 71 different sites used for the preparation of drinking water in The Netherlands were sampled in two successive seasons in 2001 involving the analysis of 156 samples. (ground water (n ~ 88), surface water (n ~ 17), bank filtrate water (n ~ 6) and drinking water (n ~ 45)). To combine high sample throughput with high selectivity and sensitivity, off-line purge and trap for sampling and gas chromatography mass spectrometry equipped with an automated thermal desorption sampler (TDS-GC-MS) was selected as the preferred analytical methodology. The developed procedure enabled the analysis of at least 40 samples per day and provided a limit of quantification of 2 ng l21 . In the first period 63 samples of raw water were analyzed. Concentrations ranged between v10 ng l21 and 420 ng l21 with a median concentration below 10 ng l21 . The second period was focused at the re-sampling of positive locations (MTBE w 10 ng l21 ) and a few additional drinking water utilities of which both the raw and drinking water of the utilities were analyzed. The median concentration of MTBE in the selected set of drinking water samples was 20 ng l21 (n ~ 45). At one location MTBE was found at a level of 2 900 ng l21 caused by point source contamination of the ground water (11 900 ng l21 ). Special attention has been paid to the quality of the results by analyzing all samples in duplicate and the analysis of control samples during each series of analyses. Introduction Since the introduction in the late 1970’s, methyl tertiary butyl ether (MTBE) has been progressively and successfully used in the United States (US) and the European Union (EU) as an oxygenate additive in gasoline to enhance the octane index and improve combustion efficiency. However, the success of MTBE is counteracted by its potential threat to contaminate drinking water sources, most importantly by the possible leaks from underground and above ground petroleum storage tank systems. Due to its small molecular size and relatively high solubility in water, MTBE moves rapidly in ground water, faster than other constituents of gasoline. This phenomenon can result in so- called point-source contamination of wells. Non-point sources, such as watercraft and air deposition via vehicle or industrial emissions contribute to the contamination of surface water.1 Reviews2,3 on the occurrence of MTBE in drinking water sources in the US clearly reveal that the presence of MTBE is a concern and conclude that problems can be expected to worsen if the use of MTBE is still expanding. In comparison with the US, the amount of MTBE additive in European petrol is distinctly less. However, a complete EU inventory on MTBE in ground water is not available yet. Recently, monitoring results became available about the occurrence of MTBE in Germany at locations involving river and waste water,4 riverbank filtered water and related drinking water,5 and ground water.6 In 1987, the Soil Protection Act came into force in The Netherlands. This legislation enforced all petrol stations to reconstruct paving in such a way that petrol cannot leak into the soil anymore and to clean existing soil contaminations. This process was finalized in the mid 1990’s and included the closure of a lot of small petrol stations; hence, gasoline-soil pollutions were not expected to be a large problem in The Netherlands. However, in a preliminary study carried out in The Nether- lands in 1999 and involving the analyses of a few ground water samples near petrol stations, MTBE contaminations were found in two out of the four locations investigated.7 In order to be more actually and comprehensively informed, our Institute in cooperation with The Netherlands Waterworks Association (VEWIN) conducted a priority study on the occurrence of MTBE in drinking water sources and drinking water in between assignment of the Inspectorate of the Ministry of Housing, Spatial Planning and the Environment (VROM). It must be notified that additional information on the presence of metabolites of MTBE and other gasoline-soil pollution such benzene, toluene, xylenes will be relevant and valuable. However, expecting low contamination levels as a result of the enforcement of the Dutch Soil Protection Act and the need to supply MTBE data as soon as possible, these compounds were on purpose not included in this study. The strategy consisted of the measurement of MTBE in most of the vulnerable ground and surface water sites used for the production of drinking water, followed by a second screening DOI: 10.1039/b305187k J. Environ. Monit., 2003, 5, 885–890 885 This journal is # The Royal Society of Chemistry 2003
  • 2.
    involving the re-samplingof the raw water of all positive locations (MTBE concentration w10 ng l21 ) and their drinking water. Because of the urgency to be informed and the required reliability of data, selectivity and sensitivity (reporting level of 10 ng l21 ), special considerations were made in the selection of the applied methodology. Recently, the pros and cons of various analytical methodol- ogies for the analysis of both fuel oxygenates and metabolites in the environmental matrices water and air have been reviewed.8 On-line purge and trap (P&T) gas chromatography with mass spectrometry (GC-MS) is frequently and routinely applied for the analysis of MTBE in water samples.6,9,10 However, this robust and selective procedure does not provide the required sensitivity as well as approach of direct aqueous injection.11–13 Attractive upcoming approaches providing improved effi- ciency are the head space technique14–16,17 and solid-phase micro extraction (SPME) hyphenated to GC-MS. The latter technique performs SPME direct in water8,18–20 or in the headspace mode.4,5,21,22 As regards simplicity and automation and a reported limit of detection of around 10 ng l21 , these techniques are both attractive. Unfortunately, these techniques were not available at our laboratory at the time of this study. Therefore, it was decided to employ off-line P&T as an efficient technique for the simultaneous extraction of MTBE out of six relatively large volumes of samples in less than 20 min followed by the automated analyses of the trapping tubes employing an Automated Thermal Desorption system coupled to GC-MS. This approach enabled a sample throughput of more than 40 samples per day and provided a limit of detection of 2 ng l21 . Experimental Sampling. The selection of the treatment plants where drinking water is produced included almost all points used for the intake of surface water and the majority of vulnerable ground water and bank filtrate water sources. An anonymous overview of sampling sites is made in Table 1 and includes information about the depth of the filter of the water withdrawn from ground water locations. The project consisted of two series of samplings carried out in the summer and autumn of 2001. The first screening involved the sampling of 63 locations of pumping stations, in which only raw (source) water samples were taken. In a second series both raw water and drinking water were sampled at the positive locations (MTBE content w10 ng l21 ), together with a few new locations, which could not be analyzed in the first series. Additionally, at a few locations individual wells were sampled and at six stations samples were taken corresponding to the steps of the treatment process. Water samples were collected in 250 ml glass bottles using standard water sampling techniques for volatile organic compounds. After collection, samples were immediately stored under dark and cool (approximately 4 uC) conditions and analyzed within 48 h. Depending on the type of water and location the following purification steps are usually applied: Ground water: pH correction, aeration and ‘rapid’ sand filtration. Surface water: before storage in open reservoirs or dunes first treatment consists of pH-correction, coagulation/flocculation and rapid sand filtration. The additional purification at the treatment plant usually consists of one or more of the following steps (i) granular activated carbon filtration, (ii) rapid sand filtration, (iii) ozonisation, (iv) aeration and (v) disinfection by means of a slow sand filtration or the use of chlorine (Cl2). At one location, surface water is not stored before use but directly undergoes a treatment consisting of a combination of an ultra- filtration and a reverse osmosis step. Bank filtration water: This water is extracted from wells near a river of a lake and, therefore, consists of both infiltrated surface water and ground water. With exclusion of the storage step, purification steps are similar to those applied for surface water. Standards, materials and instruments. Methyl tertiary butyl ether (MTBE) and its isotopic analogue d3-MTBE were bought as high purity standard solutions of 10 mg ml21 from Merck and Aldrich, respectively. For calibration and validation experiments, the MTBE solution was diluted at concentrations of 10, 100 and 1000 ng l21 and for the use of internal standard, d3-MTBE was diluted to a concentration of 1 mg ml21 . The dilution steps were performed with methanol. For their use as an internal standard or recovery experiments, a volume of 10 ml of the methanol standard solutions was added to a volume of 100 ml of water sample. The standard solutions and stock solution were kept at approximately 4 uC and approximately 225 uC, respectively. Carbopack B, 60/80 mesh was used as material (150 mg) for the trapping glass tubes used for trapping and thermal desorption and conditioned as described below. After conditioning the tubes were capped and stored at room temperature. A six position purge and trap system model 6/100 of Euroglass was used for trapping and an Automated Thermo Desorber (ATD) TurboMatrix of Perkin Elmer for the desorption. The ATD system was coupled to a model TOP Series 8000 gas chromatography of Fisons equipped with a 30 m DB-5MS capillary column (0.25 mm) with a film thickness of 0.25 mm, and hyphenated to a model MD 800 mass spectro- meter of Interscience (VG Masslab) Sample pre-treatment. A 100 ml aliquot of water is introduced to the purge vessel of the purge and trap (P&T) system. After adding 10 ml of the d3-MTBE (10 ng) internal standard solution, the sample was purged with nitrogen for 30 min at a flow rate of 50 ml min21 at a temperature of 80 uC. During each P&T series, one or two positions were used to process blank water sample(s). After P&T, the Carbopack cartridges were removed from the coolers and capped before analyzing. Instrumental analysis. The collected P&T sample tubes were placed in the turret of the ATD. The samples were automatically processed involving (i) desorption of compounds with an inert gas at elevated temperature (200 uC), (ii) concentration of the compounds in a cold trap at 230 uC, and (iii) the transfer of compounds to the GC column through a heated transfer line (175 uC) by rapidly heating the cold trap to 300 uC. In order to suppress band broadening of MTBE, a split mode with a ratio of 1:5 and a 0.32 mm (inner diameter) fused silica transfer liner was used. The GC column temperature was first held at 40 uC for 5 min then increased to 180 uC at a rate of 20 uC min21 and held for 5 min at the final temperature. Helium served as carrier gas at a pressure of 80 kPa. Scanning of the EI fragments was performed in full scan mode with a scan range of 40–110 m/z. Mass chromatography of m/z 73 and m/z 76 in full scan mode was used for the quantification of MTBE by the internal standard d3-MTBE respectively. General precautions. Occasionally, a low concentration of MTBE was found (about 3 ng l21 ) in purified water indicating the possibility of air contamination. Therefore, before use, the 886 J. Environ. Monit., 2003, 5, 885–890
  • 3.
    Table 1 MTBEconcentration in the water samples (ng l21 ) of the indivuidual sampling sites Code of Type of a Depth of MTBE content of first survey/ng l21c MTBE content of second survey/ng l21c sampling site water filterb /m Raw water Raw water Drinking water 11 G 2–83 23 24 21 16 S 32 270 10 22 G 26–107 v10 n.s n.s 28 G 28–50 v10 n.s n.s 39 G –85 v10 n.s n.s 42 G 50–62 v10 n.s n.s 53 S 177 245 n.s 53 BF n.s 50 10 64 G 11–28 36 29 26 69 G 24–147 12 v10 v10 70 G 32–77 95 v10 v10 73 G 50–65 122 106 61 79 G 13–29 10 10 10 87 S 126 154 n.s 93 G 27–31 176 160 100 94 BF n.s 220 140 98 S v10 n.s n.s 105 G –67 v10 n.s n.s 115 G 25–27 161 169 126 124 G 8–100 10 10 10 126 G n.a. n.s 15 15 130 G 19–90 v10 n.s n.s 138 G 9–19 v10 n.s n.s 139 G 3–27 v10 n.s n.s 140 G 20–60 v10 n.s n.s 160 G 53–183 v10 n.s n.s 161 G 25–61 v10 n.s n.s 165 G n.a. n.s 15 25 169 G n.a. n.s 10 10 177 G 65–113 v10 n.s n.s 178 G 24–76 v10 n.s n.s 180 G 48–75 10 50 57 182 S 20 19 14 198 G 23–65 13 25 26 199 G 33–47 412 209 133 201 G 8–18 45 10 10 202 G 36–62 48 v10 13 205 G 7–64 80 34 21 209 G 10–28 10 10 10 214 G 15–40 11 10 10 215 G 12–52 10 10 10 216 G 18–34 51 46 14 217 G 17–36 v10 n.s n.s 218 G 17–30 n.s 35 38 219 G 21–39 v10 n.s n.s 220 G 17–37 v10 n.s n.s 223 G 20–34 v10 n.s n.s 226 G 21–40 v10 n.s n.s 227 G 15–44 103 300 2860 231 G 39–82 10 85 28 232 G 29–75 v10 n.s n.s 240 G 28–65 10 10 10 242 G 14–31 10 10 10 249 G 30–90 n.s 14 10 250 G 10–60 174 142 63 257 G 20–73 81 103 53 259 G n.a n.s v10 v10 260 G 43–148 v10 261 S n.s 25 28 263 S n.s 30 20 276 G 29–72 10 55 34 286 G n.a n.s. 14 16 304 BF 27 30 28 1018 G 40–80 v10 n.s 48 1052 G n.a 10 10 10 1053 G n.a 13 19 14 1176 G 9–19 10 v10 v10 1181 S 181 3158 n.s 1183 S 424 330 n.s 1184 BF 42 33 25 1185 G n.a. v10 n.s n.s 1191 S 18 11 n.s a BF, Bank filtrate water; G, ground water; S, surface water. b Upper–lower side; n.a., information not available. c n.s., not sampled. J. Environ. Monit., 2003, 5, 885–890 887
  • 4.
    charcoal tubes wereheated for at least 1 h at a temperature of 200 uC with a flow of nitrogen and, the water used for validation was firstly purged and heated to at least 80 uC for about 10 min. Validation. Before operation, the method was validated by means of a calibration curve (range 0–1000 ng l21 ) where all calibration standards were analyzed in quadruplicate to determine the precision and accuracy of the procedure. The validation of the study consisted of (i) the processing all samples in duplicate, (ii) analysis of samples within 48 h after sampling, (iii) the analysis of a number of samples (n ~ 12) delivered as blind duplicates, (iv) the analysis of at least one RIVM drinking water as a blank and at least one drinking water spiked at a level of 100 ng l21 during the processing of each analytical series of samples, and (v) the analysis of transported RIVM drinking water sampled at a number of pumping station locations. Results and discussion Results of surveys The MTBE concentrations of the water samples of all individual sampling sites of both the first and the second survey are listed in Table 1. As regards both the first (I) and second (II) survey, an overview of the concentration ranges found in the various types of water samples is given in Table 2. As can be seen from this Table, the two bank filtrate samples contained low levels of MTBE and that in 7 out of 8 surface water samples MTBE was found with a median concentration of 30 ng l21 . In the 53 ground water samples investigated, the MTBE concentration was 21 times below the level of 10 ng l21 , in 27 samples the MTBE concentration ranged between 10 and 100 ng l21 , in three samples between 120 and 180 ng l21 and in one sample MTBE was found at a level of 410 ng l21 . In the second screening, 49 raw water and 45 drinking water samples were collected from in total 50 different locations including the 40 sites positively found at the first screening. The highest concentration of MTBE (3 200 ng l21 ) was found at the river Lek intake location (Nieuwegein) located nearby a landing place of boats. It is assumed that such a sample location can lead to considerable variation in MTBE concentration due to cleaning activities. The concentrations of MTBE in the raw bank filtrate water and ground water samples were relatively low with values for the median of 42 and 10 ng l21 , respectively. In almost all drinking water samples, the concentration of MTBE was low (v150 ng l21 ) and at 10 locations the concentration was below the reporting limit (v10 ng l21 ). One must bear in mind that the second screening involved the selection of positive raw water locations. In most cases the concentration of MTBE in the drinking water was lower in comparison to the corresponding (raw) water of the source. A clear exception was the presence of MTBE at a concentration of 300 ng l21 in the raw water of one of the wells while the produced drinking water contained 2 860 ng l21 of MTBE. Analysis of the six individual wells of the station revealed a concentration of 11 900 ng l21 of MTBE. According to Klinger et al.6 such a high concentration indicates a source point contamination, which appeared to be caused by a nearby petrol station recently reconstructed. Obviously, this well was further monitored including the analysis of BTEX. However, only benzene was occasionally found at low concentrations (about 100 ng l21 ). This clearly demonstrates the large difference in mobility in ground water between BTEX compounds and MTBE that can be obtained making it difficult to draw a correlation between the occurrence of these compounds. This difficulty has been reported earlier.6,15 This case further shows that, an unfavorable ratio of the MTBE concentration in the raw water and drinking water of a station might indicate the presence of point source contamination(s). The correlation between the MTBE concentrations in raw water samples (excluding sample site 226)) of the same source in two successive periods is shown in Fig. 1. A highly significant correlation (p v 0.0001) is found, however, for individual points considerable variance is present. The value 1.0 of the slope of the regression line indicates that no systematic difference between the levels for the two periods is found. However, one should be aware for local sources of variations in time. The correlation between the concentrations of MTBE in raw and drinking waters (excluding sampling site 226) is shown in Fig. 2. The correlation is higher than the correlation found between raw water of different periods. This is consistent with the hypothesis that levels in drinking water are predominantly caused by the levels in the water samples of the raw material. The slope of the trend line is found to be 0.60 indicating a decrease of the MTBE concentration after purification with approximately 40%. The collection of the precise information on the applied purification processes of all sampling sites was not included in the design of this study making it not possible to adequately investigate the effect of various purification steps on the reduction of MTBE concentration. Only for six sampling sites (limited) information was collected and the results are given in Table 3. Statistically evaluation (Anova, Single Factor) of the data showed a significant effect of the first step (raw water – ozone) on the reduction of the MTBE concentration. However, as regards the other two steps, ozone–carbon and carbon– drinking water the reduction of the MTBE concentration was not significant. Therefore, considering both the limited amount of data and the uncertainty due to the low concentration of MTBE in the raw water (v50 ng l21 ) of the samples, a clear conclusion cannot be made. Performance of analytical method Over the tested range (0–1000 ng l21 ) the calibration plot was linear (r ~ 0.9999) and the RSDs of the MTBE signals of the five calibration points were below 8% (n ~ 4, each point). In total 20 series of samples were analyzed involving 23 recovery experiments (spiking level, 100 ng l21 ) and 23 blank water samples. The average recovery was 110% with an RSD of 5%; Table 2 Results of first (I) second (II) survey Type of water Number of samples (n) Lowest concentration/ng l21 Highest concentration/ng l21 Median concentration/ng l21 Number of samples below RLa I II I II I II I II I II Surface water 8 9 v10 v10 420 3200 30 29 1 0 Bank filtration 2 4 27 30 42 220 35 42 0 0 Ground water 53 36 v10 v10 410 300 6 10 21 15 Drinking water 45 v10 2900 20 10 a RL, reporting level of 10 ng l21 . 888 J. Environ. Monit., 2003, 5, 885–890
  • 5.
    the average concentrationof the blank was 3.8 ng l21 with standard deviation of 1.1 ng l21 As part of the validation, all samples were processed in duplicate. The overall variation of within the dupli- cate results is assumed to be made up of a concentration- independent part and a part that is proportional to the concentration. The first part can be calculated from the pooled standard deviation of all samples with concentration below 10 ng l21 (n ~ 59) and was found to be 0.9 ng l21 . From this result a limit of detection of 2.6 ng l21 (3 6 STD) can be calculated. Hence, the reporting level of 10 ng l21 is a conservative estimate of the performance of the analytical method. The second part of the variance is calculated from the overall relative standard deviation of samples with concentrations greater than 10 ng l21 and was 6.9% illustrating the good overall performance (repeatability) of the method. Conclusion The samples investigated in the first comprehensive survey carried out in The Netherlands showed that in raw water used for the preparation of drinking water, MTBE was found at very low concentrations at bank filtration sites (median of 38 ng l21 , n ~ 6) and at ground water sites (median of 8 ng l21 ; n ~ 88) and at relatively low concentrations at surface water sites (median of 29 ng l21 , n ~ 17). For example, in comparison to the risk assessment made by the European Council Regulation (EEC, 793/93), the highest value of 3 200 ng l21 of MTBE in a surface water sample is at least 5 times below the odor threshold of 15 000 ng l21 . With one exception, in drinking water, the MTBE concen- tration was always lower than the corresponding raw water indicating the generally low level of MTBE level in Dutch drinking water. Fig. 1 Correlation of the MTBE content in raw water samples of the first and second survey. Fig. 2 Correlation of the MTBE content in raw water and drinking water samples of the second survey. Table 3 MTBE concentrations (ng l21 ) after different purification steps (see Experimental) Type of water Sampling site Raw water Ozonisation Chlorination Carbon filtration Drinking water Surface 16 27 13 10 10 Bank filtrate 53b 50 30 10 10 Surface 182 19 10 14 Surface 261 25 20 30 28 Surface 263 30 20 20 20 Bank filtrate 1184 33 30 30 25 J. Environ. Monit., 2003, 5, 885–890 889
  • 6.
    The interesting relationbetween MTBE contamination and BTEX contamination could not be made due to the lack of sufficient BTEX data at the time of this study. At one location a high concentration of MTBE was found in an individual well as a result of a point source contamination caused by a historical spill of a reconstructed petrol station. This clearly demonstrates the risk of MTBE contamination due its high mobility in soil and ground water, emphasizing that continuously monitoring of this compound is highly desirable, at least nearby filling and petrol stations with a risk of spills. The developed procedure using off-line purge and trap and thermal desorption sampling hyphenated to GC-MS provided efficient, reliable and sensitive analysis of MTBE in various types of water samples. References 1 Drinking water advisory: Consumer acceptability Advice and Health Effects Analysis on Methyl Teteriary-Butyl Ether (MtBE), Fact sheet EPA-822-F-97-009, Environmental Protection Agency, USA, 1997. 2 R. W. Gullick and M. W. LeChevallier, J. Am. Water Works Assoc., 2000, 92, 100. 3 R. Johnson, J. Pankow, D. Render, C. Price and J. Zogorski, Environ. Sci. Technol./News, 2000, 2A. 4 C. Achten, A. Kolb, W. Pu¨ttmann, P. Seel and R. Gihr, Environ. Sci. Technol., 2002, 36, 3652. 5 C. Achten, A. Kolb and W. Pu¨ttmann, Environ. Sci. Technol., 2002, 36, 3662. 6 J. Klinger, C. Stieler, F. Sacher and H.-J. Brauch, J. Environ. Monit., 2002, 4, 276. 7 A. A. M. Langehoff, Methyl tertiary-butyl ether (MTBE), and its occurrence in The Netherlands, TNO-report R2000/189, TNO- MEP, Apeldoorn, The Netherlands, 2000. 8 T. C. Schmidt, H.-A. Duong, M. Berg and S. B. Haderlein, Analyst, 2001, 126, 405. 9 U.S. Environmental Protection Agency, Method 8260B Volatile Organic Compounds by Gas Chromatorgraphy/Mass Selector (GC/MS, Revision 2, p 1–86, 1996, at URL http://www.epa.gov. epaoswer/hazwaste/test/8260.htm. 10 R. A. Halden, A. M. Happel and S. R. Schoen, Environ. Sci. Technol, 2001, 35, 1469. 11 L. Zwank, C. Torsten, T. C. Schmidt, S. B. Haderlein and M. Berg, Environ. Sci. Technol., 2002, 36, 2054. 12 C. D. Chruch, L. M. Isabell, J. F. Pankow, D. L. Rose and P. G. Tratnyek, Environ. Sci. Technol., 1997, 31, 3723. 13 S. M. Pyle and A. B. Marcus, Int. J. Environ. Anal. Chem., 2000, 76, 17. 14 F. Bianchi, M. Careri, E. Marengo and M. Musci, J. Chromatogr., A, 2002, 975, 113. 15 S. Lacorte, L. Olivella, M. Rosell, M. Figueras, A. Ginebreda and D. Barcelo´, Chromatographia, 2002, 56, 739. 16 B. Nouri, B. Fouillet, G. Toussaint, R. Chambon and P. Chambon, J. Chromatogr., A, 1996, 726, 153. 17 D. T. O’Neill, E. A. Rochette and P. J. Ramsey, Anal. Chem., 2002, 74, 5907. 18 C. Achten and W. Pu¨ttmann, Environ. Sci. Technol., 2000, 34, 1359. 19 D. A. Cassada, Y. Zhang, D. D. Snow and R. F. Spalding, Anal. Chem., 2000, 72, 4654. 20 F. Piazza, A. Barbieri, F. S. Violante and A. Roda, Chemosphere, 2001, 44, 539. 21 R. B. Gaines, E. B. Ledford, Jr. and J. D. Stuart, J. Microcolumn Sep., 1998, 10, 597. 22 C. Achten, A. Kolb and W. Pu¨ttmann, Fresenius J. Anal. Chem., 2001, 371, 519. 890 J. Environ. Monit., 2003, 5, 885–890