
Recommended
Recommended
More Related Content
Similar to J R E R V o l . 2 9 N o . 1 – 2 0 0 7T h e S e c u l a.docx
Similar to J R E R V o l . 2 9 N o . 1 – 2 0 0 7T h e S e c u l a.docx (20)
More from priestmanmable
More from priestmanmable (20)
Recently uploaded
Recently uploaded (20)
J R E R V o l . 2 9 N o . 1 – 2 0 0 7T h e S e c u l a.docx
- 1. J R E R � V o l . 2 9 � N o . 1 – 2 0 0 7 T h e S e c u l a r a n d C y c l i c B e h a v i o r o f ‘ ‘ T r u e ’ ’ C o n s t r u c t i o n C o s t s A u t h o r s Wi l l i a m C . W h e a t o n a n d Wi l l i a m E . S i m o n t o n A b s t r a c t Current construction cost indices typically are derived by applying national weights to local costs for materials and labor. In this study, construction cost indices are developed that are based on actual contractor tenders for projects. As such, they incorporate full variation in factor proportions, as well as factor costs, contractor overhead, and profit. Cost indices are produced for two product types, office and multi-family residential, in six different MSAs using F.W. Dodge project cost data from 1967 through the first half of 2004. Standard ‘‘hedonic’’ analysis is applied to control for variation in project scale and features to extract the true time trends in costs for each market. The findings indicated that real construction costs generally have fallen slightly over the last 35 years. In addition, no correlation is found between costs and building activity. Causal (IV) analysis implies that the construction industry is elastically supplied to local real estate markets, with any ‘‘excess’’ profits going to land and developer entrepreneurship. This is consistent with the traditional ‘‘urban land economics’’ literature.
- 2. This paper develops construction cost indices based upon the actual construction tenders for a very large number of building projects over the 1967–2004 period. Using these indices, two questions are examined. First, there has been much discussion over why the appreciation of most commercial real estate over the 35 year period has been actually slightly less than inflation (Geltner and Miller, 2004). The current paper finds that construction costs have behaved similarly during this time—generally increasing slightly less than overall economic inflation. Real estate markets are widely thought to be mean-reverting around replacement costs and thus to the extent that replacement costs are based mainly on the construction (as opposed to land) component—this paper provides an answer. The second question is to explore if there is a tendency for construction costs to rise cyclically during periods of major building activity. If this is the case, it could suggest that the construction industry is less than elastically supplied to local real estate markets. Whether this is due to inelasticity in the supply of materials and labor, or the whether contractors and construction firms are able to extract short run 2 � W h e a t o n a n d S i m o n t o n profits, cannot be distinguished. In either case, however,
- 3. inelasticity would cast some doubt on the time-honored axiom of modern urban economics that any excess returns go to land or entrepreneurship (Clemhout, 1981; and Blackley, 1999). The analysis is made possible by using the records from the FW Dodge company covering 67,000 building projects in six chosen metropolitan areas, for two major types of buildings: low- to mid-rise office building and garden- type apartments. This is the first time this data has been used to assess cost trends, although Coleman and Gentile (2001) present interesting results about the construction process. With this database, hedonic cost equations are estimated for each market and property type that include several variables related to project scale, building features, and density of development. Yearly fixed effects are used to extract the time tends in these costs. This approach is far broader than that used by several commercial suppliers of construction cost ‘‘indices’’ (ERN, 2004; and RS Means, 2004). These indices generally apply fixed weights to local variation in the costs of the major factors of production: labor and materials. In theory, this approach suffers from two omissions: first, factor proportions may and in fact should vary both cross section and over time with differences in factor costs and secondly,
- 4. construction profit or overhead may vary cyclically to absorb some short run development profits. The results of the analysis are quite pronounced. First, the yearly movement in construction costs is quite small—rarely more than 5%–10% when adjusting for inflation. In fact, the indices are quite smooth. In this regard they look quite similar over the 35 year study period to the factor cost indices of RS Means and ERN. Secondly, over the longer run, there is a gradual trend wherein constant dollar costs have declined for both studied property types, in all but one of the six markets. This too is similar to the long run trends in the indices of the cost vendors. This may help to explain the observation that constant dollar office and apartment rents show no upward trend over a similar 35 year period (DiPasquale and Wheaton, 1992; and Wheaton and Torto, 1994). Finally and perhaps most importantly, virtually no evidence is found that the construction cost indices vary with the level of building activity. A wide range of correlation tests is performed with different lags and there simply is no significant pattern. However, this might be the result of the complicated simultaneity issue suggested by Sommerville (1999). If building activity is negatively related to costs (construction demand) but costs are positively related to
- 5. building activity (construction supply), then reduced form correlations could yield little. This idea is explored with an IV approach using local job growth, national interest rates, and inflation as demand instruments for building activity. The results are little different and this as a strong indication that the construction industry is supplied with almost perfect elasticity to local commercial real estate markets. The paper is organized as follows. First, there is a discussion of the data and the selection of cities and building types. Second, the hedonic equation estimates are S e c u l a r a n d C y c l i c B e h a v i o r � 3 J R E R � V o l . 2 9 � N o . 1 – 2 0 0 7 provided along with the time trends in the data. These are then compared with other construction cost indices. Third, there is a comparison of the movement in costs to the yearly level of building activity data for each of the chosen property types. Finally, the paper closes with concluding remarks. � F. W . D o d g e C o n s t r u c t i o n D a t a The data used in this analysis was made available by F.W. Dodge, a subsidiary of McGraw-Hill Construction. This proprietary data was used with their
- 6. permission and is derived from the company’s business of providing a ‘‘matching process’’ between developers and contractors. The former post requests for bids (from architectural plans to final interior finishing), the latter respond, and after the project is complete, F.W. Dodge assembles all the contracts into a ‘‘project file.’’ From this, total project costs are derived. It should be mentioned that these total ‘‘bid’’ costs are then later followed up by a survey of ‘‘all in’’ costs that presumably covers cost adjustments or over runs. For this study, six MSAs were selected: Chicago, IL; Phoenix, AZ; Denver, CO; Washington, DC; San Diego, CA; and Dallas, TX. Chicago and Washington, DC are traditionally considered more mature cities, while the others have exhibited consistently higher growth over the last 35 years. The Dodge company classifies projects into 25 categories. This paper examines two that were both very prevalent in the data, and in addition represent fairly uniform types of structures. This was low-rise office buildings (2–4 stories) and garden-type apartment properties. The data for these two types included total construction costs for over 80,000 projects. In addition to this project ‘‘filtering,’’ limited descriptive information regarding frame or construction technology, number of stories, and floor area was also included. For apartments, the number of units was also known. The data for the
- 7. Chicago, Dallas, and Washington, DC MSAs begins in 1967. Data for Phoenix and San Diego was available back to 1968, and data for the Denver MSA was only available back to 1969. Of the 80,836 data points collected, approximately 4% were incomplete. Projects that lacked area, cost, or story information were removed from the sample. Data from projects under 2,000 square feet for multi-family and 10,000 square feet for office buildings or over .5 million square feet were also eliminated from the data set. The intent of the study is to develop a construction cost index representative of typical projects, so outliers at the extreme ends of the size spectrum were removed from the sample. The data was then segregated at the MSA and property level, providing twelve different sets of data. After this screening, the office sample size was reduced to 18,469 observations ranging between 1,937 and 3,857 observations per MSA. There were 42,340 apartment observations ranging between 3,777 and 12,259 observations per MSA (Exhibit 1). It certainly is to be expected that construction costs per square foot will vary by project size, and in the case of apartments, project density (units / square foot). 4 � W h e a t o n a n d S i m o n t o n
- 8. E x h i b i t 1 � Number of Observations by Product Type and Location Chicago Dallas Denver Phoenix San Diego Washington, D.C. Total Apartment 12,259 3,777 3,356 5,943 9,301 7,704 42,340 Office 3,857 3,154 1,937 3,344 2,383 3,794 18,469 Number of stories is also often associated with greater foundation and structure costs. The frame type of the property was also included as potentially impacting costs. The F.W. Dodge data included twelve different frame classifications. � C o d e F r a m e T y p e 0 Alterations, non-building, etc. without framing A Load or Wall Bearing (no further description) B Steel C Wood D Concrete E Pre-Fabricated or Pre-Engineered F Other Described Framing Types G Unknown Framing Type (no description) H Steel and Concrete I Load or Wall Bearing and Steel J Load or Wall Bearing and Wood K Load or Wall Bearing and Concrete For this study, records with the ‘0’ code were removed because they are alterations, and not new construction. Records that had unknown or hybrid frame types,
- 9. classified as codes E–K, also were combined into one single ‘‘other’’ category. This was done because most of the structures fall into one of the first four classifications—load bearing, steel, wood, or concrete. Exhibit 2 displays the distribution of frame types by location and product type. The construction cost data does not account for soft costs such as time delays, development, or legal fees. The cost data does cover engineering and architectural fees as those are part of the Dodge matching service. Of course it must be remembered that project specifications and building standards have changed over the years—in many ways not captured by the data. Properties today have improved HVAC systems, Internet wiring, and must follow generally more stringent building codes. All of these omissions generally mean that more recently built projects are ‘‘better’’ in many unmeasured ways. As such, the indices will be biased upwards over time. To build a property in 2003 that is actually comparable to one in 1967 S e c u l a r a n d C y c l i c B e h a v i o r � 5 J R E R � V o l . 2 9 � N o . 1 – 2 0 0 7 E x h i b i t 2 � Frame Type by Location and Product Type MSA Product Type
- 10. Frame Type Loadbearing Steel Wood Concrete Unk / Other Total Chicago Apartment 56.0% 6.3% 23.4% 3.8% 10.4% 100.0% Office 62.1% 20.3% 2.8% 3.8% 11.1% 100.0% Dallas Apartment 58.4% 11.9% 15.2% 3.8% 10.7% 100.0% Office 16.2% 7.7% 66.0% 1.2% 9.0% 100.0% Denver Apartment 52.6% 24.6% 4.9% 6.4% 11.6% 100.0% Office 40.2% 18.8% 25.7% 4.6% 10.7% 100.0% Phoenix Apartment 18.6% 1.1% 37.8% 2.1% 40.5% 100.0% Office 33.1% 20.1% 9.9% 9.4% 27.5% 100.0% San Diego Apartment 25.1% 9.7% 25.2% 5.4% 34.6% 100.0% Office 66.7% 1.0% 21.4% 0.7% 10.3% 100.0% Washington, D.C. Apartment 71.6% 11.3% 5.5% 4.0% 7.6% 100.0% Office 69.1% 6.0% 13.6% 2.3% 9.0% 100.0% would likely cost less than that which is recorded for ‘‘measurably comparable’’ 2003 buildings. � E s t i m a t i o n o f H e d o n i c C o s t s Hedonic regression analysis has long been the favored means of rent and price analysis in the real estate market. After Rosen (1972), hedonic equations have been widely applied to many product differentiated markets (Brown and Rosen, 1982), including single family house prices (Palmquist, 1984),
- 11. and then to commercial rents and prices (Wheaton and Torto, 1994). Hedonic regression has also recently been used to examine construction costs in the residential market by Somerville (1996). There are several options that may be used in creating a hedonic regression model (Cropper, Deck, and McConnell, 1988). Both linear and semi- log models were examined in the current study in relation to COST and COST / SF. In past studies, semi-log models have produced the best results. However, there is debate as to whether COST or COST / SF as the dependent variable provides the best results. The former produces better fits, but the latter tends to have more normally distributed errors. Each of the different regression methods was tested and in this analysis, the model that produced the best statistical results in terms of parameter significance was a semi-log regression of COST / SF. The semi-log regression model expresses the natural log of cost in nominal dollars divided by the total square footage of the project, Ln(COSTSF), as a function of 6 � W h e a t o n a n d S i m o n t o n the number of stories, units, total area, frame type, and year constructed.
- 12. Alternative formulations using floor plate and stories as opposed to area and stories worked identically—as it should when the equation is in semi- log form. In this form, each independent variable in the equation has a percentage impact upon COSTSF, as opposed to a dollar impact, such as would be the case in a linear regression. For instance, if the coefficient for UNITS was .005, then each additional unit would increase COSTSF by .5%. Dummy variables were used to describe the year that the projects were completed. If the coefficient for the year 2000 was �.22, then all projects completed in that year would cost 22% less in nominal dollars than in the default year (2004 was chosen as the default year in this analysis). Load bearing was chosen as defaults for FRAME. The log linear model estimated is hence: Ln(COSTSF) � � � � STORY � � UNITS � � AREA0 1 2 3 � � � FRAME � � � YR . (1)i i i i Where: COSTSF � Construction cost per square foot of building; STORY � Number of stories; UNITS � Number of units in the project (apartment regression only); FRAME � Dummy variable for type of construction, steel frame, concrete, load bearing, or wood;
- 13. AREA � Square feet of building in 1000s; YRi � Dummy variable for each year; and �, � � Estimated statistical parameters. The results of the hedonic regression for the six apartment and office markets were quite significant statistically with R2 values ranging between .64 and .86 for the apartment regressions and between .50 and .65 for the office regressions. These regressions typically had thousands of observations. Additionally, all of the continuous variables in each of the regressions had t-values that indicated statistical significance. The actual regression equations for Washington, D.C. are presented in Appendices 1 and 2. The regressions for the other markets are quite comparable and available from the author. In all of the regressions, the coefficient for AREA is negative and significant at the 1.0% level. This is an expected outcome for several reasons. First, there is an economy of scale in all construction, and cost per square foot typically declines as the overall size of the project increases. This is due in part to economies of scale in production—larger projects typically have increased productivity due to the increased efficiency of repetitive work. Secondly, larger projects also often can exert market pressure in the purchase and assembly of materials on site. In
- 14. the office equations, the average coefficient across markets was �.0006 (ranging S e c u l a r a n d C y c l i c B e h a v i o r � 7 J R E R � V o l . 2 9 � N o . 1 – 2 0 0 7 from �.0004 to �.0008). Thus for each additional 1000 square feet in building size (the variable’s unit of measurement), costs per square foot drop by 0.06%. Thus a ‘‘large’’ suburban property of 100,000 square feet might be built for as much as 6% less per square foot than a ‘‘small’’ property of 4,000 square feet. In the apartment regressions, the average coefficient for square feet was �.001, but the coefficient on UNITS was positive and of almost the same magnitude. Across markets, both ranged from �.0007 to �.0015 and are consistently significant at the 0.10% level. Hence, a larger number of smaller units in the same space cost more. With the semi-log specification it is a bit complicated to assess overall projects scale effects—holding unit size fixed. The cost per square foot for a 100-unit project with 50,000 square feet turns out to be about 5% more expensive than a 10-unit building with 5,000 square feet. At an average unit size of 500 square feet, scale increases costs. As unit size increases above 1,000 square
- 15. feet, the impact reverses and there exist mild economies to project size. With luxury apartments, of typical 1,500 square foot size, a 100-unit building has 4% lower costs per square foot than a 10-unit project. In all of the regressions, STORIES also has a positive and statistically significant coefficient. Again using the average coefficient across apartment markets of .03, 4-story buildings cost 6% more than 2-story. In the case of offices the impact is slightly less, with 4-stories costing 3% more on average. In terms of framing and building technology, the regression results indicate that typically load bearing construction is the cheapest method, with wood frame construction costing almost the same. At the other extreme, concrete construction is typically the most expensive, with steel framing a close second. These latter two methods typically add between 10% and 20% to costs, but these coefficients exhibited much greater variation across markets than those for area, units, or stories. Quite likely, the exact definition of these structure types varies around the country. Taking each of the yearly fixed effects, a time trend is calculated that is the same in percentage terms regardless of the other variables. This in turn is adjusted to real dollars, using the standard CPI series. Exhibit 3 shows the time trend for
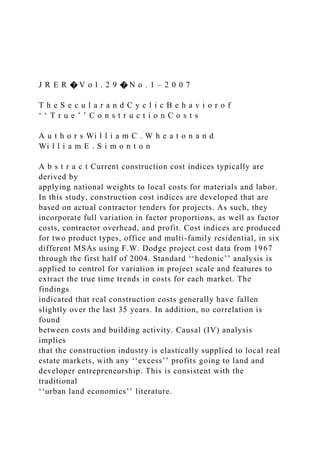
- 16. offices in the city of Dallas and Exhibit 4 displays the results for Chicago apartments. This is quite representative of the majority of cities. The indices for the illustrative city, Washington, D.C. are found in Appendices 3 and 4 and the results for the other markets are available from the author. In each case, the F.W. Dodge index is compared to two commercially available series: RS Means and ENR. The first observation about Exhibits 3 and 4 is that the Means and ENR indices show remarkable uniformity across the six markets and two property types studied. In virtually every case, they rise about 20% in the 1970s and then fall about 20% between 1980 and 2003, ending near or slightly below where they began. It is difficult to believe that this pattern is so uniform across markets, but such 8 � W h e a t o
- 17. n a n d S i m o n t o n E x h i b i t 3 � Comparison of Construction Real Cost Indices for Dallas Offices 0.00 20.00 40.00 60.00 80.00 100.00 120.00
- 18. 140.00 1967 1969 1971 1973 1975 1977 1979 1981 1983 1985 1987 1989 1991 1993 1995 1997 1999 2001 2003 Year In d e x 1 9 7 0 = 1 0 0 Cost Index Real Means Index Real ENR Index Real S e c u l
- 20. R � V o l . 2 9 � N o . 1 – 2 0 0 7 E x h i b i t 4 � Comparison of Construction Cost Indices for Chicago Apartments 0 20 40
- 21. 60 80 100 120 140 1967 1969 1971 1973 1975 1977 1979 1981 1983 1985 1987 1989 1991 1993 1995 1997 1999 2001 2003 Year In d e x 1 9 7 0 = 1 0 0 Cost Index Real Means Index Real ENR Index Real
- 22. 1 0 � W h e a t o n a n d S i m o n t o n uniformity may result from the combination of using fixed factor weights, national materials prices, and only local labor rates. While local labor rates vary widely in levels, if they have moved together across time, then the indices as constructed would indeed be very similar over time as well. The pattern is also almost identical across the two property types. The time series patterns for the F.W. Dodge index show more variation across both market and property type. In general, office costs decline fairly steadily from between 10% and 30% from 1967 through 2004. For apartments, there is less decline, from 5% to 15% and one market, San Diego, actually has a 30% increase in real terms over this period. In the five markets that do show declines, there is also a tendency for costs to rise a bit in the early 1970s, as they do with the Means and ERN indices. However, the pattern is not as pronounced or uniform. The year to year variations in the F.W. Dodge indices are also much greater than those of the Means or ENR indices. Unlike the Means and ERN data, in several markets the F.W. Dodge indices also show a recent climb over the 2001–2004 period. This is true in
- 23. almost half of the market-property types studied. This occurs for apartments in San Diego, Phoenix, Denver, and Chicago and for offices in San Diego as well. By contrast, the other indices continue to decline smoothly over the last few years. � E l a s t i c i t y o f C o n s t r u c t i o n C o s t s t o B u i l d i n g A c t i v i t y A central question in this paper is whether the yearly or cyclic movements in the F.W. Dodge indices, which are much more pronounced than in either the Means or ENR indices, is in any way related empirically to the volume of building activity. Methodologically, the stationarity of the series is examined to see if regression analysis is appropriate or a co-integration approach needs to be applied. Having determined the correct procedure, the relationship between the two series is examined. Exhibit 5 depicts two series for Denver apartments. The building activity series used is new permits for multi-family development. In the case of offices (Exhibit 6), completions of new office space are used (as tallied by real estate brokers in each market). Denver is quite typical of the apartment market in that the cost index shows considerable small movement between years, while building activity displays three large ‘‘swings’’ over the period studied. Most apartments were built in waves during the early 1970s, mid 1980s, and then most
- 24. recently. In between these periods, construction was extremely low. Using a simple AR1 model, both series are found to have a high degree of autocorrelation. The coefficient on lagged costs ranges between .45 and .69 across the six markets. The coefficient on lagged starts is a bit stronger ranging from .52 to .79. In every one of these cases, if an equation is estimated between changes in costs or building activity and lagged levels of the variable, the lagged level coefficient (1 minus the AR1 coefficient) is statistically significant at the 5% level. S e c u l a r a n d C y
- 26. 2 9 � N o . 1 – 2 0 0 7 E x h i b i t 5 � Denver Apartment Real Construction Cost Index vs. New Apartment Supply 80.00 19 69 19 71 19 73 19 75
- 30. g P e rm its Is s u e d Construction Cost Index Apartment Building Permits 1 2 � W h e a t o n a
- 31. n d S i m o n t o n E x h i b i t 6 � Phoenix Office Real Construction Cost Index vs. New Office Supply 60.00 70.00 80.00 90.00 100.00 110.00 120.00 Year C
- 34. ) Construction Cost Index New Office Space 19 68 19 70 19 72 19 74 19 76 19 78 19 80 19 82 19 84 19 86 19
- 35. 88 19 90 19 92 19 94 19 96 19 98 20 00 20 02 20 04 S e c u l a r a n d C y c l i c B e h a v i o r � 1 3 J R E R � V o l . 2 9 � N o . 1 – 2 0 0 7 A model in either levels or differences clearly exhibits mean reversion for both series. Using a simple Dickey-Fuller test, if the cost series are truly random walks,
- 36. then coefficients this far from unity would happen at most 10% of the time. The findings indicate that this level too high; thus, the Dickey- Fuller null is rejected, even though this test is thought to have quite low power with only 37 observations. Similarly, this null is rejected in the case of construction. Both series display considerable mean reversion at annual frequency. In all of the apartment markets examined, this same conclusion holds. The graph for the sample market (Washington) is shown in Appendix 5. Upon casual inspection of this graph, there seems to be little evidence of an obvious relationship between the cost series and apartment building activity. The graphs for all apartment markets are available from the authors upon request. With offices, the story is much the same. Exhibit 6 shows Phoenix office space completions over this time frame, again in comparison with the cost index. With offices there is even more clustering of development. The mid 1980s saw enormous completions of space, while the boom of the early 1970 was smaller in most markets. Recently, there was another building boom, although in some markets it has been more modest in comparison to that of the 1980s. The statistical results are very similar to that of apartments. In all six markets, there is statistically significant mean reversion and the random walk model can be accepted for both
- 37. completions and the construction cost index only at low confidence levels. The graph for the sample Washington, D.C. office market is shown in Appendix 6, and again there appears to be no obvious connection between the two series. With similar results on stationarity for the two series, traditional regression analysis was deemed appropriate. However, an important question remains as to the relationship that should be expected between construction costs and building activity. If this relationship it thought of as embodying a supply curve, it should be positive—unless the industry as a whole (at least at the MSA level) is believed to display increasing returns. In this case, the relationship could conceivably be negative. Somerville (1999) has argued that the relationship between these two series could also represent a derived demand curve from new development. Development is a natural real option that is exercised when asset prices minus construction costs exceed some ‘‘hurdle’’ value. As costs rise, less development is undertaken (ceteris paribus) and so the level of building activity would decrease. At the micro- economic level, Somerville provides some evidence of this, but at the aggregate level others argue that the relationship between construction costs and building activity is purely a supply curve (Blackley, 1999). In principle,
- 38. some instrument could be employed for construction costs (such as international materials prices), which would allow the identification of any demand relationship. Similarly, using an instrument for demand will allow identification of the supply relationship. Given that the interest here is in supply, a simple correlation analysis between the two series will be employed followed by an Instrumental Variables (IV) identification to pick out the impact of purely demand-induced building activity 1 4 � W h e a t o n a n d S i m o n t o n E x h i b i t 7 � Apartment Cost / Starts Results Chicago Dallas Denver Phoenix San Diego Washington, D.C. OLS R2: cost 0.003 0.006 0.006 0.036 0.190 0.003 T: starts 0.32 �0.14 0.46 1.15 �2.86 0.35 R2: cost 0.310 0.430 0.250 0.210 0.570 0.360 T: starts 1.56 0.03 0.71 0.53 �1.21 0.71 T: cost-1 3.93 5.12 3.22 2.72 5.51 4.37 IVa R2: cost 0.048 0.001 0.012 0.036 0.210 0.012 T: starts 1.28 0.04 0.62 0.85 �2.96 0.56 Notes:
- 39. a Instruments are MSA employment growth, 10 year T-bill rate, CPI inflation. on costs. The annual rate of economic growth in each market, along with national interest rates and economy-wide inflation will be used as instruments. For apartments, it seems plausible that bid costs would be impacted (if at all) by the volume of activity at the time the bid is made—that being approximately when the permit is issued (at least the same year). For office space, however, only the date of building completion is known, and it would seem reasonable to allow for a year of two lag. Hence, if office building activity did impact costs, it would be between costs at time t and activity (as measured) at time t � 1 or t � 2. In addition to testing for a simply bivariate relationship between costs and building activity, tests also examined whether there were some more gradual ‘‘adjustment’’ process at work in which activity levels more slowly moved costs. This was done by regressing costs against both building activity and lagged costs. Exhibit 7 gives the results for all six apartment markets of the contemporaneous correlation between apartment permits and construction costs (rows 1 and 2), and then including lagged costs as well (rows 3–5). In only one market, San Diego, is there a significant relationship between cost and activity and
- 40. it is negative. This likely reflects largely secular and not cyclic phenomena. During the last 35 years, construction costs in San Diego have clearly trended upward (unlike the other markets) while apartment building cycles have become smaller. Their decrease has induced a downward trend in the number of permits. Including lagged costs in the equation boost R2 values considerably (given the mean reversion of the series this is not surprising) but never makes the level of building activity statistically significant. The final rows two rows of Exhibit 7 present the IV results. In the six markets studied, the first-stage R2 values range from .28 to .59, when economic growth, S e c u l a r a n d C y c l i c B e h a v i o r � 1 5 J R E R � V o l . 2 9 � N o . 1 – 2 0 0 7 E x h i b i t 8 � Office Cost / Completions Results Chicago Dallas Denver Phoenix San Diego Washington, D.C. R2: cost 0.013 0.001 0.000 0.098 0.015 0.007 T: compl 0.71 0.05 �0.11 �1.98 0.71 �0.49 R2: cost 0.007 0.010 0.003 0.170 0.018 0.015 T: compl�1 0.51 �0.64 0.33 �2.66 0.79 �0.74
- 41. R2: cost 0.013 0.021 0.005 0.210 0.047 0.014 T: compl�2 0.21 �0.83 0.41 �2.84 1.28 �0.69 R2: cost 0.48 0.28 0.27 0.41 0.48 0.37 T: compl�2 0.68 �0.77 0.16 �1.22 0.83 �0.56 T: cost-1 5.53 3.42 3.29 3.32 5.18 0.23 IVa R2: cost 0.003 0.045 0.014 0.21 0.063 0.017 T: compl�2 0.11 �1.23 0.67 �2.74 1.43 �0.74 Notes: a Instruments are MSA employment growth, 10 year T-bill rate, CPI inflation. inflation, and interest rates are used as instruments for building activity. In no case are the presented second-stage results either statistically significant or much different from the OLS equations. Exhibit 8 provides a similar analysis for the six office markets. Only in Phoenix is there any statistically significant relationship between construction costs and building activity. This holds regardless of whether a contemporaneous relationship is examined or one in which costs are related to completions one or two years hence. Similar to apartments, adding in lagged costs for any city boosts the fit of the model (again to be expected), but does not reveal any kind of statistical significance. In the case of Phoenix, the significant relationship is negative and
- 42. again this seems to reflect secular trends. Over the last 35 years, office construction costs have trended down more strongly in this market than others, while office building cycles have increased as the metro area rapidly grew this sector of its economy. The increasing amplitude of the office cycles produces an upward trend in building activity. The final rows of Exhibit 8 again test for endogeneity of building activity. Using the same instruments as in Exhibit 7, the first-stage equations have fits that range from .21 to .63 across the six markets. In the second stage, there is again little change from the OLS results and only Phoenix is significant. The IV results are presented only when using a two period forward lag on costs since the F.W. Dodge company felt that two years was the most reasonable construction lag for office developments. 1 6 � W h e a t o n a n d S i m o n t o n � C o n c l u s i o n The objective of this paper has been quite simple: to estimate a building cost index based on actual construction projects in several markets and for multiple property types and then to study their cyclic and secular behavior over the last 35 years. The conclusions are likewise simple. First, the F.W.
- 43. Dodge data produces cost indices that are generally smooth over time, if a bit noisy year-to-year. There have been no large ‘‘swings’’ or ‘‘movements’’ since the late 1960s. Secondly, the indices generally show a slight decline over time in constant dollars. This certainly indicates that the construction sector has seen some productivity growth over the last several decades. It is also consistent with real estate market information showing that in many commercial markets, rents and asset prices—adjusted for inflation—also have not risen over the last few decades. Real estate markets are supposed to mean revert around long run replacement costs. Thus if the land component of total replacement costs also has not increased much beyond inflation, as might be the case if more and more development is occurring in the suburbs, then there is a complete picture of real estate markets as having long run asset prices that are effectively stationary in real terms. The second major conclusion is that there appears to no impact of the quite pronounced real estate development ‘‘cycle’’ on construction costs. Apartment and office development in the six markets studied has had a very noticeable cycle over the 35 years between 1968 and 2003. At the most basic level, there is just no obvious or statistical reduced form relationship between the two series. This could of course represent offsetting supply and demand impacts.
- 44. Greater development puts pressure on construction costs, but greater construction costs also reduce the profitability of new development—given market asset prices. To study this issue in more detail, more national and regional economic variables need to be developed. In effect the impact of ‘‘demand predicted’’ development on costs is examined, which also turns out to be nil. Thus the overall conclusion is that the construction industry seems to be supplied with a very high elasticity to local development demand. This is consistent with most of the ‘‘Urban Economics’’ literature in which capital is regarded as a perfectly traded good between markets. Only land is scarce and it receives both short run and long run Ricardian scarcity rent. This research clearly supports this view. S e c u l a r a n d C y c l i c B e h a v i o r � 1 7 J R E R � V o l . 2 9 � N o . 1 – 2 0 0 7 � A p p e n d i x 1 �� C h i c a g o A p a r t m e n t s Ln(cost / sf) Coeff. Std. Err. t P � t 95% Conf. Interval Area �0.0009 0.00008 �11.06 0.000 �0.0011 �0.0008
- 45. Units 0.0010 0.00009 10.24 0.000 0.0008 0.0011 Stories 0.0121 0.00091 13.23 0.000 0.0103 0.0139 Steel 0.1043 0.01269 8.22 0.000 0.0794 0.1292 Wood 0.0351 0.00709 4.96 0.000 0.0212 0.0490 Concrete 0.1049 0.01708 6.14 0.000 0.0714 0.1384 Other / Unk �0.0032 0.01033 �0.31 0.757 �0.0234 0.0170 1967 �1.9112 0.03853 �49.60 0.000 �1.9867 �1.8357 1968 �1.8634 0.03911 �47.64 0.000 �1.9401 �1.7867 1969 �1.7851 0.03875 �46.07 0.000 �1.8611 �1.7092 1970 �1.7425 0.03930 �44.34 0.000 �1.8195 �1.6654 1971 �1.6436 0.03790 �43.37 0.000 �1.7179 �1.5693 1972 �1.6028 0.03726 �43.01 0.000 �1.6758 �1.5298 1973 �1.4906 0.03758 �39.67 0.000 �1.5643 �1.4169 1974 �1.4274 0.03957 �36.07 0.000 �1.5050 �1.3498 1975 �1.4122 0.04049 �34.88 0.000 �1.4916 �1.3329 1976 �1.4015 0.03875 �36.17 0.000 �1.4775 �1.3256 1977 �1.2567 0.03782 �33.23 0.000 �1.3308 �1.1825 1978 �1.2090 0.03845 �31.45 0.000 �1.2843 �1.1336
- 46. 1979 �1.0801 0.03827 �28.23 0.000 �1.1551 �1.0051 1980 �0.9695 0.03999 �24.25 0.000 �1.0479 �0.8912 1981 �0.8662 0.04157 �20.84 0.000 �0.9476 �0.7847 1982 �0.8094 0.04278 �18.92 0.000 �0.8933 �0.7256 1983 �0.7974 0.04060 �19.64 0.000 �0.8770 �0.7178 1984 �0.7608 0.03956 �19.23 0.000 �0.8384 �0.6833 1985 �0.7639 0.03895 �19.61 0.000 �0.8402 �0.6875 1986 �0.7184 0.03838 �18.72 0.000 �0.7937 �0.6432 1987 �0.6578 0.03822 �17.21 0.000 �0.7327 �0.5829 1988 �0.5911 0.03825 �15.45 0.000 �0.6660 �0.5161 1989 �0.5161 0.03833 �14.07 0.000 �0.6145 �0.4643 1990 �0.4800 0.03897 �12.32 0.000 �0.5564 �0.4036 1991 �0.4348 0.03988 �10.90 0.000 �0.5130 �0.3567 1992 �0.3834 0.03954 �9.69 0.000 �0.4609 �0.3059 1 8 � W h e a t o n a n d S i m o n t o n � A p p e n d i x 1 ( c o n t i n u e d ) �� C h i c a g o A p a r t m e n t s Ln(cost / sf) Coeff. Std. Err. t P � t 95% Conf. Interval
- 47. 1993 �0.3866 0.03950 �9.79 0.000 �0.4640 �0.3091 1994 �0.3664 0.04118 �8.90 0.000 �0.4471 �0.2857 1995 �0.3557 0.04492 �7.92 0.000 �0.4437 �0.2676 1996 �0.3525 0.04039 �8.73 0.000 �0.4316 �0.2733 1997 �0.3571 0.03798 �9.40 0.000 �0.4315 �0.2826 1998 �0.3055 0.03934 �7.76 0.000 �0.3826 �0.2284 1999 �0.2782 0.04044 �6.88 0.000 �0.3575 �0.1989 2000 �0.2840 0.04413 �6.44 0.000 �0.3705 �0.1975 2001 �0.3085 0.04064 �7.59 0.000 �0.3882 �0.2289 2002 �0.0980 0.04310 �2.27 0.023 �0.1825 �0.0136 2003 �0.0804 0.04169 �1.93 0.054 �0.1622 0.0013 cons 4.3215 0.03558 121.46 0.000 4.2517 4.3912 Notes: The number of observations is 12,259. Other data are: F(44, 12,214) � 887.01; Prob � F � 0.0000; R2 � 0.7616; and Root MSE � 0.3071. Source SS df MS Model 3,679.5705 44 83.6266 Residual 1,151.5221 12,214 0.0943 Total 4,831.0926 12,258 0.3941
- 48. � A p p e n d i x 2 �� D a l l a s A p a r t m e n t s Ln(cost / sf) Coeff. Std. Err. t P � t 95% Conf. Interval Area �0.0010 0.00012 �7.80 0.000 �0.0012 �0.0007 Units 0.0004 0.00011 3.64 0.000 0.0002 0.0006 Stories 0.0300 0.00409 7.34 0.000 0.0220 0.0380 Steel 0.1372 0.03733 3.67 0.000 0.0640 0.2103 Wood 0.0504 0.01430 3.52 0.000 0.0224 0.0784 Concrete 0.2238 0.05311 4.21 0.000 0.1198 0.3280 S e c u l a r a n d C y c l i c B e h a v i o r � 1 9 J R E R � V o l . 2 9 � N o . 1 – 2 0 0 7 � A p p e n d i x 2 ( c o n t i n u e d ) �� D a l l a s A p a r t m e n t s Ln(cost / sf) Coeff. Std. Err. t P � t 95% Conf. Interval Other / Unk 0.0465 0.02095 2.22 0.027 0.0054 0.0875 1967 �1.8746 0.08147 �23.01 0.000 �2.0343 �1.7150 1968 �1.8044 0.07970 �22.64 0.000 �1.9607 �1.6480 1969 �1.6626 0.07228 �23.00 0.000 �1.8044 �1.5209
- 49. 1970 �1.6387 0.07201 �22.76 0.000 �1.7800 �1.4975 1971 �1.6165 0.07132 �22.67 0.000 �1.7564 �1.4767 1972 �1.4809 0.07191 �20.59 0.000 �1.6219 �1.3399 1973 �1.3820 0.07401 �18.67 0.000 �1.5271 �1.2369 1974 �1.3240 0.07560 �17.51 0.000 1.4722 �1.1757 1975 �1.3968 0.08057 �17.34 0.000 �1.5548 �1.2389 1976 �1.4040 0.08092 �17.35 0.000 �1.5627 �1.2454 1977 �1.3359 0.07354 �18.17 0.000 �1.4801 �1.1918 1978 �1.2059 0.07703 �15.66 0.000 �1.3569 �1.0549 1979 �1.0489 0.07475 �14.03 0.000 �1.1954 �0.9023 1980 �0.8330 0.07401 �11.25 0.000 �0.9781 �0.6879 1981 �0.7093 0.07248 �9.79 0.000 �0.8514 �0.5672 1982 �0.6046 0.07140 �8.47 0.000 �0.7446 �0.4646 1983 �0.6043 0.07002 �8.63 0.000 �0.7415 �0.4670 1984 �0.5788 0.07040 �8.22 0.000 �0.7168 �0.4408 1985 �0.5758 0.07073 �8.14 0.000 �0.7145 �0.4372 1986 �0.5913 0.07252 �8.15 0.000 �0.7335 �0.4491 1987 �0.4358 0.08221 �5.30 0.000 �0.5969 �0.2746
- 50. 1988 �0.4018 0.09318 �4.31 0.000 �0.5845 �0.2192 1989 �0.3216 0.10664 �3.02 0.003 �0.5307 �0.1125 1990 �0.2987 0.08668 �3.45 0.001 �0.4686 �0.1288 1991 �0.2574 0.09186 �2.80 0.005 �0.4375 �0.0773 1992 �0.4130 0.10154 �4.07 0.000 �0.6121 �0.2139 1993 �0.3153 0.10148 �3.11 0.002 �0.5142 �0.1163 1994 �0.2737 0.07939 �3.45 0.001 �0.4294 �0.1181 1995 �0.2451 0.08125 �3.02 0.003 �0.0404 �0.0858 1996 �0.2336 0.07825 �2.99 0.003 �0.3870 �0.0802 1997 �0.2429 0.07587 �3.20 0.001 �0.3917 �0.0942 1998 �0.0967 0.07303 �1.32 0.186 �0.2399 0.0465 2 0 � W h e a t o n a n d S i m o n t o n � A p p e n d i x 2 ( c o n t i n u e d ) �� D a l l a s A p a r t m e n t s Ln(cost / sf) Coeff. Std. Err. t P � t 95% Conf. Interval 1999 �0.1117 0.07599 �1.47 0.142 �0.2607 0.0373 2000 �0.0218 0.07634 �0.29 0.775 �0.1715 0.1279
- 51. 2001 �0.0025 0.07881 �0.03 0.975 �0.1570 0.1520 2002 �0.0296 0.07737 �0.38 0.703 �0.1813 0.1221 2003 0.0080 0.07832 0.10 0.919 �0.1456 0.1615 cons 3.9562 0.07038 56.21 0.000 3.8182 4.0942 Notes: The number of observations is 3,777. Other data are: F(44, 3,732) � 332.61; Prob � F � 0.0000; R2 � 0.7944; and Root MSE � 0.2807. Source SS df MS Model 1,153.2285 44 26.2097 Residual 294.0864 3,732 0.0788 Total 1,447.3149 3,776 0.3833 S e c u l a r a n d
- 53. o l . 2 9 � N o . 1 – 2 0 0 7 � A p p e n d i x 3 �� C o m p a r i s o n o f C o n s t r u c t i o n C o s t I n d i c e s f o r W a s h i n g t o n , D . C . A p a r t m e n t s 0 20 40 60 80
- 54. 100 120 140 1967 1969 1971 1973 1975 1977 1979 1981 1983 1985 1987 1989 1991 1993 1995 1997 1999 2001 2003 Year In d e x 1 9 7 0 = 1 0 0 Cost Index Real Means Index Real ENR Index Real
- 55. 2 2 � W h e a t o n a n d S i m o n t o n � A p p e n d i x 4 �� C o m p a r i s o n o f C o n s t r u c t i o n R e a l C o s t I n d i c e s f o r W a s h i n g t o n , D . C . O f f i c e s
- 56. 0 20 40 60 80 100 120 140 1967 1969 1971 1973 1975 1977 1979 1981 1983 1985 1987 1989 1991 1993 1995 1997 1999 2001 2003 Year In d e x 1 9 7 0 = 1 0
- 57. 0 Cost Index Real Means Index Real ENR Index Real S e c u l a r a n d C y c l i c B e
- 59. 1 – 2 0 0 7 � A p p e n d i x 5 �� W a s h i n g t o n , D . C . A p a r t m e n t R e a l C o n s t r u c t i o n C o s t I n d e x v s . N e w A p a r t m e n t S u p p l y 80.00 85.00 90.00 95.00 100.00 105.00 110.00 115.00 Year C o
- 61. 14,000 16,000 18,000 B u ild in g P e rm its Is s u e d Construction Cost Index Apartment Building Permits 19 67 19 69
- 64. S i m o n t o n � A p p e n d i x 6 �� W a s h i n g t o n , D . C . O f f i c e R e a l C o n s t r u c t i o n C o s t I n d e x v s . N e w O f f i c e S u p p l y 60.00 70.00 80.00 90.00 100.00 110.00 120.00 Year C o
- 66. 14000 16000 18000 N e w O ffic e S p a c e S F (1 0 0 0 s ) Construction Cost Index New Office Space
- 68. 19 91 19 93 19 95 19 97 19 99 20 03 20 01 S e c u l a r a n d C y c l i c B e h a v i o r � 2 5 J R E R � V o l . 2 9 � N o . 1 – 2 0 0 7 � R e f e r e n c e s Blackley, D.M. The Long-Run Elasticity of New Housing Supply in the United States: Empirical Evidence for 1950 to 1994. Journal of Real Estate Finance and Economics, 1999, 18:1, 25–42. Brown, J. and H. Rosen. On the Estimation of Structural
- 69. Hedonic Price Models. Econometrica, 1982, 50, 765–68. Clemhout, S. The Impact of Housing Cyclicality on the Construction of Residential Units and Housing Costs. Land Economics, 1981, 57:4, 609–19. Coleman, M. and R. Gentile. Exploring the Dynamics of Building Supply: A Duration Model of the Development Cycle. Journal of Real Estate Research, 2001, 21:1, 21–42. Cropper, M., L. Deck, and K. McConnell. On the Choice of Functional Form for Hedonic Price Functions. Review of Economics and Statistics, 1988, 70, 688–75. DiPasquale, D. and W. Wheaton. The Cost of Capital, Tax Reform, and the Future of Multi-Family Housing. Journal of Urban Economics, 1992, 33:2, 337–60. Engineering News Record. Building Cost Index History. Accessed June 15, 2004 at: http: / / enr.construction.com / features / conEco / costIndexes / bldIndexHist.asp. Geltner, D. and N. Miller. Commercial Real Estate Analysis and Investment. South Western Publishing, 2004. Palmquist, R. Estimating the Demand for the Characteristics of Housing. Review of Economics and Statistics, 1984, 66, 394–404. RS Means Building Construction Cost Data. 62nd Edition. RS
- 70. Means Company, Inc, 2004. RS Means Square Foot Cost Data. 25th Edition. RS Means Company, Inc, 2004. Rosen, S. Hedonic Prices and Implicit Markets; Product Differentiation in Pure Competition. Journal of Political Economy, 1974, 82, 35–55. Somerville, C.T. Residential Construction Costs and the Supply of New Housing: Endogeneity and Bias in Construction Cost Indexes. Journal of Real Estate Finance and Economics, 1999, 18:1, 43–62. ——. The Contribution of Land and Structure to Builder Profits and House Prices. Journal of Housing Research, 1996, 7:1, 127–41. U.S. Department of Labor, Bureau of Labor Statistics. Table Containing History of CPI U.S. Accessed June 17, 2004 at: http: / / stats.bls.gov / cpi / . Wheaton, W. and R. Torto. Office Rent Indices and Their Behavior Over Time. Journal of Urban Economics, 1994, 35:2, 112–39. The authors are indebted to the McGraw Hill and to Anita Gryan for research assistance in the preparation of the databases used in this study. The authors remain fully responsible for all conclusions and analysis drawn from this data. William C. Wheaton, Massachusetts Institute of Technology, Cambridge, MA 02139
- 71. or [email protected] William E. Simonton, The Related Group, Sunny Isles, FL 33160 or [email protected] Relatedgroup.com