1. Situation
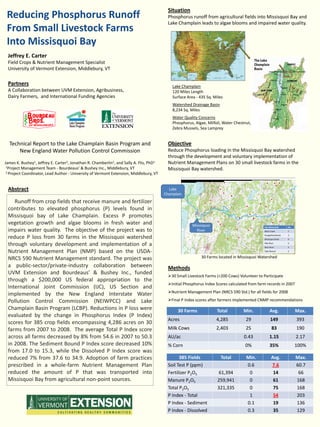
Reducing Phosphorus Runoff Phosphorus runoff from agricultural fields into Missisquoi Bay and
Lake Champlain leads to algae blooms and impaired water quality.
From Small Livestock Farms
Into Missisquoi Bay
Jeffrey E. Carter
Field Crops & Nutrient Management Specialist
University of Vermont Extension, Middlebury, VT
Partners Lake Champlain
A Collaboration between UVM Extension, Agribusiness, 120 Miles Length
Dairy Farmers, and International Funding Agencies Surface Area - 435 Sq. Miles
Watershed Drainage Basin
8,234 Sq. Miles
Water Quality Concerns
Phosphorus, Algae, Milfoil, Water Chestnut,
Zebra Mussels, Sea Lamprey
Technical Report to the Lake Champlain Basin Program and Objective
New England Water Pollution Control Commission Reduce Phosphorus loading in the Missisquoi Bay watershed
through the development and voluntary implementation of
James K. Bushey1, Jeffrey E. Carter2, Jonathan R. Chamberlin1, and Sally A. Flis, PhD1 Nutrient Management Plans on 30 small livestock farms in the
1Project Management Team - Bourdeaus’ & Bushey Inc., Middlebury, VT
Missisquoi Bay watershed.
2 Project Coordinator, Lead Author - University of Vermont Extension, Middlebury, VT
(
! (
! (
!
(
!
(
!
Abstract Lake (
!
Champlain (
!
(
!
(
!
Runoff from crop fields that receive manure and fertilizer (
!
(
!
(
!
(
!
contributes to elevated phosphorus (P) levels found in (
!
Missisquoi bay of Lake Champlain. Excess P promotes (
!
(
!
(
!
(
!
(
!
(
!
vegetation growth and algae blooms in fresh water and Missisquoi
(
!
(
!
(
!
(
!
Sub Watershed No.
impairs water quality. The objective of the project was to
(
!
River (
!
(
!
(
!
Black Creek 5
reduce P loss from 30 farms in the Missisquoi watershed (
!
(
!
Hungerford Brook
Missisquoi River
3
9
through voluntary development and implementation of a Pike River
Rock River
6
5
Nutrient Management Plan (NMP) based on the USDA- Tyler Branch 2
NRCS 590 Nutrient Management standard. The project was 30 Farms located in Missisquoi Watershed
a public-sector/private-industry collaboration between Methods
UVM Extension and Bourdeaus’ & Bushey Inc., funded
30 Small Livestock Farms (<200 Cows) Volunteer to Participate
through a $200,000 US federal appropriation to the
Initial Phosphorus Index Scores calculated from farm records in 2007
International Joint Commission (IJC), US Section and
Nutrient Management Plan (NRCS 590 Std.) for all fields for 2008
implemented by the New England Interstate Water
Pollution Control Commission (NEIWPCC) and Lake Final P Index scores after farmers implemented CNMP recommendations
Champlain Basin Program (LCBP). Reductions in P loss were 30 Farms Total Min. Avg. Max.
evaluated by the change in Phosphorus Index (P Index)
Acres 4,285 29 149 393
scores for 385 crop fields encompassing 4,286 acres on 30
farms from 2007 to 2008. The average Total P Index score Milk Cows 2,403 25 83 190
across all farms decreased by 8% from 54.6 in 2007 to 50.3 AU/ac 0.43 1.15 2.17
in 2008. The Sediment Bound P Index score decreased 10% % Corn 0% 35% 100%
from 17.0 to 15.3, while the Dissolved P Index score was
reduced 7% from 37.6 to 34.9. Adoption of farm practices 385 Fields Total Min. Avg. Max.
prescribed in a whole-farm Nutrient Management Plan Soil Test P (ppm) 0.6 7.6 60.7
reduced the amount of P that was transported into Fertilizer P2O5 61,394 0 14 66
Missisquoi Bay from agricultural non-point sources. Manure P2O5 259,941 0 61 168
Total P2O5 321,335 0 75 168
P Index - Total 1 54 203
P Index - Sediment 0.1 19 136
P Index - Dissolved 0.3 35 129
2. Vermont Phosphorus Index v.5.1 Results
http://pss.uvm.edu/vtcrops/?Page=nutrientmanure.html#Phosphorus Changes in Average Farm P Index Scores from 2007 to 2008
Phosphorus Index Score = (P Sources) X (P Transport Factors) Average P-Index Score Average P-Index Score
2007 2008
120 120
>100 Very High 110
100
110
100 VH
61-100 High Recommended Changes to Lower P Index 90 90
80 80
31-60 Medium
P Index Score
P Index Score
25’ Vegetated Buffer for Corn Fields
70 70
60 60
0-30 Low H
25’ Manure Setback for Hay Fields 50
40
50
40
Crop Rotation to Reduce Soil Loss 30 30
20 20
Reduce P Fertilizer to UVM Recommends 10 10
Reduce P content in Fertilizer Analysis 0
1 3 5 7 9 11 13 15 17 19 21 23 25 27 29
0
1 3 5 7 9 11 13 15 17 19 21 23 25 27 29
Change Timing of Manure Applications 30 Farms 30 Farms
Sediment P Index Dissolved P Index Sediment P Index Dissolved P Index
Quicker Incorporation of Manure
Discussion Farmers changed management practices and achieved an 8%
reduction in average farm P Index scores in one year.
65
Average Soil Test Phosphorus Levels - 30 Farms
LS Means P - value
60
55 2007 2008
50
2007 2008 2008 Actual Actual
45 SE Year
385 Fields Actual Actual Plan vs. 2008 vs. 2008
Soil Test P (ppm)
40
35
Actual Plan
30 Total
53.2 50.2 43.7 0.98 <0.001 0.03 <0.001
25 P Index Score
20 VH
Sediment Bound
15 16.2 15.0 13.6 0.61 0.01 0.17 0.11
10
P Index Score
5 H Dissolved
37.0 35.2 30.1 0.74 <0.001 0.09 <0.001
0 P Index Score
Farm 1 to 30
Total Manure P
64.0 65.2 53.4 1.11 <0.001 0.45 <0.001
Lb-1·ac-1·yr-1
Average soil test avail. P (modified Morgan’s extract) 7.6 ppm
Fertilizer P
was at the low end of UVM High range (7-20 ppm). Lb-1·ac-1·yr-1
12.6 10.2 5.86 0.80 <0.001 0.03 <0.001
Phosphorus Applied from Manure & Fertilizer Sources
2008 Actual
Average Total P Index score across all farms and fields decreased
140 from 2007 to 2008 achieving 32% of the potential reduction outlined
130
120 in the Nutrient Management Plan for 2008. Sediment Bound P Index
110
100 score decreased by a greater amount than the Dissolved P Index
Avg. Lbs per Acre P2O5
90
80
score as a result of improved manure management.
70
60
50
40
30
Conclusion
20
10
0
1 2 3 4 5 6 7 8 9 10 11 12 13 14 15 16 17 18 19 20 21 22 23 24 25 26 27 28 29 30 1. The implementation of Nutrient Management Plans
Farm ID
significantly reduced the loss of phosphorus from 4,285
Manure P applied Fertilizer P applied
acres of crop land by 8% in one year.
81% of all Phosphorus applied to 385 fields came from Farm Management Changes were implemented as a
on-farm livestock manure source. Fertilizer Phosphorus result of recommendations described in NMP
was applied as corn starter and did not have a significant Technical Advisor Assistance was important to collect
effect on P Index score. soil, manure and crop data and to explain results
and recommendations to reduce P runoff to
Livestock Density (AU/ac) vs. Average P Index - 30 Farms
2008 water.
100
90
2. The information in their farm Nutrient Management Plan
80
70
enabled five of the 30 Farms to reduce their overall P Index
60 score by 20% or more in the first year of implementation
P-Index Score
50
Series1
40 Linear (Series1)
Linear (Series1)
3. The Vermont Phosphorus Index was an effective method to
30
20
y = 15.554x + 32.283 evaluate changes in farm management practices that
R² = 0.1891
10 resulted in less Phosphorus loss from the farm fields and
0
0.00 0.50 1.00 1.50 2.00 2.50
reduced agricultural non-point source water pollution.
AU / Acre
4. The collaboration of UVM Extension and a local
There was no correlation between Farm Livestock density Agribusiness working together on this project was effective
Animal Units (AU) per acre and the Farm Average P Index score. to gain the farmers’ trust and complete the project as
planned.