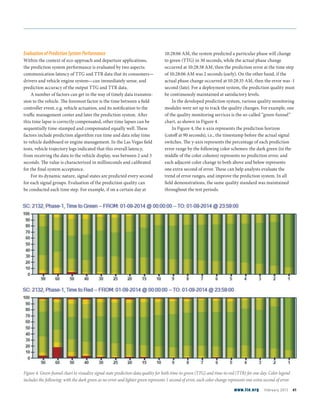
An Online
Prediction System
ofTraffic Signal Status
for Assisted Driving
on Urban Streets:
By Thomas Bauer, P.E., PTOE, Jingtao Ma, Ph.D., P.E.,
and Frank Offermann, Ph.D.
S
top and go movements on urban streets under traffic signals are the sources of
increased fuel consumption, vehicle wear and tear, commuter anxiety, and thus
safety risks. When approaching or stopping at a signalized intersection, if a driver or
in-vehicle computers can be assisted with traffic light state and switching information,
many of these side effects can be greatly alleviated.
Pilot Experiences in the
United States, China, and Germany
shutterstock.com/guijunpeng
www.ite.org February 2015 37
feature |
One Connected Vehicle (CV) technology—Eco-approach and
departure, or Green Light Optimal Speed Advisory (GLOSA)—
aims to alleviate these side effects by presenting the information
via in-vehicle human-machine-interface (HMI), or engine
management. A few forms of such applications and their car
manufacturers include:
Recommended speed to cruise through a green signal (Audi,
Honda, BMW);
Warning message to release gas pedal of oncoming red light
(Honda);
Red countdown timer to remind resuming driving in time
(Honda, BMW); and
Tied engine management to stop engine for a known long wait
ahead and restart right before the light turns green (Audi).
The photos in Figure 1 illustrate examples of two car manufac-
turers’ HMI designs for presenting the information.
For its many potential benefits, simulations and lab experiments
were set up to design algorithms for computing optimal
cruise speed when approaching a traffic signal.1,2,3
Traffic flow
simulators were applied to combine with vehicle emission and fuel
consumption models to examine variables such as congestion levels,
vehicle types, and throttle controls.4
Test fields of various scales helped demonstrate and evaluate the
eco-approach and departure systems among other CV applications.
The U.S. Department of Transportation (USDOT) initiated a number
of test beds that installed road side units (RSU) and vehicle on-board
units (OBU) in addition to traffic management centers enhanced with
communication modules to RSUs and OBUs.5
For example, in Novi,
Michigan, USA, 50 installed RSU can broadcast signal phasing and
timing (SPaT) messages to equipped vehicles for eco-approach and
departure tests. One large scale field test SimTD
(Safe and Intelligent
Mobility–Test Field Germany) was also set up in Frankfurt, Germany
to evaluate different vehicle-to-infrastructure (V2I) technologies,
including GLOSA in urban environments.6
Results showed that
when fully deployed, GLOSA can help reduce carbon emissions from
vehicle traffic by up to 15 percent, and annual gas savings can reach
245 million gallons in Germany alone. Small scale corridors are also
equipped similarly to demonstrate similar V2I applications.7,8
When it comes to delivering signal phasing and timing messages
to vehicles, current practice sees three major methods: field commu-
nication via dedicated short-range communication (DSRC); infrared,
signal management system backhaul network to relay with vehicles;
or computer vision inside vehicles to recognize traffic signal and color
changes. DSRC is the default method in most lab experiments and test
fields for its sub-second low latency of data exchange between cars and
traffic lights, which also makes other applications such as collision
avoidance possible. However, the retrofit of existing infrastructure
to accommodate DSRC communications is costly considering the
number of existing traffic signals. For example, an earlier benefit-cost
analysis estimated 27.3 billion dollars for a nationwide upgrade to
urban freeway and intersections in the United States in a five-year
period.9
Represented by Google’s self-driving cars, another method of
traffic signal data stream into cars is using cameras to capture signals,
analyze their current color, and make corresponding continue-driv-
ing or stop decisions.10
Some research even developed iPhone apps to
continuously capture traffic light switches and then predict timing
schedules from analyzing signal switching time and patterns.11
Another approach is to harness advances in 3G/4G or Long-Term
Evolution (LTE) wireless communications. The traffic signal data is
collected by tapping into existing signal management systems (SMS)
in a read-only or one-way data flow, adding signal prediction and
then relaying to the cars via 3G/4G or LTE. A pioneering project,
“Travolution,” saw collaboration between the City of Ingolstadt,
Germany and Audi to complete the data flow circle using cellular
communications.12
Later similar demonstrations followed the same
path, including a large scale deployment in Berlin, Germany, where
700 signals have already been connected to the Audi backend and
then target data were sent to a car fleet driving in the city.13
Figure 1. Examples of in-vehicle human machine interface designs that
present traffic signal data to drivers: (top-a) red countdown dial or speed
advice together with navigation display in the central control (BMW)
(bottom-b) red countdown timer or speed advice on digitalized dashboard
(Audi).
ImagescourtesyofHeuschBoesefeldtAmerica
38 February 2015 ite journal
This paper describes an online signal state prediction system,
dubbed Personal Signal Assistant (PSA), which must work with
agencies’ SMS for data collection and then prediction. At the 2014
Consumer Electronics Show (CES) in Las Vegas Nevada, USA,
the system supplied signal prediction data to one Audi car and
demonstrated the technology. It received the “Best Auto Tech”
award from The Verge for being considered the most potential
connected vehicle technology that can be deployed in the near
future. This report introduces the system architecture, shares
field test experiences in Las Vegas and other cities in China and
Germany, and discusses a potential deployment roadmap for
North America.
Online Signal State Prediction System Architecture
The developed signal state prediction system, Personal Signal
Assistant or PSA, produces for each signal group second-by-second
prediction of two signal state switches in a full cycle: time to green
(TTG) and time to red (TTR). The 1 Hz data rate allows for quick
updates and fast responses when the traffic situation changes. For
example, when transit signal priority or emergency preemption
calls occur, the PSA system can quickly generate the corresponding
message. The system consists of three major sub-systems: signal
state data collection from field controllers via signal management
systems; signal state prediction; and prediction data relay to vehicles
or smart phones, as depicted in Figure 2.
Figure 2. System architecture and data flow of the online signal state prediction system.
ImagescourtesyofHeuschBoesefeldtAmerica
www.ite.org February 2015 39
TrafficSignalDataCollection
Tied to the signal management system (SMS), the traffic data
collection module streams necessary data in real time to the
prediction engine.
SignalStatePrediction
Signal state prediction lies at the core of the PSA. This is accom-
plished by a proprietary and patent-pending technology that analyzes
both historical patterns and current traffic conditions including
vehicle actuations and signal priorities or preemptions, to provide
the best estimate of future signal state change times. Real-time data
fusion becomes crucial for traffic-actuated controls because the signal
timing adjusts according to different traffic arrival patterns.
DataRelay
After TTG and TTR data are generated, these data are formatted in
a light-weight package and sent to the consumers, e.g., telematics
or navigation service providers, or the backend server system of car
manufacturers who then send the data via wireless network into
the car HMI and possible engine management. One critical issue
in the data relay is the compensation for all possible time lapses at
each step in this data chain. For example, the compensation could
include the latency of data transmission from field controller to
SMS, collecting time from SMS to the prediction system, computing
time, and forwarding times. All timestamps must be carefully
analyzed and latency compensated for in the final delivery to
drivers or engine management.
Field Demonstration and Results
Customized PSA systems were tested in field deployments in the
United States, China, and Germany. These test field conditions
varied greatly in their control logic complexities, driving behavior,
and traffic conditions—all affecting the prediction data quality.
The most notable of these deployments is set along Las Vegas
Boulevard (“The Strip”), where signal controllers are programmed
with an array of time-of-day actuated-coordinated timing plans
to handle traffic streams of private vehicles, tour buses, hotel and
casino service vehicles, and pedestrians. Control timing plans
are also often adjusted for special events such as concerts or
shows. Meanwhile, test area signal controllers were supplied by
two different vendors, Siemens and TrafficWare, where PSA data
collection must cope with both standard NTCIP protocols and
other proprietary communication protocols. This prediction system
deployment supported Audi’s Traffic Light Info Online system
demonstration at the 2014 Consumer Electronics Show where it
received high media acceptance.14,15,16
Other field test conditions are less complex than Las Vegas;
however, they feature different control logic and unique local
conditions. Figure 3 shows all sites and their main characteristics.
Test Sites location Characteristics
Las Vegas, Nevada, US 50 intersections
Siemens and TrafficWare controllers
Semi-actuated control, with
protected/permissive and
overlap phases
LasVegas Boulevard between Man-
dalay Bay and Sahara Avenue (“The
Strip”); Paradise Avenue, and all sig-
nalized intersections within this area
as well as seven intersections along
Flamingo St toThe Palms Hotel.
Continuous running; field demon-
stration with Audi AG (January
2014)
Shanghai, China 14 intersections
Two local controller vendors
Time-of-day fixed control, with
protected/permissive phases
Frequent timing plan updates for
changing traffic conditions
Test route near Tongji University
Jiading Campus and three on-
campus signals (not shown in map
to the left)
Field demonstration with Audi AG
(November 2014)
Dortmund, Germany One intersection
Siemens controller
Semi-actuated control running
TRELAN and compiled for TL
Proof-of-concept: prediction
system ran on archived signal state
and vehicle detection data
Location: Südwall – Ostwall /
Kleppingstrasse – Ruhrallee
Merzig, Germany 4 intersections
Swarco ACTROS controllers
Semi-actuated control with
transit priority
Control logic in LISA+ of Schlothaus-
er andWauer and thus in OML
Scheduled field test in May 2015
Data streamed to a fleet of the
Car2Saar testbed
Gaswerk / Lothringerstrasse;
Hochfallstraße / Bauerstraße; L174
/ Lothringerstraße; Rieffstraße /
Lothringerstraße
US Route 1, New Jersey 11 intersections
TrafficWare controllers
Semi-actuated control
High speed travel corridor with
large trucks posing safety risks for
trailing vehicles
US Route 1 from Plainfield Ave to
Green St
Lab test and field demonstration
with BMW Group
Figure 3. Test field location setup and signal controls
ImagescourtesyofHeuschBoesefeldtAmerica
40 February 2015 ite journal
EvaluationofPredictionSystemPerformance
Within the context of eco-approach and departure applications,
the prediction system performance is evaluated by two aspects:
communication latency of TTG and TTR data that its consumers—
drivers and vehicle engine system—can immediately sense, and
prediction accuracy of the output TTG and TTR data.
A number of factors can get in the way of timely data transmis-
sion to the vehicle. The foremost factor is the time between a field
controller event, e.g. vehicle actuation, and its notification to the
traffic management center and later the prediction system. After
this time lapse is correctly compensated, other time lapses can be
sequentially time-stamped and compensated equally well. These
factors include prediction algorithm run time and data relay time
to vehicle dashboard or engine management. In the Las Vegas field
tests, vehicle trajectory logs indicated that this overall latency,
from receiving the data to the vehicle display, was between 2 and 3
seconds. The value is characterized in milliseconds and calibrated
for the final system acceptance.
For its dynamic nature, signal states are predicted every second
for each signal groups. Evaluation of the prediction quality can
be conducted each time step. For example, if on a certain day at
10:28:06 AM, the system predicted a particular phase will change
to green (TTG) in 30 seconds, while the actual phase change
occurred at 10:28:38 AM, then the prediction error at the time step
of 10:28:06 AM was 2 seconds (early). On the other hand, if the
actual phase change occurred at 10:28:35 AM, then the error was -1
second (late). For a deployment system, the prediction quality must
be continuously maintained at satisfactory levels.
In the developed prediction system, various quality monitoring
modules were set up to track the quality changes. For example, one
of the quality monitoring services is the so-called “green-funnel”
chart, as shown in Figure 4.
In Figure 4, the x-axis represents the prediction horizon
(cutoff at 90 seconds), i.e., the timestamp before the actual signal
switches. The y-axis represents the percentage of each prediction
error range by the following color schemes: the dark green (in the
middle of the color column) represents no prediction error, and
each adjacent color change to both above and below represents
one extra second of error. These can help analysts evaluate the
trend of error ranges, and improve the prediction system. In all
field demonstrations, the same quality standard was maintained
throughout the test periods.
Figure 4. Green-funnel chart to visualize signal state prediction data quality for both time-to-green (TTG) and time-to-red (TTR) for one day. Color legend
includes the following: with the dark green as no error and lighter green represents 1 second of error, each color change represents one extra second of error.
www.ite.org February 2015 41
System Field Tests and Driving Experiences
Field tests have given the team valuable experiences from the unique
combined perspective of developers, drivers, traffic engineers, and
local agencies. In particular, field demonstrations in Las Vegas and
Shanghai with the Audi vehicle equipped with the traffic light info
online (TLIO) system clearly illustrated the safety and mobility
benefits of an eco-approach and departure system.17
For example, with
TLIO, waiting at long signal cycles became a known period with the
red countdown timer, and the auto-engine start at 5 seconds before
lights turning green became a noticeable cue for drivers to focus on
the road again. At the same time, test drivers were observed to follow
speed advice from the system and avoided last-second sudden stops.
Safety benefits also became apparent during field demonstra-
tions. When trailing behind large trucks or tour buses, drivers
were informed of the signals ahead when their view was impeded.
Similarly, the dashboard display of signals served as adequate
substitute at situations of impaired sight distance by curvatures
or slopes, for which Flamingo Road overpass of I-15 in Las Vegas
provides an excellent example. Due to its slope, drivers cannot see
the traffic signal until the vehicle reaches the aperture where it can
become unsafe to stop. The dashboard display of countdown timer or
the speed advice gave drivers a heads-up warning of situations ahead.
Additional advantages were also revealed in the field tests, such
as vehicle actuations. Figure 4 shows the system functioning of
one test vehicle making a left turn on southbound Las Vegas Blvd.
When approaching the empty turn bay, the countdown timer is
blank (Figure 5a), for without actuation the phase is not scheduled
for the upcoming cycle. After the test vehicle passes the detector, the
prediction system is immediately able to predict the exact time to
green and thus the countdown timer display starts (Figure 5b). This
gives drivers more confidence and sometimes relief, because waiting
for more than 2 minutes (148 second countdown in this case) could
lead a driver to the perception of malfunctioning signals and thus
possible red light running.
Closing Remarks
As this Connected Vehicle application of eco-approach and departure
has reached its maturity, the developed signal state prediction
system provides the quickest way to bridge the gap between existing
infrastructure and connected vehicle technologies. As shown in all
test fields with extensive demo vehicle runs, this technical approach
has proven its feasibility with the computing, communication, and
vehicle technology existing today. Current large-scale city and region
wide tests are expected to lead to imminent full-scale deployment.
Agency support is critical for the development of such eco-ap-
proach and departure systems. All of the mentioned field demon-
strations would not have been successful or even possible without
the support from the local agencies, namely Las Vegas Freeway and
Arterial System of Transportation (FAST), Shanghai local traffic
police, New Jersey Department of Transportation (NJDOT) and the
City of Merzig, Germany. Understandably, all of these agencies were
concerned with driver distraction possibilities of such connected
vehicle technology; however, they became convinced by experiences
gained from the demo systems. itej
Figure 5. Field tests in Las Vegas, NV, USA demonstrated the quick responses of the prediction system and display in the test vehicle: (left-a) test vehicle
approaching the empty left turn, the traffic light info online (TLIO) display on dashboard is blank; (right-b) once the test vehicle is detected, the prediction
system is able to predict time-to-green and TLIO displays the countdown timer.
ImagescourtesyofHeuschBoesefeldtAmerica
42 February 2015 ite journal
Acknowledgment
The authors sincerely appreciate the support from David Chrysler
and Shital Patel from Las Vegas FAST; Darren Beyer from
TrafficWare; Wilke Reints, Benjamin Collar, and Axel Wienert from
Siemens; Professor Zhizhou Wu from Tongji University; Dhanesh
Motiani and Jeevanjot Singh from NJDOT; and Branislav Dimitrije-
vic and Pavani Borra from New Jersey Institute of Technology. The
authors are responsible for all facts and views in this article.
References
1. Konstantinos Katsaros, et al.“Performance Study of a Green Light
Optimized Speed Advisory Application Using an Integrated Cooperative
ITS Simulation Platform.”Paper presented at the 7th International Wireless
Communications and Mobile Computing Conference Compendium of
Technical Papers, Istanbul, Turkey, July 2011: 918–923.
2. Hesham Rakha and Raj Kishore Kamalanathsharma.“Eco-driving at
Signalized Intersections Using V2I Communication.”Paper presented at
the 14th International Conference on Intelligent Transportation Systems,
Washington, DC, USA, October 2011: 341–346.
3. Aleksandar Stevanovic, Jelka Stevanovic, and Cameron Kergaye.“Impact
of Signal Phasing Information Accuracy on Green Light Optimized Speed
Advisory Systems.”Paper presented at the 2013 Transportation Research
Board Annual Meeting, Washington, DC, USA, January 2013.
4. Tessa Tielert, et al. “The Impact of Traffic-Light-to-Vehicle Communication
on Fuel Consumption and Emissions.” Paper presented at the Internet of
Things Conference, Tokyo, Japan, November 2010: 1–8.
5. “Testing Connected Vehicle Technologies in a Real-World Environment,”
ITS DOT.gov, accessed December 2014, www.its.dot.gov/newsletter/
august2012.htm.
6. “SimTD Facts,”Safe and Intelligent Mobility, accessed December 2014, www.
simtd.de/index.dhtml/enEN/backup_publications/Informationsmaterial.html.
7. Ulrich Haspel.“Umsetzung Kooperativer Systeme in Bayern,
Strassenverkehrstechnik, ”accessed December 2014, www.
baufachinformation.de/zeitschrift/Umsetzung-Kooperativer-Systeme-in-
Bayern/2014109014326.
8. “NXP and Partners Launch European Test Drive to Showcase the Future of
Intelligent Traffic,”NXP.com, accessed in December 2014, www.nxp.com/
news/press-releases/2014/11/nxp-and-partners-launch-european-test-
drive-to-showcase-the-future-of-intelligent-traffic.html.
9. “Vehicle-Infrastructure Integration Initiative Benefit-Cost Analysis, Version
2.3.”U.S. Department of Transportation, Washington, DC, USA: May 2008.
10. Erico Guizzo.“How Google’s Self-driving Car Works,”IEEE Spectrum,
accessed December 2014, http://spectrum.ieee.org/automaton/robotics/
artificial-intelligence/how-google-self-driving-car-works.
11. Emmanouil Koukoumidis, Li-Shiuan Peh, and Magaret Martonosi.“Signal
Guru: Leveraging Mobile Phones For CollaborativeTraffic Signal Schedule
Advisory.”Paper presented at MobiSys 2011, Bethesda, MD, USA, June 2011.
12. “Travolution,”accessed December 2014, www.travolution-ingolstadt.de/
index.php?id=2&L=1.
13. “Networked Driving with‘Traffic-light Information Online,’”Audi Urban
Future Initiative, accessed December 2104, http://audi-urban-future-
initiative.com/blog/location/berlin-819.
14. “Audi’sTraffic Light AssistantTells How Long until the Signal Goes Green,”
Consumer Reports.org, accessed December 2104, www.consumerreports.
org/cro/news/2014/01/audi-traffic-light-assist-ces-2014/index.htm.
15. “Audi Traffic Light Assistant HelpsYou Hit Every Green Light,”Autoblog.
com, accessed December 2014, www.autoblog.com/2014/01/09/audi-
traffic-light-assist-ces-2014.
16. “What Happens if you Fall Asleep in a Self-driving Car? Audi
knows,”The Verge.com, accessed December 2014, www.theverge.
com/2014/1/8/5286598/what-happens-if-you-fall-asleep-in-a-self-
driving-car-audi-knows.
17. “Traffic Light Info Online,”YouTube, accessed December 2014, www.
youtube.com/watch?v=a6zrRukr6W0.
Thomas Bauer, P.E., PTOE is the CEO of Heusch
Boesefeldt America. He has 24 years of experience in
the fields of intelligent transportation systems (ITS),
traffic engineering, transportation planning, transit
operations, and traffic software development. Most
recently, Thomas has focused on Active Transportation
Demand Management (ATDM) and Connected Vehicles applications
and evaluations. He holds master’s degrees in transportation engineer-
ing from Oregon State University and civil engineering from the
University of Stuttgart, Germany. Thomas is a member of ITE.
Jingtao Ma, Ph.D., P.E. is lead engineer at Heusch
Boesefeldt America. He has more than 15 years of
experience in intelligent transportation systems
(ITS), traffic engineering, and transportation
planning. He specializes in real-time and multi-reso-
lution traffic modeling and simulation and urban
digital footprint analysis for transportation planning. He received his
doctor of philosophy from University of California, Davis with his
research on integrated corridor control that balances system
efficiency and user fairness.
Frank Offermann, Ph.D. is the director for business
development and vehicle-to-infrastructure (V2I)
technology at Heusch/Boesefeldt. He has 18 years of
experience in the fields of intelligent transportation
systems (ITS) and traffic engineering, focusing on
solutions for urban street and freeway operations.
Frank has been involved in numerous research activities in the
vehicle-to-infrastructure area and is now dedicated to the market
introduction of cooperative systems. He received his doctor of philoso-
phy in civil engineering from RWTH Aachen University, Germany in
2000 with his research focused on data fusion of floating car data.
www.ite.org February 2015 43

ITE_Publication

  • 1.
    An Online Prediction System ofTrafficSignal Status for Assisted Driving on Urban Streets: By Thomas Bauer, P.E., PTOE, Jingtao Ma, Ph.D., P.E., and Frank Offermann, Ph.D. S top and go movements on urban streets under traffic signals are the sources of increased fuel consumption, vehicle wear and tear, commuter anxiety, and thus safety risks. When approaching or stopping at a signalized intersection, if a driver or in-vehicle computers can be assisted with traffic light state and switching information, many of these side effects can be greatly alleviated. Pilot Experiences in the United States, China, and Germany shutterstock.com/guijunpeng www.ite.org February 2015 37 feature |
  • 2.
    One Connected Vehicle(CV) technology—Eco-approach and departure, or Green Light Optimal Speed Advisory (GLOSA)— aims to alleviate these side effects by presenting the information via in-vehicle human-machine-interface (HMI), or engine management. A few forms of such applications and their car manufacturers include: Recommended speed to cruise through a green signal (Audi, Honda, BMW); Warning message to release gas pedal of oncoming red light (Honda); Red countdown timer to remind resuming driving in time (Honda, BMW); and Tied engine management to stop engine for a known long wait ahead and restart right before the light turns green (Audi). The photos in Figure 1 illustrate examples of two car manufac- turers’ HMI designs for presenting the information. For its many potential benefits, simulations and lab experiments were set up to design algorithms for computing optimal cruise speed when approaching a traffic signal.1,2,3 Traffic flow simulators were applied to combine with vehicle emission and fuel consumption models to examine variables such as congestion levels, vehicle types, and throttle controls.4 Test fields of various scales helped demonstrate and evaluate the eco-approach and departure systems among other CV applications. The U.S. Department of Transportation (USDOT) initiated a number of test beds that installed road side units (RSU) and vehicle on-board units (OBU) in addition to traffic management centers enhanced with communication modules to RSUs and OBUs.5 For example, in Novi, Michigan, USA, 50 installed RSU can broadcast signal phasing and timing (SPaT) messages to equipped vehicles for eco-approach and departure tests. One large scale field test SimTD (Safe and Intelligent Mobility–Test Field Germany) was also set up in Frankfurt, Germany to evaluate different vehicle-to-infrastructure (V2I) technologies, including GLOSA in urban environments.6 Results showed that when fully deployed, GLOSA can help reduce carbon emissions from vehicle traffic by up to 15 percent, and annual gas savings can reach 245 million gallons in Germany alone. Small scale corridors are also equipped similarly to demonstrate similar V2I applications.7,8 When it comes to delivering signal phasing and timing messages to vehicles, current practice sees three major methods: field commu- nication via dedicated short-range communication (DSRC); infrared, signal management system backhaul network to relay with vehicles; or computer vision inside vehicles to recognize traffic signal and color changes. DSRC is the default method in most lab experiments and test fields for its sub-second low latency of data exchange between cars and traffic lights, which also makes other applications such as collision avoidance possible. However, the retrofit of existing infrastructure to accommodate DSRC communications is costly considering the number of existing traffic signals. For example, an earlier benefit-cost analysis estimated 27.3 billion dollars for a nationwide upgrade to urban freeway and intersections in the United States in a five-year period.9 Represented by Google’s self-driving cars, another method of traffic signal data stream into cars is using cameras to capture signals, analyze their current color, and make corresponding continue-driv- ing or stop decisions.10 Some research even developed iPhone apps to continuously capture traffic light switches and then predict timing schedules from analyzing signal switching time and patterns.11 Another approach is to harness advances in 3G/4G or Long-Term Evolution (LTE) wireless communications. The traffic signal data is collected by tapping into existing signal management systems (SMS) in a read-only or one-way data flow, adding signal prediction and then relaying to the cars via 3G/4G or LTE. A pioneering project, “Travolution,” saw collaboration between the City of Ingolstadt, Germany and Audi to complete the data flow circle using cellular communications.12 Later similar demonstrations followed the same path, including a large scale deployment in Berlin, Germany, where 700 signals have already been connected to the Audi backend and then target data were sent to a car fleet driving in the city.13 Figure 1. Examples of in-vehicle human machine interface designs that present traffic signal data to drivers: (top-a) red countdown dial or speed advice together with navigation display in the central control (BMW) (bottom-b) red countdown timer or speed advice on digitalized dashboard (Audi). ImagescourtesyofHeuschBoesefeldtAmerica 38 February 2015 ite journal
  • 3.
    This paper describesan online signal state prediction system, dubbed Personal Signal Assistant (PSA), which must work with agencies’ SMS for data collection and then prediction. At the 2014 Consumer Electronics Show (CES) in Las Vegas Nevada, USA, the system supplied signal prediction data to one Audi car and demonstrated the technology. It received the “Best Auto Tech” award from The Verge for being considered the most potential connected vehicle technology that can be deployed in the near future. This report introduces the system architecture, shares field test experiences in Las Vegas and other cities in China and Germany, and discusses a potential deployment roadmap for North America. Online Signal State Prediction System Architecture The developed signal state prediction system, Personal Signal Assistant or PSA, produces for each signal group second-by-second prediction of two signal state switches in a full cycle: time to green (TTG) and time to red (TTR). The 1 Hz data rate allows for quick updates and fast responses when the traffic situation changes. For example, when transit signal priority or emergency preemption calls occur, the PSA system can quickly generate the corresponding message. The system consists of three major sub-systems: signal state data collection from field controllers via signal management systems; signal state prediction; and prediction data relay to vehicles or smart phones, as depicted in Figure 2. Figure 2. System architecture and data flow of the online signal state prediction system. ImagescourtesyofHeuschBoesefeldtAmerica www.ite.org February 2015 39
  • 4.
    TrafficSignalDataCollection Tied to thesignal management system (SMS), the traffic data collection module streams necessary data in real time to the prediction engine. SignalStatePrediction Signal state prediction lies at the core of the PSA. This is accom- plished by a proprietary and patent-pending technology that analyzes both historical patterns and current traffic conditions including vehicle actuations and signal priorities or preemptions, to provide the best estimate of future signal state change times. Real-time data fusion becomes crucial for traffic-actuated controls because the signal timing adjusts according to different traffic arrival patterns. DataRelay After TTG and TTR data are generated, these data are formatted in a light-weight package and sent to the consumers, e.g., telematics or navigation service providers, or the backend server system of car manufacturers who then send the data via wireless network into the car HMI and possible engine management. One critical issue in the data relay is the compensation for all possible time lapses at each step in this data chain. For example, the compensation could include the latency of data transmission from field controller to SMS, collecting time from SMS to the prediction system, computing time, and forwarding times. All timestamps must be carefully analyzed and latency compensated for in the final delivery to drivers or engine management. Field Demonstration and Results Customized PSA systems were tested in field deployments in the United States, China, and Germany. These test field conditions varied greatly in their control logic complexities, driving behavior, and traffic conditions—all affecting the prediction data quality. The most notable of these deployments is set along Las Vegas Boulevard (“The Strip”), where signal controllers are programmed with an array of time-of-day actuated-coordinated timing plans to handle traffic streams of private vehicles, tour buses, hotel and casino service vehicles, and pedestrians. Control timing plans are also often adjusted for special events such as concerts or shows. Meanwhile, test area signal controllers were supplied by two different vendors, Siemens and TrafficWare, where PSA data collection must cope with both standard NTCIP protocols and other proprietary communication protocols. This prediction system deployment supported Audi’s Traffic Light Info Online system demonstration at the 2014 Consumer Electronics Show where it received high media acceptance.14,15,16 Other field test conditions are less complex than Las Vegas; however, they feature different control logic and unique local conditions. Figure 3 shows all sites and their main characteristics. Test Sites location Characteristics Las Vegas, Nevada, US 50 intersections Siemens and TrafficWare controllers Semi-actuated control, with protected/permissive and overlap phases LasVegas Boulevard between Man- dalay Bay and Sahara Avenue (“The Strip”); Paradise Avenue, and all sig- nalized intersections within this area as well as seven intersections along Flamingo St toThe Palms Hotel. Continuous running; field demon- stration with Audi AG (January 2014) Shanghai, China 14 intersections Two local controller vendors Time-of-day fixed control, with protected/permissive phases Frequent timing plan updates for changing traffic conditions Test route near Tongji University Jiading Campus and three on- campus signals (not shown in map to the left) Field demonstration with Audi AG (November 2014) Dortmund, Germany One intersection Siemens controller Semi-actuated control running TRELAN and compiled for TL Proof-of-concept: prediction system ran on archived signal state and vehicle detection data Location: Südwall – Ostwall / Kleppingstrasse – Ruhrallee Merzig, Germany 4 intersections Swarco ACTROS controllers Semi-actuated control with transit priority Control logic in LISA+ of Schlothaus- er andWauer and thus in OML Scheduled field test in May 2015 Data streamed to a fleet of the Car2Saar testbed Gaswerk / Lothringerstrasse; Hochfallstraße / Bauerstraße; L174 / Lothringerstraße; Rieffstraße / Lothringerstraße US Route 1, New Jersey 11 intersections TrafficWare controllers Semi-actuated control High speed travel corridor with large trucks posing safety risks for trailing vehicles US Route 1 from Plainfield Ave to Green St Lab test and field demonstration with BMW Group Figure 3. Test field location setup and signal controls ImagescourtesyofHeuschBoesefeldtAmerica 40 February 2015 ite journal
  • 5.
    EvaluationofPredictionSystemPerformance Within the contextof eco-approach and departure applications, the prediction system performance is evaluated by two aspects: communication latency of TTG and TTR data that its consumers— drivers and vehicle engine system—can immediately sense, and prediction accuracy of the output TTG and TTR data. A number of factors can get in the way of timely data transmis- sion to the vehicle. The foremost factor is the time between a field controller event, e.g. vehicle actuation, and its notification to the traffic management center and later the prediction system. After this time lapse is correctly compensated, other time lapses can be sequentially time-stamped and compensated equally well. These factors include prediction algorithm run time and data relay time to vehicle dashboard or engine management. In the Las Vegas field tests, vehicle trajectory logs indicated that this overall latency, from receiving the data to the vehicle display, was between 2 and 3 seconds. The value is characterized in milliseconds and calibrated for the final system acceptance. For its dynamic nature, signal states are predicted every second for each signal groups. Evaluation of the prediction quality can be conducted each time step. For example, if on a certain day at 10:28:06 AM, the system predicted a particular phase will change to green (TTG) in 30 seconds, while the actual phase change occurred at 10:28:38 AM, then the prediction error at the time step of 10:28:06 AM was 2 seconds (early). On the other hand, if the actual phase change occurred at 10:28:35 AM, then the error was -1 second (late). For a deployment system, the prediction quality must be continuously maintained at satisfactory levels. In the developed prediction system, various quality monitoring modules were set up to track the quality changes. For example, one of the quality monitoring services is the so-called “green-funnel” chart, as shown in Figure 4. In Figure 4, the x-axis represents the prediction horizon (cutoff at 90 seconds), i.e., the timestamp before the actual signal switches. The y-axis represents the percentage of each prediction error range by the following color schemes: the dark green (in the middle of the color column) represents no prediction error, and each adjacent color change to both above and below represents one extra second of error. These can help analysts evaluate the trend of error ranges, and improve the prediction system. In all field demonstrations, the same quality standard was maintained throughout the test periods. Figure 4. Green-funnel chart to visualize signal state prediction data quality for both time-to-green (TTG) and time-to-red (TTR) for one day. Color legend includes the following: with the dark green as no error and lighter green represents 1 second of error, each color change represents one extra second of error. www.ite.org February 2015 41
  • 6.
    System Field Testsand Driving Experiences Field tests have given the team valuable experiences from the unique combined perspective of developers, drivers, traffic engineers, and local agencies. In particular, field demonstrations in Las Vegas and Shanghai with the Audi vehicle equipped with the traffic light info online (TLIO) system clearly illustrated the safety and mobility benefits of an eco-approach and departure system.17 For example, with TLIO, waiting at long signal cycles became a known period with the red countdown timer, and the auto-engine start at 5 seconds before lights turning green became a noticeable cue for drivers to focus on the road again. At the same time, test drivers were observed to follow speed advice from the system and avoided last-second sudden stops. Safety benefits also became apparent during field demonstra- tions. When trailing behind large trucks or tour buses, drivers were informed of the signals ahead when their view was impeded. Similarly, the dashboard display of signals served as adequate substitute at situations of impaired sight distance by curvatures or slopes, for which Flamingo Road overpass of I-15 in Las Vegas provides an excellent example. Due to its slope, drivers cannot see the traffic signal until the vehicle reaches the aperture where it can become unsafe to stop. The dashboard display of countdown timer or the speed advice gave drivers a heads-up warning of situations ahead. Additional advantages were also revealed in the field tests, such as vehicle actuations. Figure 4 shows the system functioning of one test vehicle making a left turn on southbound Las Vegas Blvd. When approaching the empty turn bay, the countdown timer is blank (Figure 5a), for without actuation the phase is not scheduled for the upcoming cycle. After the test vehicle passes the detector, the prediction system is immediately able to predict the exact time to green and thus the countdown timer display starts (Figure 5b). This gives drivers more confidence and sometimes relief, because waiting for more than 2 minutes (148 second countdown in this case) could lead a driver to the perception of malfunctioning signals and thus possible red light running. Closing Remarks As this Connected Vehicle application of eco-approach and departure has reached its maturity, the developed signal state prediction system provides the quickest way to bridge the gap between existing infrastructure and connected vehicle technologies. As shown in all test fields with extensive demo vehicle runs, this technical approach has proven its feasibility with the computing, communication, and vehicle technology existing today. Current large-scale city and region wide tests are expected to lead to imminent full-scale deployment. Agency support is critical for the development of such eco-ap- proach and departure systems. All of the mentioned field demon- strations would not have been successful or even possible without the support from the local agencies, namely Las Vegas Freeway and Arterial System of Transportation (FAST), Shanghai local traffic police, New Jersey Department of Transportation (NJDOT) and the City of Merzig, Germany. Understandably, all of these agencies were concerned with driver distraction possibilities of such connected vehicle technology; however, they became convinced by experiences gained from the demo systems. itej Figure 5. Field tests in Las Vegas, NV, USA demonstrated the quick responses of the prediction system and display in the test vehicle: (left-a) test vehicle approaching the empty left turn, the traffic light info online (TLIO) display on dashboard is blank; (right-b) once the test vehicle is detected, the prediction system is able to predict time-to-green and TLIO displays the countdown timer. ImagescourtesyofHeuschBoesefeldtAmerica 42 February 2015 ite journal
  • 7.
    Acknowledgment The authors sincerelyappreciate the support from David Chrysler and Shital Patel from Las Vegas FAST; Darren Beyer from TrafficWare; Wilke Reints, Benjamin Collar, and Axel Wienert from Siemens; Professor Zhizhou Wu from Tongji University; Dhanesh Motiani and Jeevanjot Singh from NJDOT; and Branislav Dimitrije- vic and Pavani Borra from New Jersey Institute of Technology. The authors are responsible for all facts and views in this article. References 1. Konstantinos Katsaros, et al.“Performance Study of a Green Light Optimized Speed Advisory Application Using an Integrated Cooperative ITS Simulation Platform.”Paper presented at the 7th International Wireless Communications and Mobile Computing Conference Compendium of Technical Papers, Istanbul, Turkey, July 2011: 918–923. 2. Hesham Rakha and Raj Kishore Kamalanathsharma.“Eco-driving at Signalized Intersections Using V2I Communication.”Paper presented at the 14th International Conference on Intelligent Transportation Systems, Washington, DC, USA, October 2011: 341–346. 3. Aleksandar Stevanovic, Jelka Stevanovic, and Cameron Kergaye.“Impact of Signal Phasing Information Accuracy on Green Light Optimized Speed Advisory Systems.”Paper presented at the 2013 Transportation Research Board Annual Meeting, Washington, DC, USA, January 2013. 4. Tessa Tielert, et al. “The Impact of Traffic-Light-to-Vehicle Communication on Fuel Consumption and Emissions.” Paper presented at the Internet of Things Conference, Tokyo, Japan, November 2010: 1–8. 5. “Testing Connected Vehicle Technologies in a Real-World Environment,” ITS DOT.gov, accessed December 2014, www.its.dot.gov/newsletter/ august2012.htm. 6. “SimTD Facts,”Safe and Intelligent Mobility, accessed December 2014, www. simtd.de/index.dhtml/enEN/backup_publications/Informationsmaterial.html. 7. Ulrich Haspel.“Umsetzung Kooperativer Systeme in Bayern, Strassenverkehrstechnik, ”accessed December 2014, www. baufachinformation.de/zeitschrift/Umsetzung-Kooperativer-Systeme-in- Bayern/2014109014326. 8. “NXP and Partners Launch European Test Drive to Showcase the Future of Intelligent Traffic,”NXP.com, accessed in December 2014, www.nxp.com/ news/press-releases/2014/11/nxp-and-partners-launch-european-test- drive-to-showcase-the-future-of-intelligent-traffic.html. 9. “Vehicle-Infrastructure Integration Initiative Benefit-Cost Analysis, Version 2.3.”U.S. Department of Transportation, Washington, DC, USA: May 2008. 10. Erico Guizzo.“How Google’s Self-driving Car Works,”IEEE Spectrum, accessed December 2014, http://spectrum.ieee.org/automaton/robotics/ artificial-intelligence/how-google-self-driving-car-works. 11. Emmanouil Koukoumidis, Li-Shiuan Peh, and Magaret Martonosi.“Signal Guru: Leveraging Mobile Phones For CollaborativeTraffic Signal Schedule Advisory.”Paper presented at MobiSys 2011, Bethesda, MD, USA, June 2011. 12. “Travolution,”accessed December 2014, www.travolution-ingolstadt.de/ index.php?id=2&L=1. 13. “Networked Driving with‘Traffic-light Information Online,’”Audi Urban Future Initiative, accessed December 2104, http://audi-urban-future- initiative.com/blog/location/berlin-819. 14. “Audi’sTraffic Light AssistantTells How Long until the Signal Goes Green,” Consumer Reports.org, accessed December 2104, www.consumerreports. org/cro/news/2014/01/audi-traffic-light-assist-ces-2014/index.htm. 15. “Audi Traffic Light Assistant HelpsYou Hit Every Green Light,”Autoblog. com, accessed December 2014, www.autoblog.com/2014/01/09/audi- traffic-light-assist-ces-2014. 16. “What Happens if you Fall Asleep in a Self-driving Car? Audi knows,”The Verge.com, accessed December 2014, www.theverge. com/2014/1/8/5286598/what-happens-if-you-fall-asleep-in-a-self- driving-car-audi-knows. 17. “Traffic Light Info Online,”YouTube, accessed December 2014, www. youtube.com/watch?v=a6zrRukr6W0. Thomas Bauer, P.E., PTOE is the CEO of Heusch Boesefeldt America. He has 24 years of experience in the fields of intelligent transportation systems (ITS), traffic engineering, transportation planning, transit operations, and traffic software development. Most recently, Thomas has focused on Active Transportation Demand Management (ATDM) and Connected Vehicles applications and evaluations. He holds master’s degrees in transportation engineer- ing from Oregon State University and civil engineering from the University of Stuttgart, Germany. Thomas is a member of ITE. Jingtao Ma, Ph.D., P.E. is lead engineer at Heusch Boesefeldt America. He has more than 15 years of experience in intelligent transportation systems (ITS), traffic engineering, and transportation planning. He specializes in real-time and multi-reso- lution traffic modeling and simulation and urban digital footprint analysis for transportation planning. He received his doctor of philosophy from University of California, Davis with his research on integrated corridor control that balances system efficiency and user fairness. Frank Offermann, Ph.D. is the director for business development and vehicle-to-infrastructure (V2I) technology at Heusch/Boesefeldt. He has 18 years of experience in the fields of intelligent transportation systems (ITS) and traffic engineering, focusing on solutions for urban street and freeway operations. Frank has been involved in numerous research activities in the vehicle-to-infrastructure area and is now dedicated to the market introduction of cooperative systems. He received his doctor of philoso- phy in civil engineering from RWTH Aachen University, Germany in 2000 with his research focused on data fusion of floating car data. www.ite.org February 2015 43