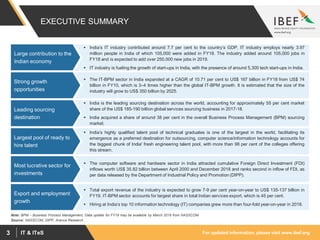
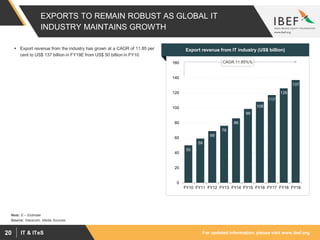
The document provides an overview of India's IT & ITeS sector. Some key points:
- India's IT industry grew at a CAGR of 10.71% from 2010-2018 and is estimated to reach $350 billion by 2025, making it a strong growth opportunity.
- India is the leading global sourcing destination, accounting for 55% of the $185-190 billion global services market in 2017-18.
- The sector employs nearly 4 million people in India and added over 105,000 jobs in 2018.
Information Technology - Industrial AnalysisSanjay Mishra
Information technology is playing an important role in India today & has transformed India’s image as a land of innovative entrepreneurs. The IT sector in India is generating 2.5 million direct employment. India is now one of the biggest IT capitals of the modern world and all the major players in the world IT sector are present in the country.
India remains a preferred destination for information technology (IT) and information technology enabled services (ITeS) in the world. The Indian IT- business process management (BPM) sector is estimated to expand at a compounded annual growth rate (CAGR) of 9.5 per cent to reach US$ 300 billion by 2020. Over 2000-13, the sector has increased at a CAGR of 25 per cent.
Total exports from the IT- BPM sector (excluding hardware) are estimated at US$ 76 billion during FY13. Export of IT services has been the major contributor, accounting for 57.9 per cent of total IT exports.
Demand from emerging countries is expected to show strong growth going forward. Tax holidays are also extended to IT sector for software technology parks of India (STPI) and special economic zones (SEZs). Further, the country is providing procedural ease and single window clearance for setting up facilities. The country’s cost competitiveness in providing IT services, which is approximately 3-4 times cheaper than the US continues to be its USP in the global sourcing market.
Disruptive technologies present an entire new gamut of opportunities for IT firms in India. Cloud represents the largest opportunity under Social, Mobility, Analytics and Cloud (SMAC), increasing at a CAGR of approximately 30 per cent to around US$ 650–700 billion by 2020. Social media is the second most lucrative segment for IT firms, offering a US$ 250 billion market opportunity by 2020.
Impact of COVID-19 on Indian IT and BPM SectorSam Ghosh
India is the world leader in IT and BPM services accounting for ~55% of the global services sourcing business.
As per a Gartner report, the global IT spending in 2020 is expected to be 8% less than in 2019. Not only that, the technology demand mix is going to be very different in the post-pandemic world than in the pre-pandemic era.
The industry which is primarily dependent on export markets is being tested by travel and VISA restrictions. This brings a lot of operational challenges for the IT Service companies.
The IT service majors are adopting cloud-based operating models that require the lesser physical presence of IT professionals, enhances the security of the cloud, and enable collaboration online.
As the recovery timeline for different countries and industries are likely to vary significantly, the IT service companies need to dynamically organise infrastructure and human resources to defend and acquire revenue opportunities.
In general, demand for Security, Collaboration, Mobility, and Cloud applications is going to drive the demand in the coming quarters.
Need for a low-touch operating model, need for hiring local talents, dynamic restructuring of human capital, etc. favour the large diversified IT Service companies over smaller players in the post-pandemic world.
Step by step – question by question – you can create your project report for bank loan, less than an hour.
A realistic project report accompanied by a detailed financial plan can make all the difference to get the funding you need. Starting a new business, planning to expand or saving your business all need a plan that works. Finline assist you in building world class project report with detailed explanations on financial ratios and projections, which are the hardest part for the entrepreneur. Similar templates for references are available in the software , so that you can rock on without any confusion.
US Economic Outlook - Being Decided - M Capital Group August 2021.pdfpchutichetpong
The U.S. economy is continuing its impressive recovery from the COVID-19 pandemic and not slowing down despite re-occurring bumps. The U.S. savings rate reached its highest ever recorded level at 34% in April 2020 and Americans seem ready to spend. The sectors that had been hurt the most by the pandemic specifically reduced consumer spending, like retail, leisure, hospitality, and travel, are now experiencing massive growth in revenue and job openings.
Could this growth lead to a “Roaring Twenties”? As quickly as the U.S. economy contracted, experiencing a 9.1% drop in economic output relative to the business cycle in Q2 2020, the largest in recorded history, it has rebounded beyond expectations. This surprising growth seems to be fueled by the U.S. government’s aggressive fiscal and monetary policies, and an increase in consumer spending as mobility restrictions are lifted. Unemployment rates between June 2020 and June 2021 decreased by 5.2%, while the demand for labor is increasing, coupled with increasing wages to incentivize Americans to rejoin the labor force. Schools and businesses are expected to fully reopen soon. In parallel, vaccination rates across the country and the world continue to rise, with full vaccination rates of 50% and 14.8% respectively.
However, it is not completely smooth sailing from here. According to M Capital Group, the main risks that threaten the continued growth of the U.S. economy are inflation, unsettled trade relations, and another wave of Covid-19 mutations that could shut down the world again. Have we learned from the past year of COVID-19 and adapted our economy accordingly?
“In order for the U.S. economy to continue growing, whether there is another wave or not, the U.S. needs to focus on diversifying supply chains, supporting business investment, and maintaining consumer spending,” says Grace Feeley, a research analyst at M Capital Group.
While the economic indicators are positive, the risks are coming closer to manifesting and threatening such growth. The new variants spreading throughout the world, Delta, Lambda, and Gamma, are vaccine-resistant and muddy the predictions made about the economy and health of the country. These variants bring back the feeling of uncertainty that has wreaked havoc not only on the stock market but the mindset of people around the world. MCG provides unique insight on how to mitigate these risks to possibly ensure a bright economic future.
how to swap pi coins to foreign currency withdrawable.DOT TECH
As of my last update, Pi is still in the testing phase and is not tradable on any exchanges.
However, Pi Network has announced plans to launch its Testnet and Mainnet in the future, which may include listing Pi on exchanges.
The current method for selling pi coins involves exchanging them with a pi vendor who purchases pi coins for investment reasons.
If you want to sell your pi coins, reach out to a pi vendor and sell them to anyone looking to sell pi coins from any country around the globe.
Below is the contact information for my personal pi vendor.
Telegram: @Pi_vendor_247
Falcon stands out as a top-tier P2P Invoice Discounting platform in India, bridging esteemed blue-chip companies and eager investors. Our goal is to transform the investment landscape in India by establishing a comprehensive destination for borrowers and investors with diverse profiles and needs, all while minimizing risk. What sets Falcon apart is the elimination of intermediaries such as commercial banks and depository institutions, allowing investors to enjoy higher yields.
Poonawalla Fincorp and IndusInd Bank Introduce New Co-Branded Credit Cardnickysharmasucks
The unveiling of the IndusInd Bank Poonawalla Fincorp eLITE RuPay Platinum Credit Card marks a notable milestone in the Indian financial landscape, showcasing a successful partnership between two leading institutions, Poonawalla Fincorp and IndusInd Bank. This co-branded credit card not only offers users a plethora of benefits but also reflects a commitment to innovation and adaptation. With a focus on providing value-driven and customer-centric solutions, this launch represents more than just a new product—it signifies a step towards redefining the banking experience for millions. Promising convenience, rewards, and a touch of luxury in everyday financial transactions, this collaboration aims to cater to the evolving needs of customers and set new standards in the industry.
Financial Assets: Debit vs Equity Securities.pptxWrito-Finance
financial assets represent claim for future benefit or cash. Financial assets are formed by establishing contracts between participants. These financial assets are used for collection of huge amounts of money for business purposes.
Two major Types: Debt Securities and Equity Securities.
Debt Securities are Also known as fixed-income securities or instruments. The type of assets is formed by establishing contracts between investor and issuer of the asset.
• The first type of Debit securities is BONDS. Bonds are issued by corporations and government (both local and national government).
• The second important type of Debit security is NOTES. Apart from similarities associated with notes and bonds, notes have shorter term maturity.
• The 3rd important type of Debit security is TRESURY BILLS. These securities have short-term ranging from three months, six months, and one year. Issuer of such securities are governments.
• Above discussed debit securities are mostly issued by governments and corporations. CERTIFICATE OF DEPOSITS CDs are issued by Banks and Financial Institutions. Risk factor associated with CDs gets reduced when issued by reputable institutions or Banks.
Following are the risk attached with debt securities: Credit risk, interest rate risk and currency risk
There are no fixed maturity dates in such securities, and asset’s value is determined by company’s performance. There are two major types of equity securities: common stock and preferred stock.
Common Stock: These are simple equity securities and bear no complexities which the preferred stock bears. Holders of such securities or instrument have the voting rights when it comes to select the company’s board of director or the business decisions to be made.
Preferred Stock: Preferred stocks are sometime referred to as hybrid securities, because it contains elements of both debit security and equity security. Preferred stock confers ownership rights to security holder that is why it is equity instrument
<a href="https://www.writofinance.com/equity-securities-features-types-risk/" >Equity securities </a> as a whole is used for capital funding for companies. Companies have multiple expenses to cover. Potential growth of company is required in competitive market. So, these securities are used for capital generation, and then uses it for company’s growth.
Concluding remarks
Both are employed in business. Businesses are often established through debit securities, then what is the need for equity securities. Companies have to cover multiple expenses and expansion of business. They can also use equity instruments for repayment of debits. So, there are multiple uses for securities. As an investor, you need tools for analysis. Investment decisions are made by carefully analyzing the market. For better analysis of the stock market, investors often employ financial analysis of companies.
how can i use my minded pi coins I need some funds.DOT TECH
If you are interested in selling your pi coins, i have a verified pi merchant, who buys pi coins and resell them to exchanges looking forward to hold till mainnet launch.
Because the core team has announced that pi network will not be doing any pre-sale. The only way exchanges like huobi, bitmart and hotbit can get pi is by buying from miners.
Now a merchant stands in between these exchanges and the miners. As a link to make transactions smooth. Because right now in the enclosed mainnet you can't sell pi coins your self. You need the help of a merchant,
i will leave the telegram contact of my personal pi merchant below. 👇 I and my friends has traded more than 3000pi coins with him successfully.
@Pi_vendor_247
The Evolution of Non-Banking Financial Companies (NBFCs) in India: Challenges...beulahfernandes8
Role in Financial System
NBFCs are critical in bridging the financial inclusion gap.
They provide specialized financial services that cater to segments often neglected by traditional banks.
Economic Impact
NBFCs contribute significantly to India's GDP.
They support sectors like micro, small, and medium enterprises (MSMEs), housing finance, and personal loans.
Exploring Abhay Bhutada’s Views After Poonawalla Fincorp’s Collaboration With...beulahfernandes8
The financial landscape in India has witnessed a significant development with the recent collaboration between Poonawalla Fincorp and IndusInd Bank.
The launch of the co-branded credit card, the IndusInd Bank Poonawalla Fincorp eLITE RuPay Platinum Credit Card, marks a major milestone for both entities.
This strategic move aims to redefine and elevate the banking experience for customers.
Turin Startup Ecosystem 2024 - Ricerca sulle Startup e il Sistema dell'Innov...Quotidiano Piemontese
Turin Startup Ecosystem 2024
Una ricerca de il Club degli Investitori, in collaborazione con ToTeM Torino Tech Map e con il supporto della ESCP Business School e di Growth Capital
What website can I sell pi coins securely.DOT TECH
Currently there are no website or exchange that allow buying or selling of pi coins..
But you can still easily sell pi coins, by reselling it to exchanges/crypto whales interested in holding thousands of pi coins before the mainnet launch.
Who is a pi merchant?
A pi merchant is someone who buys pi coins from miners and resell to these crypto whales and holders of pi..
This is because pi network is not doing any pre-sale. The only way exchanges can get pi is by buying from miners and pi merchants stands in between the miners and the exchanges.
How can I sell my pi coins?
Selling pi coins is really easy, but first you need to migrate to mainnet wallet before you can do that. I will leave the telegram contact of my personal pi merchant to trade with.
Tele-gram.
@Pi_vendor_247
how to sell pi coins on Bitmart crypto exchangeDOT TECH
Yes. Pi network coins can be exchanged but not on bitmart exchange. Because pi network is still in the enclosed mainnet. The only way pioneers are able to trade pi coins is by reselling the pi coins to pi verified merchants.
A verified merchant is someone who buys pi network coins and resell it to exchanges looking forward to hold till mainnet launch.
I will leave the telegram contact of my personal pi merchant to trade with.
@Pi_vendor_247
1. For updated information, please visit www.ibef.orgIT & ITeS1
For updated information, please visit www.ibef.org March 2019
IT & ITeS
2. For updated information, please visit www.ibef.orgIT & ITeS2
Table of Content
Advantage India……………..….……… 4
Market Overview ………..…………..…. 6
Growth Drivers and Opportunities....….18
Key Industry Organisations.............…. 29
Recent Trends and Strategies……...…14
Executive Summary………….….…..… 3
3. For updated information, please visit www.ibef.orgIT & ITeS3
EXECUTIVE SUMMARY
The IT-BPM sector in India expanded at a CAGR of 10.71 per cent to US$ 167 billion in FY18 from US$ 74
billion in FY10, which is 3–4 times higher than the global IT-BPM growth. It is estimated that the size of the
industry will grow to US$ 350 billion by 2025.
Strong growth
opportunities
India is the leading sourcing destination across the world, accounting for approximately 55 per cent market
share of the US$ 185-190 billion global services sourcing business in 2017-18.
India acquired a share of around 38 per cent in the overall Business Process Management (BPM) sourcing
market.
Leading sourcing
destination
India’s highly qualified talent pool of technical graduates is one of the largest in the world, facilitating its
emergence as a preferred destination for outsourcing, computer science/information technology accounts for
the biggest chunk of India' fresh engineering talent pool, with more than 98 per cent of the colleges offering
this stream.
Largest pool of ready to
hire talent
The computer software and hardware sector in India attracted cumulative Foreign Direct Investment (FDI)
inflows worth US$ 35.82 billion between April 2000 and December 2018 and ranks second in inflow of FDI, as
per data released by the Department of Industrial Policy and Promotion (DIPP).
Most lucrative sector for
investments
Total export revenue of the industry is expected to grow 7-9 per cent year-on-year to US$ 135-137 billion in
FY19. IT-BPM sector accounts for largest share in total Indian services export, which is 45 per cent.
Hiring at India’s top 10 information technology (IT) companies grew more than four-fold year-on-year in 2018.
Export and employment
growth
Source: NASSCOM, DIPP, Aranca Research
Note: BPM – Business Process Management, Data update for FY19 may be available by March 2019 from NASSCOM
India’s IT industry contributed around 7.7 per cent to the country’s GDP. IT industry employs nearly 3.97
million people in India of which 105,000 were added in FY18. The industry added around 105,000 jobs in
FY18 and is expected to add over 250,000 new jobs in 2019.
IT industry is fueling the growth of start-ups in India, with the presence of around 5,300 tech start-ups in India.
Large contribution to the
Indian economy
5. For updated information, please visit www.ibef.orgIT & ITeS5
ADVANTAGE INDIA
Strong growth in demand for exports from new
verticals.
Rapidly growing urban infrastructure has
fostered several IT centres in the country.
Expanding economy to propel growth in local
demand.
Indian IT firms have delivery centres across
the world.
IT & ITeS industry is well diversified across
verticals such as BFSI, telecom and retail.
Increasing strategic alliance between domestic
and international players to deliver solutions
across the globe.
India has a low-cost advantage by being 5-6
times inexpensive than US.
A preferred destination for IT & ITeS in the
world; continues to be a leader in the global
sourcing industry with 55 per cent market
share.
Tax exemption of three years in a block of
seven years to start-ups under ‘Startup India’.
More liberal system for raising global capital,
funding for seed capital and growth and ease of
doing business, etc. have been addressed.
ADVANTAGE
INDIA
Note: SEZ stands for Special Economic Zone, BFSI stands for Banking, Financial Services and Insurance, E stands for Estimate, F stands for Forecast, AI* - Artificial Intelligence
Source : Nasscom, News sources
In the Interim Budget 2019-20, the Government of India
announced plans to launch a national programme on AI* and
setting up of a National AI* portal.
In February 2019, the Government of India released the National
Policy on Software Products 2019 to develop India as a software
product nation
7. For updated information, please visit www.ibef.orgIT & ITeS7
EVOLUTION OF THE INDIAN IT SECTOR
By early 90s, US-based
companies began to
outsource work on low-
cost and skilled talent pool
in India.
Firms in India grew in terms
of their size and scope of
services offered as more
and more western
companies setup their bases
in the country.
The US$ 167 billion Indian IT industry
employs nearly four million people.
India ranks third among global start-up
ecosystems with more than 5,300 tech
start-ups.
Indian IT and BPM industry is expected to
grow to US$ 350 billion by 2025
With increased investment
in R & D, India became a
product development
destination.
Firms in India became multinational
companies with delivery centres
across the globe
India’s IT sector is at an inflection
point, moving from enterprise
servicing to enterprise solutions
Pre-1995 2005-20162000-05 20171995-2000
8. For updated information, please visit www.ibef.orgIT & ITeS8
SEGMENTS OF INDIA’S IT SECTOR
Market Size: US$ 92.49
billion during FY19E.
Over 81 per cent of revenue
comes from the export
market.
BFSI continues to be the
major vertical of the IT
sector.
IT services had around 51
per cent share in total Indian
IT sector revenues in FY19E.
Market size: US$ 36.2 billion
during FY19E.
Around 87 per cent of
revenue comes from the
export market.
Market size of BPM industry
to reach US$ 54 billion by
FY25.
BPM segment had around 20
per cent share in Indian IT
sector revenues in FY19E.
Market size: US$ 34.39
billion during FY19E.
Over 83.9 per cent of
revenue comes from exports.
The software products and
engineering services
segment grew 10.5 per cent
in FY17.
It had around 19 per cent
share in Indian IT sector
revenues in FY19E.
Market size: US$ 14.48
billion in FY19E.
The domestic market
accounts for a significant
share.
The segment had around 8
per cent share in Indian IT
sector revenues in FY19E.
Hardware exports from India
are expected to grow at 7-8
per cent in FY19.^
Source: NASSCOM, Aranca Research, News sources
Notes: E – estimated, ^As per Electronics and Computer Software Export Promotion Council
IT & ITeS sector
IT services
Business Process
Management
Software products and
engineering services
Hardware
9. For updated information, please visit www.ibef.orgIT & ITeS9
INDIA’S IT MARKET SIZE GROWING
Source: NASSCOM, Gartner, Aranca Research
24
29 32 32 32 34 35 37 41 44.0
50
59
69
76
87
98.5
108
117
126
137
0
20
40
60
80
100
120
140
160
180
200
Domestic^ Export
IT BPM industry revenues (excluding hardware) was estimated at
around US$ 167 billion in FY 2017-18 and grew to US$ 181 billion in
FY2018-19.
The contribution of the IT sector to India’s GDP stood at 7.9 per cent
in 2017-18.
The domestic revenue^ of the IT industry is estimated at US$ 44
billion and export revenue is estimated at US$ 137 billion in FY19.
The market size of India’s IT-BPM sector is expected to grow to US$
350 billion by 2025 and BPM is expected to account for US$ 50-55
billion out of the total revenue.
Spending on Information Technology in India is expected to grow
over 9 per cent to reach US$ 87.1 billion in 2018.*
Outsourcing of large technology contracts by clients is expected to
accelerate the growth of the industry in FY20.
Visakhapatnam port traffic (million tonnes)Market size of IT industry in India (US$ billion)
Note: E – estimate, *As per Gartner, ^Including Hardware, #CAGR is for total of domestic and export
#CAGR 10.45 %
10. For updated information, please visit www.ibef.orgIT & ITeS10
STRONG GROWTH IN IT & ITeS EXPORTS
Total exports from the IT-BPM sector (including hardware) were estimated to have been US$ 137 billion during FY19; exports rose at a CAGR of
12.26 per cent during FY09–18.
Export of IT services has been the major contributor, accounting for 57.00 per cent of total IT exports (including hardware) during FY18
BPO and E R&D and software products exports accounted for 21.20 per cent and 21.80 per cent of total IT exports during FY18, respectively.
ER&D market is expected to grow to US$ 42 billion by 2022 from US$ 28 billion, currently.
Total export revenue of the industry is expected to grow 7-9 per cent year-on-year to US$ 135-137 billion in FY19.
Source: Nasscom, Make in India, IDC
Note: E – estimated, Data update for FY19 may be available by April 2019
Sector-wise breakup of export revenue (FY18)
57.00%
21.20%
21.80% IT Services
BPO
E R&D and software
products
25.8 25.8 33.5 39.9 43.9 52.0
55.5
61.0 66.0 70.0
9.9 11.7
14.1
15.9 17.8
20.0 23.0
24.4
26 28
8.8 10.0 11.4
13.0
14.1
14.0 20.0
22.4
25.0
28.0
0.0
20.0
40.0
60.0
80.0
100.0
120.0
140.0
FY09
FY10
FY11
FY12
FY13
FY14
FY15
FY16
FY17
FY18E
IT services BPM Software Products and Engg. Services
CAGR 12.26 %
Growth in export revenue (US$ billion)
11. For updated information, please visit www.ibef.orgIT & ITeS11
BFSI - A KEY BUSINESS VERTICAL FOR IT-BPM
INDUSTRY
BFSI is a key business vertical for the IT-BPM industry. A major
share of revenue of IT majors comes from the BFSI business
vertical.
Adoption of new technologies is expected to accelerate growth of the
BFSI vertical. The need for undertaking investments in IT will also be
required for gaining competitive advantage instead of solely for
reducing operational costs.
Revenue growth in the BFSI vertical stood at 6.8 per cent y-o-y
between July-September 2018.
Source: NASSCOM Quarterly Review, Ministry of Electronics and IT Annual Report, Company Financial Results and Factsheets
Note: BFSI - Banking, Financial Services and Insurance, mentioned figures are for IT and BPM only and do not include engineering services and hardware exports, ^For the ‘Financial
Services’ vertical, *Sum of ‘BFS’ and ‘Insurance’ verticals
Revenue share of IT majors from BFSI (Q3 FY19)
13.40%
24.80%
31.40%
31.60%
32.50%
46.70%
0.00%
5.00%
10.00%
15.00%
20.00%
25.00%
30.00%
35.00%
40.00%
45.00%
50.00%
TechMahindra
Mindtree
Wipro
TCS
Infosys^
L&TInfotech*
12. For updated information, please visit www.ibef.orgIT & ITeS12
WITH OVER 62 PER CENT SHARE, US IS MAJOR
IMPORTER OF IT SERVICES
US has traditionally been the biggest importer of Indian IT exports;
over 62 per cent of Indian IT-BPM exports were absorbed by the US
during FY18.
Non US-UK countries accounted for just 21 per cent of total Indian
IT-BPM exports during FY18.
As of FY18, US and UK are the leading customer markets with a
combined share of nearly 80 per cent . However, there is growing
demand from APAC, Latin America and Middle East Asia.
Being the low cost exporter of IT services, India is going to attract
more markets in other regions in the same manner it tapped US
markets.
62
17
11
8
2
US UK Europe (ex-UK) Asia RoW
Geographic breakup of export revenue in 2017-18 (percentage)
Source: Nasscom, Department of Electronics and IT Annual Report
Note: ROW is Rest Of the World, APAC is Asia Pacific, Data update for FY19 may be available by April 2019
13. For updated information, please visit www.ibef.orgIT & ITeS13
IT-BPM SECTOR DOMINATED BY LARGE PLAYERS
Category
Number of
players
Percentage of total
export revenue
Percentage of total
employees
Work Focus
Large 11 47-50% ~35-38%
Fully integrated players offering complete range of services
Large scale operations and infrastructure
Presence in over 60 countries
Medium 120-150 32-35% ~28-30%
Mid tier Indian and MNC firms offering services in multiple
verticals
Dedicated captive centres
Near shore and offshore presence in more than 30-35 countries
Emerging
~1,000-
1,200
9-10% ~15-20%
Players offering niche IT-BPM services
Dedicated captives offering niche services
Expanding focus towards sub Fortune 500/1,000 firms
Small ~15,000 9-10% ~15-18%
Small players focussing on specific niches in either services or
verticals
Includes Indian providers and small niche captives
Source: Nasscom
14. For updated information, please visit www.ibef.orgIT & ITeS14
IT & ITeS
RECENT TRENDS
AND STRATEGIES
15. For updated information, please visit www.ibef.orgIT & ITeS15
NOTABLE TRENDS
Indian software product industry is expected to reach the mark of US$ 100 billion by 2025. Indian companies
have set up over 1,000 global delivery centres in about 80 countries over the world.
Global delivery
model
India is a prominent sourcing destination across the world, accounting for approximately 55 per cent market
share in the global services sourcing business, as of FY18.
India acquired a share of around 38 per cent in the overall Business Process Management (BPM) sourcing
market.
Leading sourcing
destination
Fall in automation costs and rise of digital has led to higher onshoring by the industry.
Onshore revenue of Indian IT industry* has grown from around 48 per cent in 2011-12 to 55.2 per cent for the
quarter ended June 2018^.
Rise of onshoring
Disruptive technologies, such as cloud computing, social media and data analytics, are offering new avenues
of growth across verticals for IT companies
The SMAC (social, mobility, analytics, cloud) market is expected to grow to US$ 225 billion by 2020
New technologies
India’s IT sector is gradually moving from linear models (rising headcount to increase revenue) to non-linear
ones
In line with this, IT companies in India are focusing on new models such as platform-based BPM services and
creation of intellectual property
Growth in non-linear
models
Large players with a wide range of capabilities are gaining ground as they move from being simple
maintenance providers to full service players, offering infrastructure, system integration and consulting
services
Of the total revenue, about 80 per cent is contributed by 200 large and medium players
Large players gaining
advantage
Note: *Company financials of top listed companies – NASSCOM, ^NASSCOM Quarterly Industry Review September 2018
16. For updated information, please visit www.ibef.orgIT & ITeS16
NOTABLE TRENDS
Social, Mobility, Analytics and Cloud (SMAC), a paradigm shift in IT-BPM approaches experienced until now,
is leading to digitisation of the entire business model
SMAC technologies, an
inflection point for Indian
IT
The National Optical Fibre Network (NOFN) is being laid down in phases to connect all the 250,000 gram
panchayats in the country.
Rural Development
The computer software and hardware sector in India attracted cumulative Foreign Direct Investment (FDI)
inflows worth US$ 35.82 billion between April 2000 and December 2018, according to data released by the
Department of Industrial Policy and Promotion (DIPP).
Most lucrative sector for
investments
Tier II and III cities are increasingly gaining traction among IT companies, aiming to establish business in
India.
Cheap labour, affordable real estate, favourable government regulations, tax breaks and SEZ schemes
facilitating their emergence as a new IT destination
Giving rise to the domestic hub and spoke model, with Tier I cities acting as hubs and Tier II, III and IV as
network of spokes.
Emergence of Tier II cities
India’s IT market is experiencing a significant shift from a few large-size deals to multiple small-size ones
The number of start-ups in technology is expected to reach 50000, adding to around 2 per cent of GDP
Delivery models are being altered, as the business is moving to capital expenditure (Capex) based models
from operational expenditure (Opex), from a vendor’s frame of reference
Changing business
dynamics
17. For updated information, please visit www.ibef.orgIT & ITeS17
STRATEGIES ADOPTED
Social Computing, Mobility, Analytics and Cloud (SMAC) is taking significant leaps
Companies are getting into this field by offering big data services, which provides clients better insights for
future cases
Movement to SMAC and
digital space
Knowledge services, data analytics, legal services, Business Process as a Service (BPaaS), cloud-based
services
Fast-growing sectors
within the BPM domain
Companies are now investing a lot in R&D and training employees to create an efficient workforce, enhancing
productivity and quality
R & D forms a significant portion of companies’ expenses, which is critical when margins are in pressure, to
promote innovations in the changing landscape
Promotion of R&D
Companies are expanding their business to Tier II and III cities to have low cost advantage
In October 2018, HCL Technologies laid the foundation stone for a new global IT development centre at
Vijayawada. The facility will come up over 29.86 acres at an investment of Rs 700 crore (US$ 99.74 million).
Companies are expanding their business towards emerging economies of East Europe and Latin American
countries
Expanding in Tier II and
III cities and externally
Most of the IT companies have been offering similar products and services to their clients
The companies are working towards product differentiation through various other services by branding
themselves, e.g. Building Tomorrow's Enterprise by Infosys
Indian IT firms have started to adopt pricing strategies to compete with Global firms like IBM and Accenture
Product and Pricing
differentiation
18. For updated information, please visit www.ibef.orgIT & ITeS18
IT & ITeS
GROWTH DRIVERS
AND OPPORTUNITIES
19. For updated information, please visit www.ibef.orgIT & ITeS19
IT SECTOR TO BE DRIVEN BY STRONG DEMAND AND
INDIAN EXPERTISE
Note: STPI stands for Software Technology Park of India, SEZ stands for Special Economic Zone, ICT - Information and communications technology, IT-BPM – Information Technology
Business Process Management, AI* - Artificial Intelligence
Source: Nasscom, News Articles
Nasscom has launched an online platform
which is aimed at up-skilling over 2 million
technology professionals and skilling another
2 million potential employees and students.
Strong mix of young and experienced
professionals
IT service giant DXC Technology has decided
to set up its first global analytics unit in
Bengaluru to leverage the skill set that India
offers.
Computer penetration expected to increase
Increasing adoption of technology and
telecom by consumers and focused
government initiatives leading to increased
ICT adoption
Robust IT infrastructure across various cities in India such
as Bengaluru
Technology mission for services in villages and schools,
training in IT skills and E-Kranti for government service
delivery and governance scheme
Global BPM spending estimated to rise and
reach to US$ 233 billion by 2020
Tax holidays for STPI and SEZs
More liberal system for raising capital,
seed money and ease of doing
business.
In the Interim Budget 2019-20, the
Government of India announced plans
to launch a national programme on AI*
and setting up of a National AI* portal.
Government of India has identified
Information Technology as one of the
12 champion service sectors for which
an action plan is being developed. Also,
the government has set up a Rs 5,000
crore (US$ 745.82 million) fund for
realising the potential of these
champion service sectors.
Growth
Drivers
Global
Demand
Talent
Pool
Policy
Support
Domestic
Growth
Infrastructure
20. For updated information, please visit www.ibef.orgIT & ITeS20
EXPORTS TO REMAIN ROBUST AS GLOBAL IT
INDUSTRY MAINTAINS GROWTH
Export revenue from the industry has grown at a CAGR of 11.85 per
cent to US$ 137 billion in FY19E from US$ 50 billion in FY10.
Export revenue from IT industry (US$ billion)
50
59
69
76
86
99
108
117
126
137
0
20
40
60
80
100
120
140
160
FY10 FY11 FY12 FY13 FY14 FY15 FY16 FY17 FY18 FY19
Source: Nasscom, Media Sources
Note: E – Estimate
CAGR 11.85%%
21. For updated information, please visit www.ibef.orgIT & ITeS21
DIGITAL EXPORTS TO BE A MAJOR GROWTH DRIVER
Export revenue from Digital (US$ billion)
11
16
25
33
0
5
10
15
20
25
30
35
FY16 FY17 FY18 FY19E
CAGR 44.22%
Global digital spend is expected to increase from US$ 180 billion in
2017 to US$ 310 billion by 2020.
India’s IT industry is increasingly focusing on digital opportunities as
digital is poised to be a major segment in the next few years. It is
also currently the fastest growing segment, growing over 30 per cent
annually.
Export revenue from digital segment already forms about 20 per
cent of the industry’s total export revenue. The figure was estimated
at US$33 billion in FY19.
Revenue from digital segment is expected to comprise 38 per cent
of the forecasted US$ 350 billion industry revenue by 2025.^
India has become the digital capabilities hub of the world:
• More than 8,100 firms offer digital solutions
• Digitally skilled talent pool of 450,000-500,000
• 75 per cent of global digital talent in India
Source: Nasscom, IDC, Media Sources
Note: ^According to Nasscom, E – Estimated, FY18 export figures are estimated between US$ 22-25 billion by NASSCOM
22. For updated information, please visit www.ibef.orgIT & ITeS22
INDIAN TALENT POOL READY TO TAKE IT SECTOR TO
THE NEXT LEVEL
Source: Nasscom, Everest Group
Note: *Refers to graduates with Bachelors degree in engineering (four-year degree course)
Availability of skilled English speaking workforce has been a major
reason behind India’s emergence as a global outsourcing hub.
The number of engineering graduates has increased from 651,000
in 2013 to an estimated 779,000 in 2017 and is further expected to
grow to 802,000 by 2020. Indian IT industry is expected to add
around 250,000 new jobs in 2019.
Employment in the sector reached 3.97 million in 2017-18. An
addition of around 105,000 was witnessed in FY18. Online hiring
activity in IT software sector increased 28 per cent year-on-year.
India BPO promotion scheme was approved under Digital India
programme. It aims to create employment opportunities for the
youth and promote investments in the IT&ITeS industry. Under the
scheme employment has already been created for more than 10,000
individuals.
India’s top 10 Information technology companies added about
114,390 engineers to its workforce in 2018 against 22,156 in 2017.
651
707
753
771 779 787 794 802
0
100
200
300
400
500
600
700
800
900
2013 2014 2015 2016 2017 2018E 2019E 2020E
Annual entry-level talent pool in India* (in 000s)
23. For updated information, please visit www.ibef.orgIT & ITeS23
SEZ’S TO DRIVE IT SECTOR; TIER II CITIES EMERGE
AS NEW CENTERS
Source: EY, Nasscom
Note: SEZ – Special Economic Zone, STPI (Software Technology Parks of India)
Parameters STPI SEZ
Term 10 years 15 years
Fiscal benefits
100 per cent tax
holiday on export
profits
Exemption from
excise duties and
customs
100 per cent tax
holiday on exports
for first 5 years
Exemption from
excise duties and
customs
Location and
size restrictions
No location
constraints
23 per cent STPI
units in tier II and III
cities
Restricted to
prescribed zones
with a minimum area
of 25 acres
IT-SEZs have been initiated with an aim to create zones that lead to
infrastructural development, exports and employment
As of January 22, 2019, there were 231 exporting SEZs across the
country
Over 50 cities already have basic infrastructure and human resource
to support the global sourcing and business services industry. Some
cities are expected to emerge as regional hubs supporting domestic
companies
Software Technology Parks of India (STPI) has set up 57 centres
across the country which provide single window clearance and
infrastructure facilities. Under STP scheme, STP units can avail
Excise Duty exemptions on procurement of indigenously
manufactured goods.
1,821 1,615
175
3,230
-
1,000
2,000
3,000
4,000
5,000
6,000
2008 2018
Tier I locations Tier II locations
IT sector employment distribution
in Tier I and Tier II/III cities
24. For updated information, please visit www.ibef.orgIT & ITeS24
TREMENDOUS GROWTH OF GLOBAL IN–HOUSE
CENTRES
Number of GIC’s in India
180
450
700
760
825
1,025
1,050
1,100
1,140
-
200
400
600
800
1,000
1,200
2000 2005 2010 2012 2013 2015^ 2016 2017 2018*
Source: Zinnov, Nasscom,
Global In-House Centres (GIC), also known as captive centres, are one of the major growth drivers of the IT-BPM sector in India. They also
operate in engineering services and software product development.
As of March 2018, there were over 1,140 GICs operating out of India. Revenue of GICs of India has increased at a CAGR of 15.18 per cent
between FY03-FY18 to touch US$ 25.0 billion in FY18.
The impact of the segment goes beyond revenue and employment, as it helps in developing India as a R&D hub and create an innovation
ecosystem in the country
Within the captive landscape, Engineering Research and Development/Software Product Development (ER&D/SPD) is the largest sub-segment.
To drive innovation in new technology, Asian firms have started setting up their research and development (R&D) units, also known as GICs, in
India.
Note: 2018* - Data taken from NASSCOM Strategic Review 2018, ^As of end of financial year, Data update for FY19 may be available by March 2019
Revenue of GIC’s in India
3.0
10.7 11.5
15.5
19.4
21.5
25.0
0
5
10
15
20
25
30
FY03 FY09 FY10 FY14 FY15 FY16 FY18
CAGR 15.18%
25. For updated information, please visit www.ibef.orgIT & ITeS25
IMPRESSIVE GROWTH PROSPECTS SUSTAIN PE AND
VC INTEREST
Source: The Indian Private Equity and Venture Capital Association
Note: Data for first quarter of both years has been calculated by deducting Q2 investments from H1 investments, LHS – Left Hand Side axis, RHS – Right Hand Side axis
PE and VC investments in IT & ITeS (US$ million)
3200.0
2400.0
3200.0
1400.0
1000.0
2600.0
3200.0
2400.0
79.0
71.0
68.0
96.0
75.0
73.0
55.0
53.0
0.0
20.0
40.0
60.0
80.0
100.0
120.0
0.0
500.0
1000.0
1500.0
2000.0
2500.0
3000.0
3500.0
Q12017
Q22017
Q32017
Q42017
Q12018
Q22018
Q32018
Q42018
PE Investments (LHS) VC Investments (RHS)
IT & ITeS is the leading sector in receipts of private equity (PE)
investments in India.
PE investments in the sector stood at US$ 2,400 million in Q4 2018.
Venture Capital (VC) investments in the IT & ITeS sector stood at
US$ 53.0 million during Q4 2018.
26. For updated information, please visit www.ibef.orgIT & ITeS26
Government, healthcare, media and
utilities together have IT spend of
approximately US$ 190 billion, but account
just 8 per cent of India’s IT revenue
Non-linear growth due to platforms,
products and automation
Emerging verticals (retail, healthcare,
utilities) are driving growth
BRIC nations, continental Europe, Canada
and Japan have IT spending of
approximately US$ 380–420 billion
Adoption of technology and outsourcing is
expected to make Asia the 2nd largest IT
market
SMBs have IT spend of approximately US$
230–250 billion, but contribute just 25 per
cent to India’s IT revenue
The emergence of new service offerings
and business models would aid in tapping
market profitably and efficiently
NEWER GEOGRAPHIES AND VERTICALS PROVIDE
HUGE OPPORTUNITIES
New
verticals
New customer
segments
New
geographies
Source: International Data Corporation (IDC), Nasscom
Note: SMB - Small and Medium Businesses
27. For updated information, please visit www.ibef.orgIT & ITeS27
EXPANSION OF FOCUS AREAS TO AID FUTURE
GROWTH … (1/2)
Market size of other progressing verticals by 2020 (US$ billion)
Source: Nasscom, Gartner
Note: SMB - Small and Medium Business
Technologies, such as telemedicine, health, remote monitoring
solutions and clinical information systems, would continue to boost
demand for IT service across the globe
IT sophistication in the utilities segment and the need for
standardisation of the process are expected to drive demand
Digitisation of content and increased connectivityis leading to a rise in
IT adoption by media
RBI is executing a plan to reduce online transaction costs to encourage
digital banking in India
The rollout of Fifth Generation (5G) wireless technology by
telecommunicationcompanies is expected to bring at least US$ 10
billion global business to Indian IT firms by 2019-25
17
25
58
90
250
0 50 100 150 200 250 300
MediaUtilitiesHealthcareGovernmentSMB
28. For updated information, please visit www.ibef.orgIT & ITeS28
EXPANSION OF FOCUS AREAS TO AID FUTURE
GROWTH … (2/2)
Emerging geographies would drive the next growth phase for IT firms in India
BRIC would provide US$ 380–420 billion opportunity by 2020
Focus on building local credible presence, high degree of domain expertise at competitive costs and attaining operational excellence hold key to
success in new geographies
Emphasis on export of IT services to current importers of other products and services
Country IT spend India’s penetration Key segments
Canada US$ 63 billion ~1.5 per cent Enterprise applications, cyber security, healthcare IT
Europe US$ 230 billion <1.5 per cent IT sourcing, BPM, IS outsourcing, CAD
Japan US$ 235 billion <1 per cent CRM, ERP, Salesforce automation, SI
Spain US$ 26 billion <1.5 per cent IT sourcing, SI
Mexico US$ 29 billion ~4 per cent IT sourcing, BPM
Brazil US$ 47 billion ~2 per cent Low level application management, artificial intelligence, R D
China US$ 105 billion <1 per cent Software outsourcing, R D
Australia US$ 48 billion ~4 per cent Procurement outsourcing, infrastructure software and CAD
Countries offering growth potential to IT firms
Source: Nasscom
29. For updated information, please visit www.ibef.orgIT & ITeS29
IT & ITeS
KEY INDUSTRY
ORGANISATIONS
30. For updated information, please visit www.ibef.orgIT & ITeS30
INDUSTRY ORGANISATIONS
Address: Electronics Niketan, 6, CGO Complex,
Lodhi Road, New Delhi - 110 003
Phone: 91 11 2436 9191
Fax: 91 11 2436 2626
E-mail: mljoffice@gov.in
Website: http://meity.gov.in/
Ministry of Electronics and Information Technology (MeitY)
Address: 155, Okhla Phase III, Okhla Industrial Area, New Delhi, Delhi –
110 020
Phone: 91 11 4748 0000
E-mail: info@escindia.com
Website: https://www.escindia.in/
Electronics and Software Exports Promotion Council (ESC)
Address: Ninth Floor, NDCC-II,Jai Singh Road (Opposite Jantar
Mantar), New Delhi – 110 001
Phone: 91 11 2343 8188
Fax: 91 11 2343 8173
Website: https://www.stpi.in/
Software Technology Parks of India
Address: International Youth Centre Teen Murti Marg, Chanakyapuri,
New Delhi – 110 021
Phone: 91 11 2301 0199
Fax: 91 11 2301 5452
E-mail: info@nasscom.in
Website: https://www.nasscom.in/
National Association of Software and Services Companies
(NASSCOM)
32. For updated information, please visit www.ibef.orgIT & ITeS32
GLOSSARY
APAC: Asia Pacific
BFSI: Banking, Financial Services and Insurance
BPM: Business Process Outsourcing
CAGR: Compounded Annual Growth Rate
C U: Construction and Utilities
FDI: Foreign Direct Investment
GOI: Government of India
INR: Indian Rupee
IT & ITeS: Information Technology-Information Technology Enabled Services
NAC: Nasscom Assessment of Competence
RoI: Return on Investment
ROW: Rest of the World
SEZ: Special Economic Zone
SMB: Small and Medium Businesses
STPI: Software Technology Parks of India
T M: Telecom and Media
T T: Travel and Transport
US$ : US Dollar
UT: Union Territory
Wherever applicable, numbers have been rounded off to the nearest whole number
33. For updated information, please visit www.ibef.orgIT & ITeS33
EXCHANGE RATES
Exchange Rates (Fiscal Year) Exchange Rates (Calendar Year)
Year INR INR Equivalent of one US$
2004–05 44.95
2005–06 44.28
2006–07 45.29
2007–08 40.24
2008–09 45.91
2009–10 47.42
2010–11 45.58
2011–12 47.95
2012–13 54.45
2013–14 60.50
2014-15 61.15
2015-16 65.46
2016-17 67.09
2017-18 64.45
Q1 2018-19 67.04
Q2 2018-19 70.18
Q3 2018-19 72.15
Year INR Equivalent of one US$
2005 44.11
2006 45.33
2007 41.29
2008 43.42
2009 48.35
2010 45.74
2011 46.67
2012 53.49
2013 58.63
2014 61.03
2015 64.15
2016 67.21
2017 65.12
2018 68.36
Source: Reserve Bank of India, Average for the year
34. For updated information, please visit www.ibef.orgIT & ITeS34
DISCLAIMER
India Brand Equity Foundation (IBEF) engaged Aranca to prepare this presentation and the same has been prepared by Aranca in consultation
with IBEF.
All rights reserved. All copyright in this presentation and related works is solely and exclusively owned by IBEF. The same may not be reproduced,
wholly or in part in any material form (including photocopying or storing it in any medium by electronic means and whether or not transiently or
incidentally to some other use of this presentation), modified or in any manner communicated to any third party except with the written approval
of IBEF.
This presentation is for information purposes only. While due care has been taken during the compilation of this presentation to ensure that the
information is accurate to the best of Aranca and IBEF’s knowledge and belief, the content is not to be construed in any manner whatsoever as a
substitute for professional advice.
Aranca and IBEF neither recommend nor endorse any specific products or services that may have been mentioned in this presentation and nor do
they assume any liability or responsibility for the outcome of decisions taken as a result of any reliance placed on this presentation.
Neither Aranca nor IBEF shall be liable for any direct or indirect damages that may arise due to any act or omission on the part of the user due to any
reliance placed or guidance taken from any portion of this presentation.