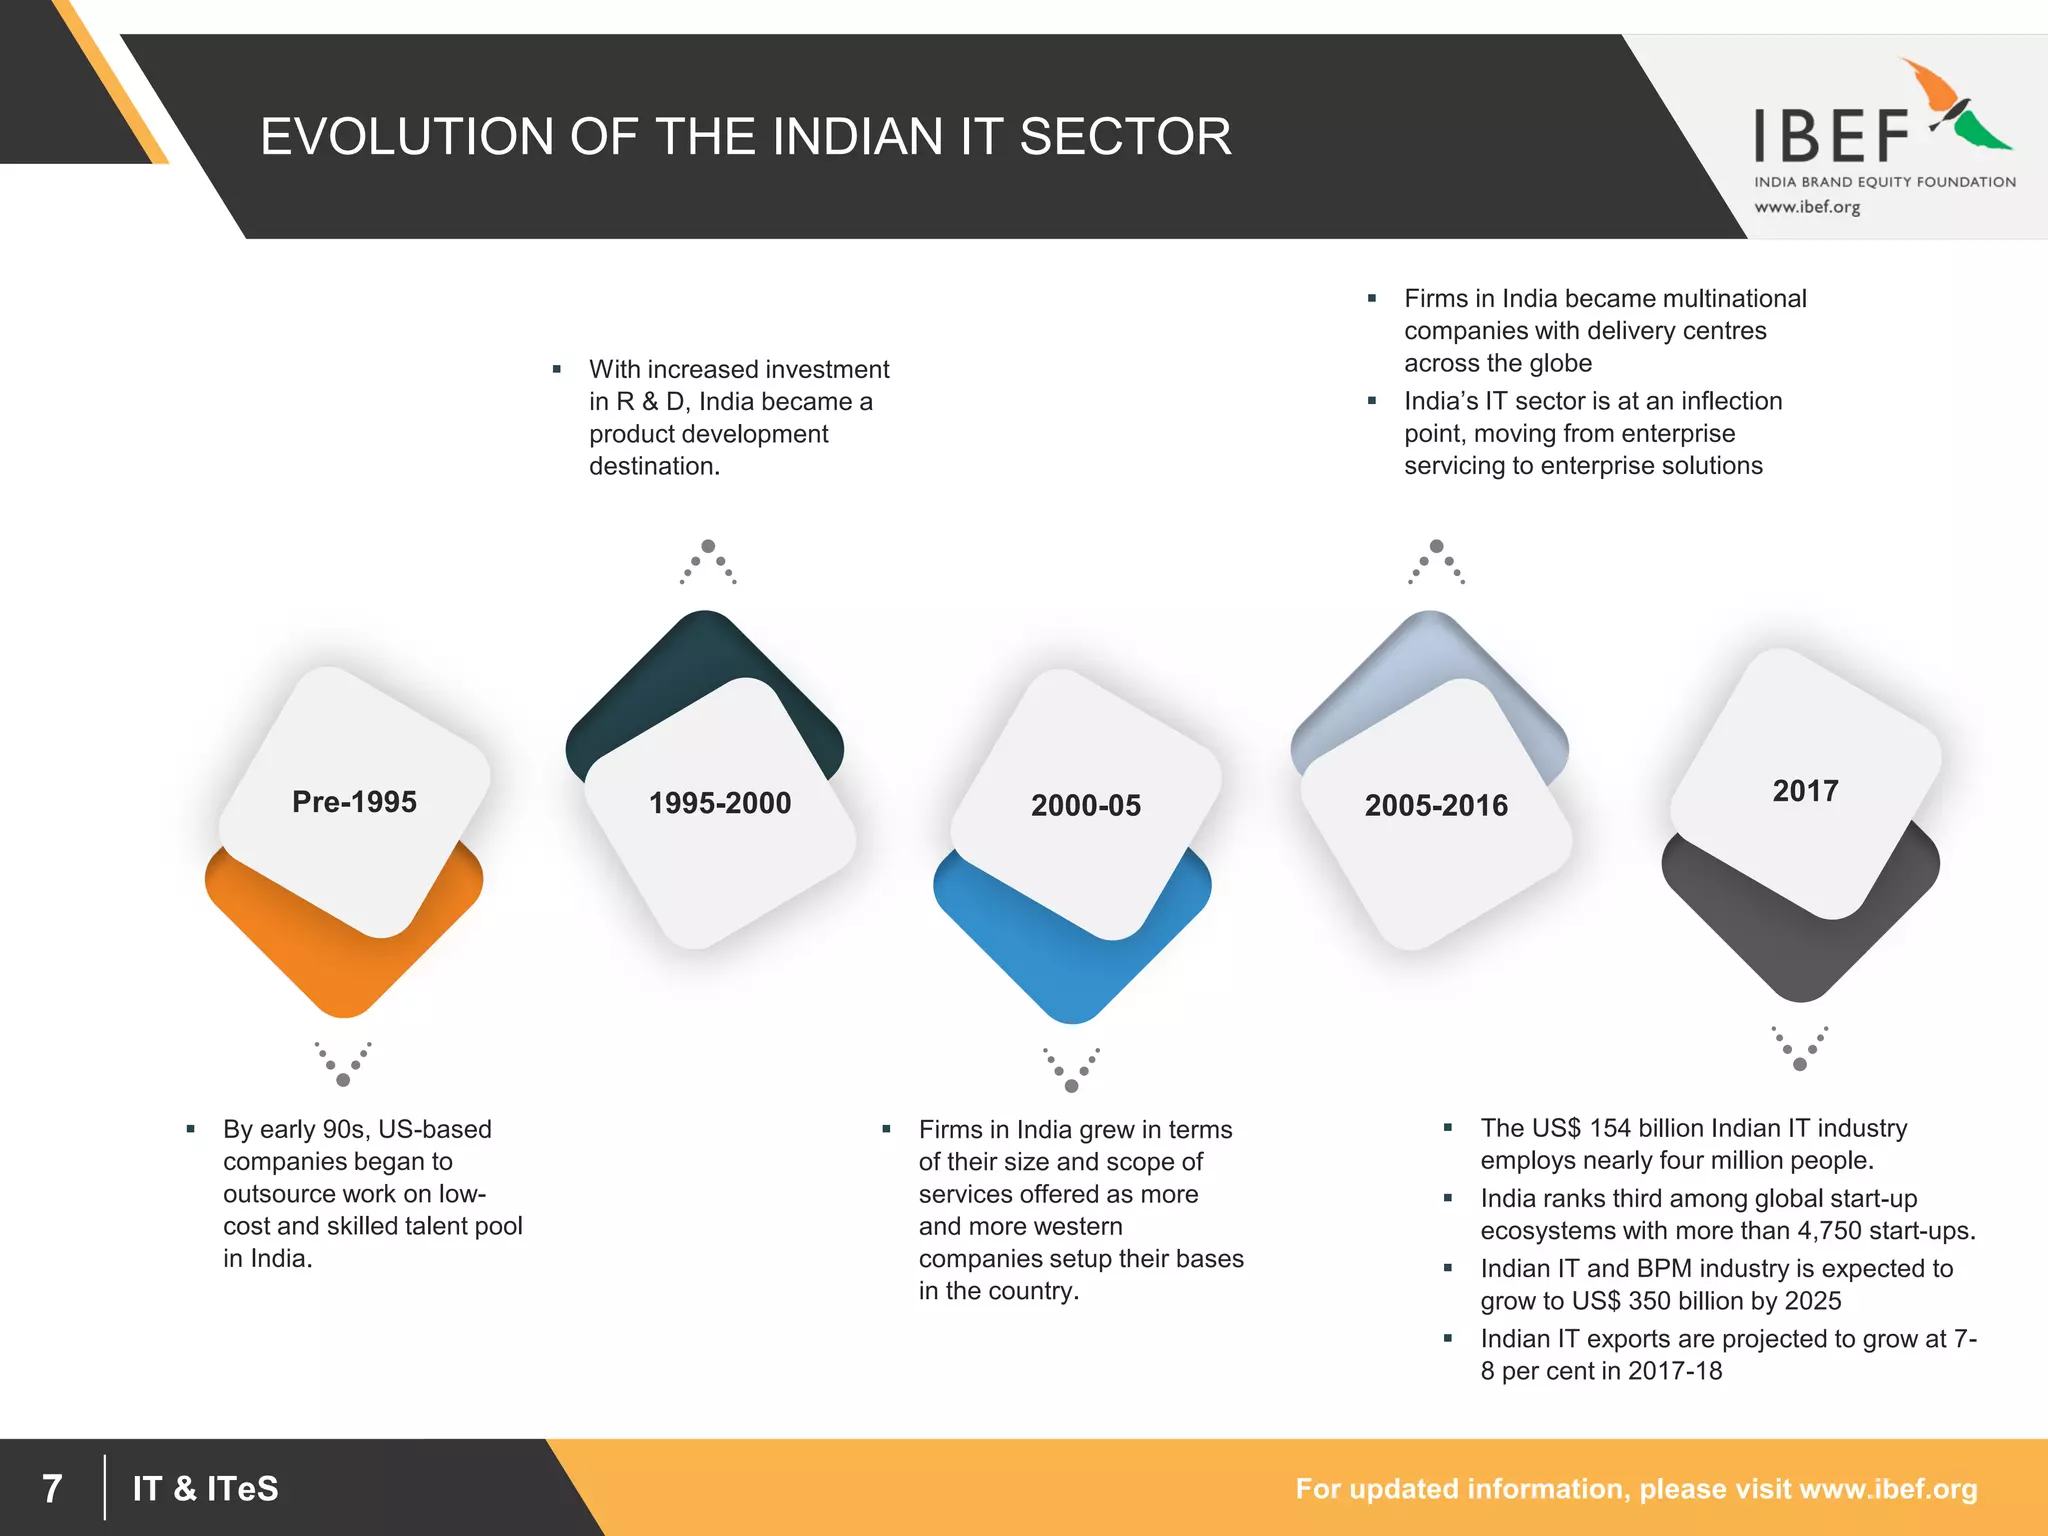
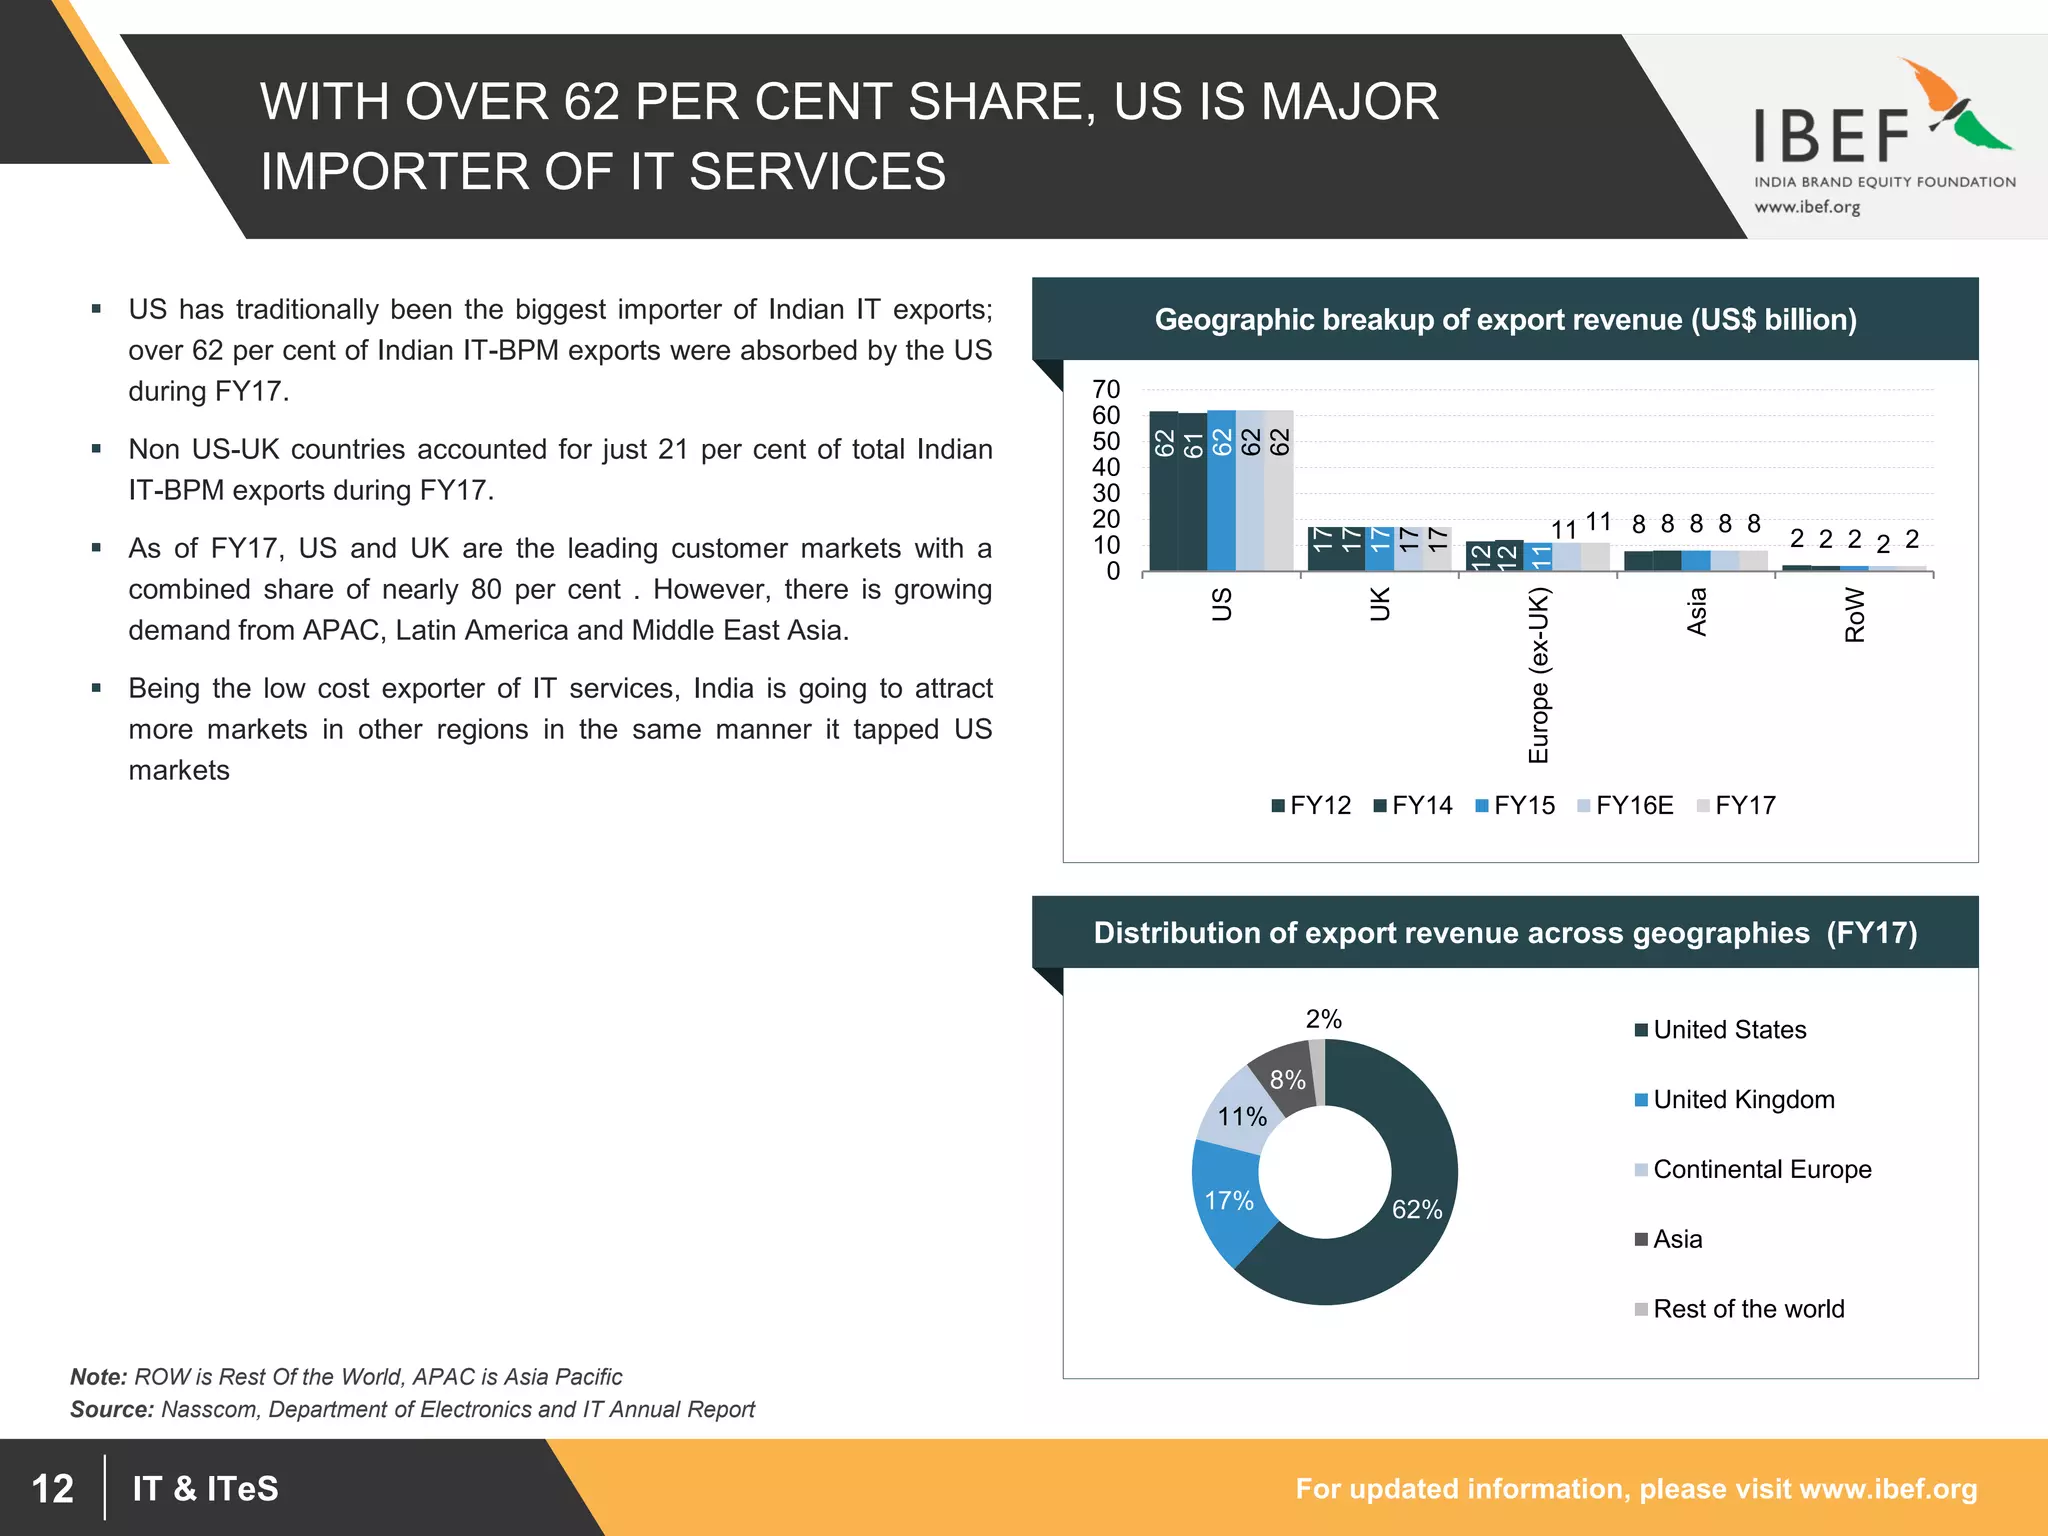
The IT & ITeS sector in India has grown significantly over the past decade. Some key points:
- The size of the Indian IT-BPM industry was estimated at US$ 154 billion in FY17 and is projected to reach US$ 350 billion by 2025.
- India has a large talent pool that allows it to be one of the leading destinations for outsourcing. The sector employs around 3.9 million people.
- Exports are a major part of the industry, estimated at US$ 117 billion in FY17. The key export segments are IT services and BPM.
India remains a preferred destination for information technology (IT) and information technology enabled services (ITeS) in the world. The Indian IT- business process management (BPM) sector is estimated to expand at a compounded annual growth rate (CAGR) of 9.5 per cent to reach US$ 300 billion by 2020. Over 2000-13, the sector has increased at a CAGR of 25 per cent.
Total exports from the IT- BPM sector (excluding hardware) are estimated at US$ 76 billion during FY13. Export of IT services has been the major contributor, accounting for 57.9 per cent of total IT exports.
Demand from emerging countries is expected to show strong growth going forward. Tax holidays are also extended to IT sector for software technology parks of India (STPI) and special economic zones (SEZs). Further, the country is providing procedural ease and single window clearance for setting up facilities. The countryâs cost competitiveness in providing IT services, which is approximately 3-4 times cheaper than the US continues to be its USP in the global sourcing market.
Disruptive technologies present an entire new gamut of opportunities for IT firms in India. Cloud represents the largest opportunity under Social, Mobility, Analytics and Cloud (SMAC), increasing at a CAGR of approximately 30 per cent to around US$ 650â700 billion by 2020. Social media is the second most lucrative segment for IT firms, offering a US$ 250 billion market opportunity by 2020.
Information Technology - Industrial AnalysisSanjay Mishra
Â
Information technology is playing an important role in India today & has transformed Indiaâs image as a land of innovative entrepreneurs. The IT sector in India is generating 2.5 million direct employment. India is now one of the biggest IT capitals of the modern world and all the major players in the world IT sector are present in the country.
Step by step â question by question â you can create your project report for bank loan, less than an hour.
A realistic project report accompanied by a detailed financial plan can make all the difference to get the funding you need. Starting a new business, planning to expand or saving your business all need a plan that works. Finline assist you in building world class project report with detailed explanations on financial ratios and projections, which are the hardest part for the entrepreneur. Similar templates for references are available in the software , so that you can rock on without any confusion.
US Economic Outlook - Being Decided - M Capital Group August 2021.pdfpchutichetpong
Â
The U.S. economy is continuing its impressive recovery from the COVID-19 pandemic and not slowing down despite re-occurring bumps. The U.S. savings rate reached its highest ever recorded level at 34% in April 2020 and Americans seem ready to spend. The sectors that had been hurt the most by the pandemic specifically reduced consumer spending, like retail, leisure, hospitality, and travel, are now experiencing massive growth in revenue and job openings.
Could this growth lead to a âRoaring Twentiesâ? As quickly as the U.S. economy contracted, experiencing a 9.1% drop in economic output relative to the business cycle in Q2 2020, the largest in recorded history, it has rebounded beyond expectations. This surprising growth seems to be fueled by the U.S. governmentâs aggressive fiscal and monetary policies, and an increase in consumer spending as mobility restrictions are lifted. Unemployment rates between June 2020 and June 2021 decreased by 5.2%, while the demand for labor is increasing, coupled with increasing wages to incentivize Americans to rejoin the labor force. Schools and businesses are expected to fully reopen soon. In parallel, vaccination rates across the country and the world continue to rise, with full vaccination rates of 50% and 14.8% respectively.
However, it is not completely smooth sailing from here. According to M Capital Group, the main risks that threaten the continued growth of the U.S. economy are inflation, unsettled trade relations, and another wave of Covid-19 mutations that could shut down the world again. Have we learned from the past year of COVID-19 and adapted our economy accordingly?
âIn order for the U.S. economy to continue growing, whether there is another wave or not, the U.S. needs to focus on diversifying supply chains, supporting business investment, and maintaining consumer spending,â says Grace Feeley, a research analyst at M Capital Group.
While the economic indicators are positive, the risks are coming closer to manifesting and threatening such growth. The new variants spreading throughout the world, Delta, Lambda, and Gamma, are vaccine-resistant and muddy the predictions made about the economy and health of the country. These variants bring back the feeling of uncertainty that has wreaked havoc not only on the stock market but the mindset of people around the world. MCG provides unique insight on how to mitigate these risks to possibly ensure a bright economic future.
where can I find a legit pi merchant onlineDOT TECH
Â
Yes. This is very easy what you need is a recommendation from someone who has successfully traded pi coins before with a merchant.
Who is a pi merchant?
A pi merchant is someone who buys pi network coins and resell them to Investors looking forward to hold thousands of pi coins before the open mainnet.
I will leave the telegram contact of my personal pi merchant to trade with
@Pi_vendor_247
If you are looking for a pi coin investor. Then look no further because I have the right one he is a pi vendor (he buy and resell to whales in China). I met him on a crypto conference and ever since I and my friends have sold more than 10k pi coins to him And he bought all and still want more. I will drop his telegram handle below just send him a message.
@Pi_vendor_247
Introduction to Indian Financial System ()Avanish Goel
Â
The financial system of a country is an important tool for economic development of the country, as it helps in creation of wealth by linking savings with investments.
It facilitates the flow of funds form the households (savers) to business firms (investors) to aid in wealth creation and development of both the parties
BYD SWOT Analysis and In-Depth Insights 2024.pptxmikemetalprod
Â
Indepth analysis of the BYD 2024
BYD (Build Your Dreams) is a Chinese automaker and battery manufacturer that has snowballed over the past two decades to become a significant player in electric vehicles and global clean energy technology.
This SWOT analysis examines BYD's strengths, weaknesses, opportunities, and threats as it competes in the fast-changing automotive and energy storage industries.
Founded in 1995 and headquartered in Shenzhen, BYD started as a battery company before expanding into automobiles in the early 2000s.
Initially manufacturing gasoline-powered vehicles, BYD focused on plug-in hybrid and fully electric vehicles, leveraging its expertise in battery technology.
Today, BYD is the worldâs largest electric vehicle manufacturer, delivering over 1.2 million electric cars globally. The company also produces electric buses, trucks, forklifts, and rail transit.
On the energy side, BYD is a major supplier of rechargeable batteries for cell phones, laptops, electric vehicles, and energy storage systems.
USDA Loans in California: A Comprehensive Overview.pptxmarketing367770
Â
USDA Loans in California: A Comprehensive Overview
If you're dreaming of owning a home in California's rural or suburban areas, a USDA loan might be the perfect solution. The U.S. Department of Agriculture (USDA) offers these loans to help low-to-moderate-income individuals and families achieve homeownership.
Key Features of USDA Loans:
Zero Down Payment: USDA loans require no down payment, making homeownership more accessible.
Competitive Interest Rates: These loans often come with lower interest rates compared to conventional loans.
Flexible Credit Requirements: USDA loans have more lenient credit score requirements, helping those with less-than-perfect credit.
Guaranteed Loan Program: The USDA guarantees a portion of the loan, reducing risk for lenders and expanding borrowing options.
Eligibility Criteria:
Location: The property must be located in a USDA-designated rural or suburban area. Many areas in California qualify.
Income Limits: Applicants must meet income guidelines, which vary by region and household size.
Primary Residence: The home must be used as the borrower's primary residence.
Application Process:
Find a USDA-Approved Lender: Not all lenders offer USDA loans, so it's essential to choose one approved by the USDA.
Pre-Qualification: Determine your eligibility and the amount you can borrow.
Property Search: Look for properties in eligible rural or suburban areas.
Loan Application: Submit your application, including financial and personal information.
Processing and Approval: The lender and USDA will review your application. If approved, you can proceed to closing.
USDA loans are an excellent option for those looking to buy a home in California's rural and suburban areas. With no down payment and flexible requirements, these loans make homeownership more attainable for many families. Explore your eligibility today and take the first step toward owning your dream home.
Even tho Pi network is not listed on any exchange yet.
Buying/Selling or investing in pi network coins is highly possible through the help of vendors. You can buy from vendors[ buy directly from the pi network miners and resell it]. I will leave the telegram contact of my personal vendor.
@Pi_vendor_247
The secret way to sell pi coins effortlessly.DOT TECH
Â
Well as we all know pi isn't launched yet. But you can still sell your pi coins effortlessly because some whales in China are interested in holding massive pi coins. And they are willing to pay good money for it. If you are interested in selling I will leave a contact for you. Just telegram this number below. I sold about 3000 pi coins to him and he paid me immediately.
Telegram: @Pi_vendor_247
how can i use my minded pi coins I need some funds.DOT TECH
Â
If you are interested in selling your pi coins, i have a verified pi merchant, who buys pi coins and resell them to exchanges looking forward to hold till mainnet launch.
Because the core team has announced that pi network will not be doing any pre-sale. The only way exchanges like huobi, bitmart and hotbit can get pi is by buying from miners.
Now a merchant stands in between these exchanges and the miners. As a link to make transactions smooth. Because right now in the enclosed mainnet you can't sell pi coins your self. You need the help of a merchant,
i will leave the telegram contact of my personal pi merchant below. đ I and my friends has traded more than 3000pi coins with him successfully.
@Pi_vendor_247
how to sell pi coins at high rate quickly.DOT TECH
Â
Where can I sell my pi coins at a high rate.
Pi is not launched yet on any exchange. But one can easily sell his or her pi coins to investors who want to hold pi till mainnet launch.
This means crypto whales want to hold pi. And you can get a good rate for selling pi to them. I will leave the telegram contact of my personal pi vendor below.
A vendor is someone who buys from a miner and resell it to a holder or crypto whale.
Here is the telegram contact of my vendor:
@Pi_vendor_247
what is the best method to sell pi coins in 2024DOT TECH
Â
The best way to sell your pi coins safely is trading with an exchange..but since pi is not launched in any exchange, and second option is through a VERIFIED pi merchant.
Who is a pi merchant?
A pi merchant is someone who buys pi coins from miners and pioneers and resell them to Investors looking forward to hold massive amounts before mainnet launch in 2026.
I will leave the telegram contact of my personal pi merchant to trade pi coins with.
@Pi_vendor_247
how can I sell pi coins after successfully completing KYCDOT TECH
Â
Pi coins is not launched yet in any exchange đą this means it's not swappable, the current pi displaying on coin market cap is the iou version of pi. And you can learn all about that on my previous post.
RIGHT NOW THE ONLY WAYÂ you can sell pi coins is through verified pi merchants. A pi merchant is someone who buys pi coins and resell them to exchanges and crypto whales. Looking forward to hold massive quantities of pi coins before the mainnet launch.
This is because pi network is not doing any pre-sale or ico offerings, the only way to get my coins is from buying from miners. So a merchant facilitates the transactions between the miners and these exchanges holding pi.
I and my friends has sold more than 6000 pi coins successfully with this method. I will be happy to share the contact of my personal pi merchant. The one i trade with, if you have your own merchant you can trade with them. For those who are new.
Message: @Pi_vendor_247 on telegram.
I wouldn't advise you selling all percentage of the pi coins. Leave at least a before so its a win win during open mainnet. Have a nice day pioneers âĨī¸
#kyc #mainnet #picoins #pi #sellpi #piwallet
#pinetwork
How to get verified on Coinbase Account?_.docxBuy bitget
Â
t's important to note that buying verified Coinbase accounts is not recommended and may violate Coinbase's terms of service. Instead of searching to "buy verified Coinbase accounts," follow the proper steps to verify your own account to ensure compliance and security.
1. For updated information, please visit www.ibef.orgIT & ITeS1
For updated information, please visit www.ibef.org March 2018
IT & ITeS
2. For updated information, please visit www.ibef.orgIT & ITeS2
Table of Content
Advantage IndiaâĻâĻâĻâĻâĻ..âĻ.âĻâĻâĻ 4
Market Overview âĻâĻâĻ..âĻâĻâĻâĻ..âĻ. 6
Recent Trends and Strategies............15
Growth Drivers and Opportunities...âĻ.19
Case StudiesâĻâĻâĻ.âĻâĻâĻ............âĻ 29
Key Industry OrganisationsâĻâĻâĻâĻ.. 34
Useful InformationâĻâĻâĻ.âĻâĻ......âĻ.. 36
Porters Five Forces FrameworkâĻ..âĻ14
Executive SummaryâĻâĻâĻâĻ.âĻ.âĻ..âĻ 3
3. For updated information, please visit www.ibef.orgIT & ITeS3
EXECUTIVE SUMMARY
ī§ The IT-BPM sector in India expanded at a CAGR of 11.14 per cent to US$ 154 billion in FY17 from US$ 74
billion in FY10, which is 3â4 times higher than the global IT-BPM growth. It is estimated that the size of the
industry will grow to US$ 350 billion by 2025.
Strong growth
opportunities
ī§ India is a prominent sourcing destination across the world, accounting for approximately 55 per cent market
share of the US$ 173-178 billion global services sourcing business in 2016-17.
ī§ India acquired a share of around 38 per cent in the overall Business Process Management (BPM) sourcing
market.
Leading sourcing
destination
ī§ Indiaâs highly qualified talent pool of technical graduates is one of the largest in the world, facilitating its
emergence as a preferred destination for outsourcing, computer science/information technology accounts for
the biggest chunk of India' fresh engineering talent pool, with more than 98 per cent of the colleges offering
this stream.
Largest pool of ready to
hire talent
ī§ The sector ranks 3rd in Indiaâs total FDI share and accounts for approximately 37 per cent of total Private
Equity and Venture investments in the country. The computer software and hardware sector in India attracted
cumulative Foreign Direct Investment (FDI) inflows worth US$ 29.825 billion between April 2000 and
September 2017, according to data released by the Department of Industrial Policy and Promotion (DIPP).
Most lucrative sector for
investments
ī§ Indian IT exports are projected to grow at 7-8 per cent in 2017-18. IT-BPM sector accounts for largest share
in total Indian services export, which is 45 per cent.
Export and employment
growth
ī§ Indiaâs IT industry contributed around 7.7 per cent to the countryâs GDP. IT industry employs nearly 3.9 million
people in India of which more than 170,000 were added in FY17. The industry is expected to add 130,000 to
150,000 jobs in FY18 and over 100,000 jobs in FY19.
ī§ IT industry is fueling the growth of startups in India, with the presence of more than 4,750 startups in India.
Large contribution to the
Indian economy
Source: NASSCOM, DIPP, Aranca Research
Note: BPM â Business Process Management, USP â Unique Selling Proposition
5. For updated information, please visit www.ibef.orgIT & ITeS5
ADVANTAGE INDIA
ī§ Strong growth in demand for exports from new
verticals.
ī§ Rapidly growing urban infrastructure has
fostered several IT centres in the country.
ī§ Expanding economy to propel growth in local
demand.
ī§ Indian IT firms have delivery centres across
the world.
ī§ IT & ITeS industry is well diversified across
verticals such as BFSI, telecom and retail.
ī§ Increasing strategic alliance between domestic
and international players to deliver solutions
across the globe.
ī§ Cost savings of 60â70 per cent over source
countries.
ī§ A preferred destination for IT & ITeS in the
world; continues to be a leader in the global
sourcing industry with 55 per cent market
share.
ī§ The Indian IT industry has saved clients US$
200 billion in the past 5 years.
ī§ Tax exemption of three years in a block of
seven years to start-ups under âStartup Indiaâ.
ī§ More liberal system for raising global capital,
funding for seed capital and growth and ease
of doing business, etc. have been addressed.
ī§ Cumulative FDI inflow in computer software
and hardware is US$ 29.825 billion from April
2000 to December 2017.
ADVANTAGE
INDIA
Source: SEZ stands for Special Economic Zone, BFSI stands for Banking, Financial Services and Insurance, E stands for Estimate, F stands for Forecast
Note: Nasscom
7. For updated information, please visit www.ibef.orgIT & ITeS7
EVOLUTION OF THE INDIAN IT SECTOR
ī§ By early 90s, US-based
companies began to
outsource work on low-
cost and skilled talent pool
in India.
ī§ Firms in India grew in terms
of their size and scope of
services offered as more
and more western
companies setup their bases
in the country.
ī§ The US$ 154 billion Indian IT industry
employs nearly four million people.
ī§ India ranks third among global start-up
ecosystems with more than 4,750 start-ups.
ī§ Indian IT and BPM industry is expected to
grow to US$ 350 billion by 2025
ī§ Indian IT exports are projected to grow at 7-
8 per cent in 2017-18
ī§ With increased investment
in R & D, India became a
product development
destination.
ī§ Firms in India became multinational
companies with delivery centres
across the globe
ī§ Indiaâs IT sector is at an inflection
point, moving from enterprise
servicing to enterprise solutions
Pre-1995 2005-20162000-05 20171995-2000
8. For updated information, please visit www.ibef.orgIT & ITeS8
SEGMENTS OF INDIAâS IT SECTOR
ī§ Market Size: US$ 80.08
billion during FY17E.
ī§ Over 81 per cent of revenue
comes from the export
market.
ī§ BFSI continues to be the
major vertical of the IT
sector.
ī§ IT services had 52 per cent
share in total Indian IT sector
revenues in 2017.
ī§ Market size: US$ 29.26
billion during FY17E.
ī§ Around 87 per cent of
revenue comes from the
export market.
ī§ Market size of BPM industry
to reach US$ 54 billion by
FY25.
ī§ BPM segment had 19 per
cent share in Indian IT sector
revenues in 2017.
ī§ Market size: US$ 29.26
billion during FY17E.
ī§ Over 83.9 per cent of
revenue comes from exports.
ī§ The software products and
engineering services
segment grew 10.5 per cent
in FY17.
ī§ It had 19 per cent share in
Indian IT sector revenues in
2017.
ī§ Market size: US$ 14 billion in
FY17E.
ī§ The domestic market
accounts for a significant
share.
ī§ The segment had 9 per cent
share in Indian IT sector
revenues in 2017.
Source: NASSCOM, Aranca Research
Notes: E - estimated
IT & ITeS sector
IT services
Business Process
Management
Software products and
engineering services
Hardware
9. For updated information, please visit www.ibef.orgIT & ITeS9
INDIAâS IT MARKET SIZE GROWING
Source: NASSCOM, Gartner, Aranca Research
24
29 32 32 32 34 35 37
41
50
59
69
76
87
98.5
108
117
126
0
20
40
60
80
100
120
140
160
180
FY10 FY11 FY12 FY13 FY14 FY15 FY16 FY17 FY18
Domestic Export
ī§ IT BPM industry revenues (excluding hardware) was estimated at
around US$ 143 billion in FY 2015-16 and is estimated to be at US$
154 billion in FY 2016-17. It is further expected to grow to US$ 167
billion in FY2017-18.
ī§ The contribution of the IT sector to Indiaâs GDP stood at 7.7 per cent
in 2016.
ī§ The top 5 IT firms contribute over 25 per cent to the total industry
revenue Rs 8.4 lakh crore (US$ 131.11 billion) as of 2017, indicating
the market is fairly competitive.
ī§ The domestic revenue of the IT industry is estimated at US$ 38
billion and export revenue is estimated at US$ 117 billion in FY 17.
ī§ The market size of Indiaâs IT-BPM sector is expected to grow to US$
350 billion by 2025 and BPM is expected to account for US$ 50-55
billion out of the total revenue.
ī§ Spending on Information Technology in India is expected to grow
over 9 per cent to reach US$ 87.1 billion in 2018.*
Visakhapatnam port traffic (million tonnes)Market size of IT industry in India (US$ billion)
Note: E â estimate, *As per Gartner
CAGR 11.04 %
10. For updated information, please visit www.ibef.orgIT & ITeS10
IT AND BPM ACCOUNT FOR 79.7 PER CENT OF
INDIAâS IT & ITeS EXPORTS
ī§ Total exports from the IT-BPM sector (including hardware) were
estimated to have been US$ 117 billion during FY17; exports rose at
a CAGR of 12.84 per cent during FY09â17.
ī§ Export of IT services has been the major contributor, accounting for
56.41 per cent of total IT exports (including hardware) during FY17
ī§ BPM accounted for 22.22 per cent of total IT exports during FY17.
ī§ Exports from the sector are expected to reach US$ 126 billion in
FY18 and US$ 135-137 billion in FY19.
ī§ Indiaâs Personal Computer (PC) shipment advanced 11.4 per cent
year-on-year to 9.56 million units in 2017 on the back of rise in the
quantum of large projects.
Source: Nasscom, Make in India, IDC
Note: E - estimated
25.8 25.8
33.5 39.9 43.9 52.0
55.5 61.0 66.0
9.9 11.7
14.1
15.9 17.8
20.0 23.0 24.4 26
8.8 10.0 11.4
13.0
14.1
14.0 20.0
22.4
25.0
0.0
20.0
40.0
60.0
80.0
100.0
120.0
140.0
FY09
FY10
FY11
FY12
FY13
FY14
FY15
FY16
FY17
IT services BPM Software Products and Engg. Services
CAGR 12.84 %
Growth in export revenue (US$ billion)
Sector-wise breakup of export revenue FY17
56.41%
22.22%
21.37%
IT Services
BPM
Software Products and
Engg. Services
11. For updated information, please visit www.ibef.orgIT & ITeS11
BFSI - A KEY BUSINESS VERTICAL FOR IT-BPM
INDUSTRY
ī§ BFSI is a key business vertical for the IT-BPM industry. Export
revenue from the vertical stood at around US$ 62.40 billion in FY
2017, accounting for 53 per cent of total IT-BPM exports from India
ī§ Approximately 80 per cent of total IT-BPM exports from India is
across four sectors: BFSI, telecom, manufacturing and retail. The
hitherto smaller sectors are expected to grow
ī§ With introduction of new policies for healthcare and retail, these
sectors are expected to grow at a faster pace in coming years, thus
accelerating revenue of IT enabled services for the sectors.
53%
18%
6%
4%
3%
2%
4%
10%
BFSI Hi-Tech/Telecom
Manufacturing Healthcare
Retail Construction and utilities
Travel and transportation Others
Distribution of export revenue across verticals (FY16)
Source: MoRTH, Department of Electronics and IT Annual Report
Note: BFSI - Banking, Financial Services and Insurance, *Emerging- Retail, Utilities andand Construction, Retail, Healthcare, Services, Transportation. The figures mentioned are for IT
and BPM only and do not include engineering services and hardware exports
Distribution of export revenue across verticals (FY17)
12. For updated information, please visit www.ibef.orgIT & ITeS12
WITH OVER 62 PER CENT SHARE, US IS MAJOR
IMPORTER OF IT SERVICES
ī§ US has traditionally been the biggest importer of Indian IT exports;
over 62 per cent of Indian IT-BPM exports were absorbed by the US
during FY17.
ī§ Non US-UK countries accounted for just 21 per cent of total Indian
IT-BPM exports during FY17.
ī§ As of FY17, US and UK are the leading customer markets with a
combined share of nearly 80 per cent . However, there is growing
demand from APAC, Latin America and Middle East Asia.
ī§ Being the low cost exporter of IT services, India is going to attract
more markets in other regions in the same manner it tapped US
markets
62
17
12
8
2
61
17
12
8
2
62
17
11
8
2
62
17
11 8
2
62
17
11 8
2
0
10
20
30
40
50
60
70
US
UK
Europe(ex-UK)
Asia
RoW
FY12 FY14 FY15 FY16E FY17
Geographic breakup of export revenue (US$ billion)
Source: Nasscom, Department of Electronics and IT Annual Report
Note: ROW is Rest Of the World, APAC is Asia Pacific
62%17%
11%
8%
2% United States
United Kingdom
Continental Europe
Asia
Rest of the world
Distribution of export revenue across geographies (FY17)
13. For updated information, please visit www.ibef.orgIT & ITeS13
IT-BPM SECTOR DOMINATED BY LARGE PLAYERS
Category
Number of
players
Percentage of total
export revenue
Percentage of total
employees
Work focus
Large 11 47-50% ~35-38%
ī§ Fully integrated players offering complete range of services
ī§ Large scale operations and infrastructure
ī§ Presence in over 60 countries
Medium 120-150 32-35% ~28-30%
ī§ Mid tier Indian and MNC firms offering services in multiple
verticals
ī§ Dedicated captive centres
ī§ Near shore and offshore presence in more than 30-35 countries
Emerging
~1,000-
1,200
9-10% ~15-20%
ī§ Players offering niche IT-BPM services
ī§ Dedicated captives offering niche services
ī§ Expanding focus towards sub Fortune 500/1,000 firms
Small ~15,000 9-10% ~15-18%
ī§ Small players focussing on specific niches in either services or
verticals
ī§ Includes Indian providers and small niche captives
Source: Nasscom
14. For updated information, please visit www.ibef.orgIT & ITeS14
Porterâs Five Force Framework Analysis
ī§ Lowâ Bargaining power of suppliers
is less as most of their businesses
come from the same geographies
ī§ Price taker rather than price maker
Bargaining Power of Suppliers
ī§ Medium â Threat is medium as new
centres, such as Philippines and
China, are fast gaining ground among
investors due to their low cost
advantages
Threat of Substitutes
ī§ High â Intense competitive rivalry
exists due to low switching costs
ī§ Most of the bigger Indian firms offer
same services and there is little
product differentiation
Competitive Rivalry
ī§ High â Easy entry as the capital
required is low
ī§ Large players, however, tougher
prospects of small and medium
players to win large deals
Threat of New Entrants
ī§ High â Bargaining power is high as
many IT firms fight for a similar
project
ī§ Firms are mostly dependent on same
geography, which increases customer
power
Bargaining Power of Buyers
Positive Impact
Neutral Impact
Negative Impact
15. For updated information, please visit www.ibef.orgIT & ITeS15
IT & ITeS
RECENT TRENDS
AND STRATEGIES
16. For updated information, please visit www.ibef.orgIT & ITeS16
NOTABLE TRENDS
ī§ Indian software product industry is expected to reach the mark of US$ 100 billion by 2025. Indiaâs number of
global delivery centres in the IT-BPM sector reached 670, spreading out across 78 countries, as of 2017.
Global delivery
model
ī§ India is a prominent sourcing destination across the world, accounting for approximately 56 per cent market
share in the global services sourcing business.
ī§ India acquired a share of around 38 per cent in the overall Business Process Management (BPM) sourcing
market.
Leading sourcing
destination
ī§ The sector ranks 3rd in Indiaâs total FDI share and accounts for approximately 37 per cent of total Private
Equity and Venture investments in the country. The computer software and hardware sector in India attracted
cumulative Foreign Direct Investment (FDI) inflows worth US$ 29.825 billion between April 2000 and
December 2017, according to data released by the Department of Industrial Policy and Promotion (DIPP).
Most lucrative sector for
investments
ī§ Disruptive technologies, such as cloud computing, social media and data analytics, are offering new avenues
of growth across verticals for IT companies
ī§ The SMAC (social, mobility, analytics, cloud) market is expected to grow to US$ 225 billion by 2020
New technologies
ī§ Indiaâs IT sector is gradually moving from linear models (rising headcount to increase revenue) to non-linear
ones
ī§ In line with this, IT companies in India are focusing on new models such as platform-based BPM services and
creation of intellectual property
Growth in non-linear
models
ī§ Large players with a wide range of capabilities are gaining ground as they move from being simple
maintenance providers to full service players, offering infrastructure, system integration and consulting
services
ī§ Of the total revenue, about 80 per cent is contributed by 200 large and medium players
Large players gaining
advantage
17. For updated information, please visit www.ibef.orgIT & ITeS17
NOTABLE TRENDS
ī§ Social, Mobility, Analytics and Cloud (SMAC), a paradigm shift in IT-BPM approaches experienced until now,
is leading to digitisation of the entire business model
SMAC technologies, an
inflection point for Indian
IT
ī§ The National Optical Fibre Network (NOFN) is being laid down in phases to connect all the 250,000 gram
panchayats in the country.
Rural Development
ī§ In May 2017, the central government announced to launch a policy named as Phased Manufacturing
Programme (PMP), which was developed by the Ministry of Electronics and Information Technology (MeitY)
with an aim to boost the manufacturing of cell phones in the country.
Make in India
ī§ Tier II and III cities are increasingly gaining traction among IT companies, aiming to establish business in
India.
ī§ Cheap labour, affordable real estate, favourable government regulations, tax breaks and SEZ schemes
facilitating their emergence as a new IT destination
ī§ Giving rise to the domestic hub and spoke model, with Tier I cities acting as hubs and Tier II, III and IV as
network of spokes
Emergence of Tier II
cities
ī§ Indiaâs IT market is experiencing a significant shift from a few large-size deals to multiple small-size ones
ī§ The number of start-ups in technology is expected to reach 50000, adding to around 2 per cent of GDP
ī§ Delivery models are being altered, as the business is moving to capital expenditure (capex) based models
from operational expenditure (opex), from a vendorâs frame of reference
Changing business
dynamics
18. For updated information, please visit www.ibef.orgIT & ITeS18
STRATEGIES ADOPTED
ī§ Social Computing, Mobility, Analytics and Cloud (SMAC) is taking significant leaps
ī§ Companies are getting into this field by offering big data services, which provides clients better insights for
future cases
Movement to SMAC and
digital space
ī§ Knowledge services, data analytics, legal services, Business Process as a Service (BPaaS), cloud-based
services
Fast-growing sectors
within the BPM domain
ī§ Companies are now investing a lot in R&D and training employees to create an efficient workforce, enhancing
productivity and quality
ī§ R & D forms a significant portion of companiesâ expenses, which is critical when margins are in pressure, to
promote innovations in the changing landscape
Promotion of R&D
ī§ Companies are expanding their business to Tier II and III cities to have low cost advantage
ī§ In 2016, Infosys bought two office space in Pune and Bengaluru India. TCS is planning to expand in Mumbai
ī§ Companies are expanding their business towards emerging economies of East Europe and Latin American
countries
Expanding in Tier II and
III cities and externally
ī§ Most of the IT companies have been offering similar products and services to their clients
ī§ The companies are working towards product differentiation through various other services by branding
themselves, e.g. Building Tomorrow's Enterprise by Infosys
ī§ Indian IT firms have started to adopt pricing strategies to compete with Global firms like IBM and Accenture
Product and Pricing
differentiation
19. For updated information, please visit www.ibef.orgIT & ITeS19
IT & ITeS
GROWTH DRIVERS
AND OPPORTUNITIES
20. For updated information, please visit www.ibef.orgIT & ITeS20
IT SECTOR TO BE DRIVEN BY STRONG DEMAND AND
INDIAN EXPERTISE
Note: STPI stands for Software Technology Park of India, SEZ stands for Special Economic Zone, ICT - Information and communications technology, IT-BPM â Information Technology
Business Process Management, AI* - Artificial Intelligence
Source: Nasscom
ī§ Over 6 million graduates are estimated to
have been added to Indiaâs talent pool in
FY17.
ī§ Strong mix of young and experienced
professionals
ī§ Computer penetration expected to increase
ī§ Increasing adoption of technology and
telecom by consumers and focused
government initiatives leading to increased
ICT adoption
ī§ Robust IT infrastructure across various cities in India such
as Bengaluru
ī§ Technology mission for services in villages and schools,
training in IT skills and E-Kranti for government service
delivery and governance scheme
ī§ Global BPM spending estimated to rise and
reach to US$ 233 billion by 2020
ī§ Tax holidays for STPI and SEZs
ī§ More liberal system for raising capital, seed
money and ease of doing business.
ī§ As a part of Union Budget 2018-19, NITI
Aayog is going to set up a national level
programme that will enable efforts in AI* and
will help in leveraging AI* technology for
development works in the country.
Growth
Drivers
Global
Demand
Talent
Pool
Policy
Support
Domestic
Growth
Infrastructure
21. For updated information, please visit www.ibef.orgIT & ITeS21
EXPORTS TO REMAIN ROBUST AS GLOBAL IT
INDUSTRY MAINTAINS GROWTH
ī§ Export revenue from the industry has grown at a CAGR of 12.91%
to US$ 117 billion in FY17 from US$ 50 billion in FY10. The export
revenue forecast for FY18 is US$126 billion.
ī§ Indiaâs IT industry amounts to 7 per cent of the global market,
largely due to exports. India comprises of more than 15,000 firms, of
which 1000+ are large firms.
ī§ Emergence of SMAC would provide US$ 1 trillion market by 2020
ī§ Emerging economies are likely to be a major contributor to IT spend
growth
ī§ IT spend in emerging economies to grow 3-4 times faster than
advanced economies
ī§ The BRIC IT market is estimated at US$ 380â420 billion by 2020
ī§ Stable tax regime, reducing litigation related to tax and providing
conducive environment for start-ups will improve the business
environment
ī§ Indiaâs software service exports increased 10.3 per cent in FY17 to
US$ 97.1 billion from US$ 88 billion in FY16.
Export revenue from IT industry (US$ billion)
50
59
69
76
86
98.5
108
117
126
0
20
40
60
80
100
120
140
FY10 FY11 FY12 FY13 FY14 FY15 FY16 FY17 FY18F
Source: Nasscom, Media Sources
Note: F - Forecast
CAGR 12.91%
22. For updated information, please visit www.ibef.orgIT & ITeS22
INDIAN TALENT POOL READY TO TAKE IT SECTOR TO
THE NEXT LEVEL
Graduates addition to talent pool in India (in millions)
3.7
4
4.4
4.7
5.3
5.8
6 6
0
1
2
3
4
5
6
7
FY10 FY11 FY12 FY13 FY14 FY15 FY16 FY17
Source: Nasscom, India Hiring Intent Survey 2017
Note: Graduates includes both graduates and post graduates
ī§ Availability of skilled English speaking workforce has been a major
reason behind Indiaâs emergence as a global outsourcing hub.
ī§ During FY10-17, number of graduates addition to talent pool in India
grew at a CAGR of 7.15 per cent. India added more than 6 million
graduates to the talent pool during FY17.
ī§ The office space absorption by the information technology (IT) and
IT-enabled services (ITeS) companies increased by 10% to 16.81
million square feet (sq. ft.) in 2016 over the previous year,
ī§ About 2 per cent of the industry revenue is spent on training
employees in the IT-BPM sector
ī§ US$ 1.6 billion is spent annually on training workforce and growing
R&D spend
ī§ Forty per cent of total spend on training is spent on training new
employees
ī§ Numerous firms have forged alliances with leading education
institutions to train employees
ī§ Employment from BPO/ITeS sector reached 3.86 million in 2016-17.
An addition of around 130,000 â 150,000 new jobs is expected in
FY18.
ī§ India BPO promotion scheme was approved under Digital India
programme. It aims to create employment opportunities for the
youth and promote investments in the IT&ITeS industry. Under the
scheme employment has already been created for more than 10,000
individuals.
23. For updated information, please visit www.ibef.orgIT & ITeS23
SEZâS TO DRIVE IT SECTOR; TIER II CITIES EMERGE
AS NEW CENTERS
Source: EY, Nasscom
Note: SEZ â Special Economic Zone, STPI (Software Technology Parks of India)
Parameters STPI SEZ
Term ī§ 10 years ī§ 15 years
Fiscal benefits
ī§ 100 per cent tax
holiday on export
profits
ī§ Exemption from
excise duties and
customs
ī§ 100 per cent tax
holiday on exports
for 1st 5 years
ī§ Exemption from
excise duties and
customs
Location and
size restrictions
ī§ No location
constraints
ī§ 23 per cent STPI
units in tier II and III
cities
ī§ Restricted to
prescribed zones
with a minimum area
of 25 acres
ī§ IT-SEZs have been initiated with an aim to create zones that lead to
infrastructural development, exports and employment
ī§ As on 1st December 2017, there were 222 exporting SEZs across the
country
ī§ Over 50 cities already have basic infrastructure and human resource
to support the global sourcing and business services industry. Some
cities are expected to emerge as regional hubs supporting domestic
companies
ī§ Odisha Government signed a MoU with Software Technology Parks
of India (STPI) for setting up 4 software technology centres
ī§ In February 2017, Persistent Systems, a Pune-based company,
secured development rights to a number of patented innovations for
enhancing security of financial services from The United Services
Automobile Association (USAA)
ī§ Software Technology Parks of India (STPI) has set up 56 centres
across the country which provide single window clearance and
infrastructure facilities. Under STP scheme, STP units can avail
Excise Duty exemptions on procurement of indigenously
manufactured goods.
1,821 1,615
175
3,230
-
1,000
2,000
3,000
4,000
5,000
6,000
2008 2018
Tier I locations Tier II locations
IT sector employment distribution
in Tier I and Tier II/III cities
24. For updated information, please visit www.ibef.orgIT & ITeS24
TREMENDOUS GROWTH OF GLOBAL INâHOUSE
CENTRES
Number of GICâs in India
180
460
710
760
790
825
1,025
1,050
1,100
0
200
400
600
800
1000
1200
2000 2005 2010 2012 2013 2014 2015 2016 2017
Source: Zinnov, Nasscom
ī§ Global In-House Centres (GIC), also known as captive centres, are
one of the major growth drivers of the IT-BPM sector in India. They
also operate in engineering services and software product
development.
ī§ As of January 2018, there were over 1100 GICs operating out of
India. GICs in India today represent a US$ 23.1 billion industry. The
impact of the segment goes beyond revenue and employment, as it
helps in developing India as a R&D hub and create an innovation
ecosystem in the country
ī§ Within the captive landscape, Engineering Research and
Development/Software Product Development (ER D/SPD) is the
largest sub-segment
ī§ Companies from North America and Europe are major investors in
the captive segment in India, accounting for over 90 per cent of
captives in the country
25. For updated information, please visit www.ibef.orgIT & ITeS25
IMPRESSIVE GROWTH PROSPECTS SUSTAIN PE AND
VC INTEREST
PE-VC investments in IT and BPM (US$ billion)
0.8
1.9
3.2
2.2
5.0
9.0
5.0
7.0
7.6
0
1
2
3
4
5
6
7
8
9
10
FY08
FY11
FY12
FY13
FY14
FY15
FY16
FY17
FY18*
Share of IT-BPM in PE/VC investments
116
180
193
209
332
437
322
245
25.1%
31.5%
37.3%
40.3%
52.9% 55.5%
48.6%
56.3%
0.0%
10.0%
20.0%
30.0%
40.0%
50.0%
60.0%
0
50
100
150
200
250
300
350
400
450
500
FY11
FY12
FY13
FY14
FY15
FY16
FY17
FY18*
Number of Deals Percentage
Source: Venture Intelligence, Nasscom
Note: CAGR â Compound Annual Growth Rate, FY18* - Up to December 2017
ī§ Total PE/VC investments in FY17 were observed to be US$ 7 billion, which increased at a CAGR of 27.25 per cent from US$ 0.8 billion in FY08
ī§ Total number of PE/VC investment deals reached 322 in FY17. During April-December 2017, 245 PE/VC deals were undertaken in the IT-BPM
sector.
26. For updated information, please visit www.ibef.orgIT & ITeS26
ī§ Government, healthcare, media and
utilities together have IT spend of
approximately US$ 190 billion, but account
just 8 per cent of Indiaâs IT revenue
ī§ Non-linear growth due to platforms,
products and automation
ī§ Emerging verticals (retail, healthcare,
utilities) are driving growth
ī§ BRIC nations, continental Europe, Canada
and Japan have IT spending of
approximately US$ 380â420 billion
ī§ Adoption of technology and outsourcing is
expected to make Asia the 2nd largest IT
market
ī§ SMBs have IT spend of approximately US$
230â250 billion, but contribute just 25 per
cent to Indiaâs IT revenue
ī§ The emergence of new service offerings
and business models would aid in tapping
market profitably and efficiently
NEWER GEOGRAPHIES AND VERTICALS PROVIDE
HUGE OPPORTUNITIES
New
verticals
New customer
segments
New
geographies
Source: International Data Corporation (IDC), Nasscom
Note: SMB - Small and Medium Businesses
27. For updated information, please visit www.ibef.orgIT & ITeS27
EXPANSION OF FOCUS AREAS TO AID FUTURE
GROWTH âĻ (1/2)
Market size of other progressing verticals by 2020 (US$ billion)
Source: Nasscom, Gartner
Note: SMB - Small and Medium Business
ī§ Technologies, such as telemedicine, health, remote monitoring
solutions and clinical information systems, would continue to boost
demand for IT service across the globe
ī§ IT sophistication in the utilities segment and the need for
standardisation of the process are expected to drive demand
ī§ Digitisation of content and increased connectivity is leading to a rise in
IT adoption by media
ī§ RBI is executing a plan to reduce online transaction costs to encourage
digital banking in India
ī§ In March 2017, the government set a target of achieving 25 billion
digital transactions for banks with the help of PoS machines,
transactions enabled and merchants, which have been added in firms.
ī§ In March 2017, Samsung launched a mobile payment service, through
which it facilitates the customers to make payments at numerous retail
locations instead of using mobile wallets, credit or debit cards.
ī§ In 2017, ICICI Bank announced plans to create 600 digital villages in
India by the year end, to motivate use of digital transactions in remote
areas. Also, the government launched Bharat Interface for Money app
which helps customers to transact through mobile phones.
ī§ Indiaâs banking sector is likely to increase its spending on IT
infrastructure by 11.7 per cent to US$ 9.1 billion in 2017.
17
25
58
90
250
0 50 100 150 200 250 300
MediaUtilitiesHealthcareGovernmentSMB
28. For updated information, please visit www.ibef.orgIT & ITeS28
EXPANSION OF FOCUS AREAS TO AID FUTURE
GROWTH âĻ (2/2)
ī§ Emerging geographies would drive the next growth phase for IT firms in India
ī§ BRIC would provide US$ 380â420 billion opportunity by 2020
ī§ Focus on building local credible presence, high degree of domain expertise at competitive costs and attaining operational excellence hold key to
success in new geographies
ī§ Emphasis on export of IT services to current importers of other products and services
Country IT spend Indiaâs penetration Key segments
Canada US$ 63 billion ~1.5 per cent Enterprise applications, cyber security, healthcare IT
Europe US$ 230 billion <1.5 per cent IT sourcing, BPM, IS outsourcing, CAD
Japan US$ 235 billion <1 per cent CRM, ERP, Salesforce automation, SI
Spain US$ 26 billion <1.5 per cent IT sourcing, SI
Mexico US$ 29 billion ~4 per cent IT sourcing, BPM
Brazil US$ 47 billion ~2 per cent Low level application management, artificial intelligence, R D
China US$ 105 billion <1 per cent Software outsourcing, R D
Australia US$ 48 billion ~4 per cent Procurement outsourcing, infrastructure software and CAD
Countries offering growth potential to IT firms
Source: Nasscom
30. For updated information, please visit www.ibef.orgIT & ITeS30
TCS: AN EMERGING GLOBAL IT MAMMOTH
Achievements:
ī§ 2017: Awarded Pega 2017 Partner Excellence Award
ī§ 2016: Won 3 Silver Stevies at 14th Annual American Business
Awards
ī§ 2015: Gold, Silver and Bronze StevieÂŽ Winner at the American
Business Awards
ī§ 2014: Gold and Silver StevieÂŽ Winner at the American Business
Awards
ī§ 2013: Won Best Performing Consultancy Brand Award in Europe
ī§ 2013: Received Red Hat North America Awards for System
Integrator Partner of the Year
38.0%
17.6%
16.1%
11.7%
9.0%
4.9%2.9%
Application development and
maintenance (ADM)
Enterprise solutions (ES) and
consulting
Infrastructure services (IS)
Business process and
services (BPS)
Assurance services
Engineering and industrial
services (EIS)
Asset leveraged solutions
Segment-wise revenue breakdown (FY17)
Financial performance (US$ Billion)
6.0
6.3
8.2
10.0
12.0
13.0
15.0
16.6
18.3
9.3
1.4
1.7
2.3
2.8
3.1
3.9
4.1
4.4
4.7
1.9
0.0
5.0
10.0
15.0
20.0
FY09 FY10 FY11 FY12 FY13 FY14 FY15 FY16 FY17 H1
FY18
Revenue Operating Profit
Source: TCS Website, Annual Report
ī§ Established in 1968, Tata Consultancy Services (TCS) is an
Information Technology (IT) services, consulting and business
solution company. The company provides end-to-end technology and
technology-related services to global enterprises. The companyâs
business is spread across the Americas, Europe, Asia-Pacific and
Middle East and Africa (MEA).
ī§ TCS accounts for nearly half of the Indian IT industryâs combined
market capitalisation
ī§ In April 2017, TCS has approved a buyback plan for US$2.38 billion.
The shares represent 2.85 per cent in the buyback of the total equity
capital at US$42.39 per share.
CAGR 21.6 %
31. For updated information, please visit www.ibef.orgIT & ITeS31
TCS: MILESTONES
Became the first software
company in India to cross US$ 1
billion revenue; Issued IPO in the
market in India and raised US$
1.2 billion in 2004
Revenue reached US$
18.3 billion in FY17.
Acquired
microDATA GIS in
2012; Acquired IT
service firm Alti in
France in 2013
Indiaâs first software service
company
1968 2017
2015-162012-132003-04
Source: Company website
Revenue reached US$
15.7 billion in FY15 and
US$ 16.6 billion in FY16.
32. For updated information, please visit www.ibef.orgIT & ITeS32
INFOSYS: EMERGENCE OF AN INDIA-BASED MNC
Source: Infosys Website, Annual Report
Achievements:
ī§ 2017: Infosys won three out of seven Catalyst Awards at TM Forum
Live
ī§ 2016: Infosys was recognised with âCorporate Citizen of the Yearâ at
2015 Economic Times Award
ī§ 2015: Infosys would offer software solutions on Verizon Cloud for the
U.S. Bank
ī§ 2015: Infosys completed the implementation of Smart Oilfield
Services Solutions for FTS International
ī§ 2014: Infosys secured the âGreen Energy Awardâ and âGold Awardâ
at the International Ashden Awards Ceremony
ī§ 2013: Ranked 1st in the annual Euromoney Best Managed
Companies in Asia survey
ī§ Established in 1981, Infosys Ltd. is engaged in consulting,
engineering, technology and outsourcing services. The companyâs
end-to-end services include consulting and system integration.
Infosys operates through 30 offices across India, the US, China,
Australia, the UK, Canada and Japan.
ī§ In November 2016, Infosys invested around US$ 4.89 million in a
venture fund, Stellaris Venture Partners, so as to gain access to new
and innovative technology offered by upcoming enterprises.
27.1%
11.0%
22.5%
16.4%
12.3%
Financial services and
insurance (FSI)
Manufacturing (MFG)
Energy and utilities,
communications and services
(ECS)
Retail, consumer, packed
goods, logistics (RCL)
Life sciences and healthcare
(LSH)
Segment-wise revenue breakdown (FY17)
5.0
4.8
6.0
7.0
7.4
8.3
8.7
9.5
10.2
5.4
1.7
1.6
1.8
2.0
1.9
2.0
2.3
2.6
2.5
1.1
0.0
2.0
4.0
6.0
8.0
10.0
12.0
FY09
FY10
FY11
FY12
FY13
FY14
FY15
FY16
FY17
Q1FY18
Revenue Operating Profit
Financial performance (US$ Billion)
CAGR 9.32 %
33. For updated information, please visit www.ibef.orgIT & ITeS33
INFOSYS: MILESTONES
Source: Company website
Launched
IPO
Listed on the NYSE market in
FY 12; Strong diversified client
base of 890 clients in FY14
Acquired Panaya Inc,
Skava, Noah Consulting
LLC in 2015. Launched
Infosys Mana in 2016.
Revenue reached US$
10.2 billion in FY17.
Reached US$ 100
million and listed on
NASDAQ
Founded in Pune with an initial
capital of US$ 250
1981 2015-2017
2012-1419991993
34. For updated information, please visit www.ibef.orgIT & ITeS34
IT & ITeS
KEY INDUSTRY
ORGANISATIONS
35. For updated information, please visit www.ibef.orgIT & ITeS35
INDUSTRY ORGANISATIONS
Address: International Youth Centre Teen Murti Marg, Chanakyapuri,
New Delhi â 110 021
Phone: 91 11 2301 0199
Fax: 91 11 2301 5452
E-mail: info@nasscom.in
National Association of Software and Services Companies
(NASSCOM)
37. For updated information, please visit www.ibef.orgIT & ITeS37
GLOSSARY
ī§ APAC: Asia Pacific
ī§ BFSI: Banking, Financial Services and Insurance
ī§ BPM: Business Process Outsourcing
ī§ CAGR: Compounded Annual Growth Rate
ī§ C U: Construction and Utilities
ī§ FDI: Foreign Direct Investment
ī§ GOI: Government of India
ī§ INR: Indian Rupee
ī§ IT & ITeS: Information Technology-Information Technology Enabled Services
ī§ NAC: Nasscom Assessment of Competence
ī§ RoI: Return on Investment
ī§ ROW: Rest of the World
ī§ SEZ: Special Economic Zone
ī§ SMB: Small and Medium Businesses
ī§ STPI: Software Technology Parks of India
ī§ T M: Telecom and Media
ī§ T T: Travel and Transport
ī§ US$ : US Dollar
ī§ USP: Unique Selling Proposition
ī§ UT: Union Territory
ī§ Wherever applicable, numbers have been rounded off to the nearest whole number
38. For updated information, please visit www.ibef.orgIT & ITeS38
EXCHANGE RATES
Exchange Rates (Fiscal Year) Exchange Rates (Calendar Year)
Year INR INR Equivalent of one US$
2004â05 44.81
2005â06 44.14
2006â07 45.14
2007â08 40.27
2008â09 46.14
2009â10 47.42
2010â11 45.62
2011â12 46.88
2012â13 54.31
2013â14 60.28
2014-15 61.06
2015-16 65.46
2016-17 67.09
Q1 2017-18 64.46
Q2 2017-18 64.29
Q3 2017-18 64.74
Year INR Equivalent of one US$
2005 43.98
2006 45.18
2007 41.34
2008 43.62
2009 48.42
2010 45.72
2011 46.85
2012 53.46
2013 58.44
2014 61.03
2015 64.15
2016 67.21
2017 65.12
Source: Reserve bank of India, Average for the year
39. For updated information, please visit www.ibef.orgIT & ITeS39
DISCLAIMER
India Brand Equity Foundation (IBEF) engaged Aranca to prepare this presentation and the same has been prepared by Aranca in consultation
with IBEF.
All rights reserved. All copyright in this presentation and related works is solely and exclusively owned by IBEF. The same may not be reproduced,
wholly or in part in any material form (including photocopying or storing it in any medium by electronic means and whether or not transiently or
incidentally to some other use of this presentation), modified or in any manner communicated to any third party except with the written approval
of IBEF.
This presentation is for information purposes only. While due care has been taken during the compilation of this presentation to ensure that the
information is accurate to the best of Aranca and IBEFâs knowledge and belief, the content is not to be construed in any manner whatsoever as a
substitute for professional advice.
Aranca and IBEF neither recommend nor endorse any specific products or services that may have been mentioned in this presentation and nor do
they assume any liability or responsibility for the outcome of decisions taken as a result of any reliance placed on this presentation.
Neither Aranca nor IBEF shall be liable for any direct or indirect damages that may arise due to any act or omission on the part of the user due to any
reliance placed or guidance taken from any portion of this presentation.