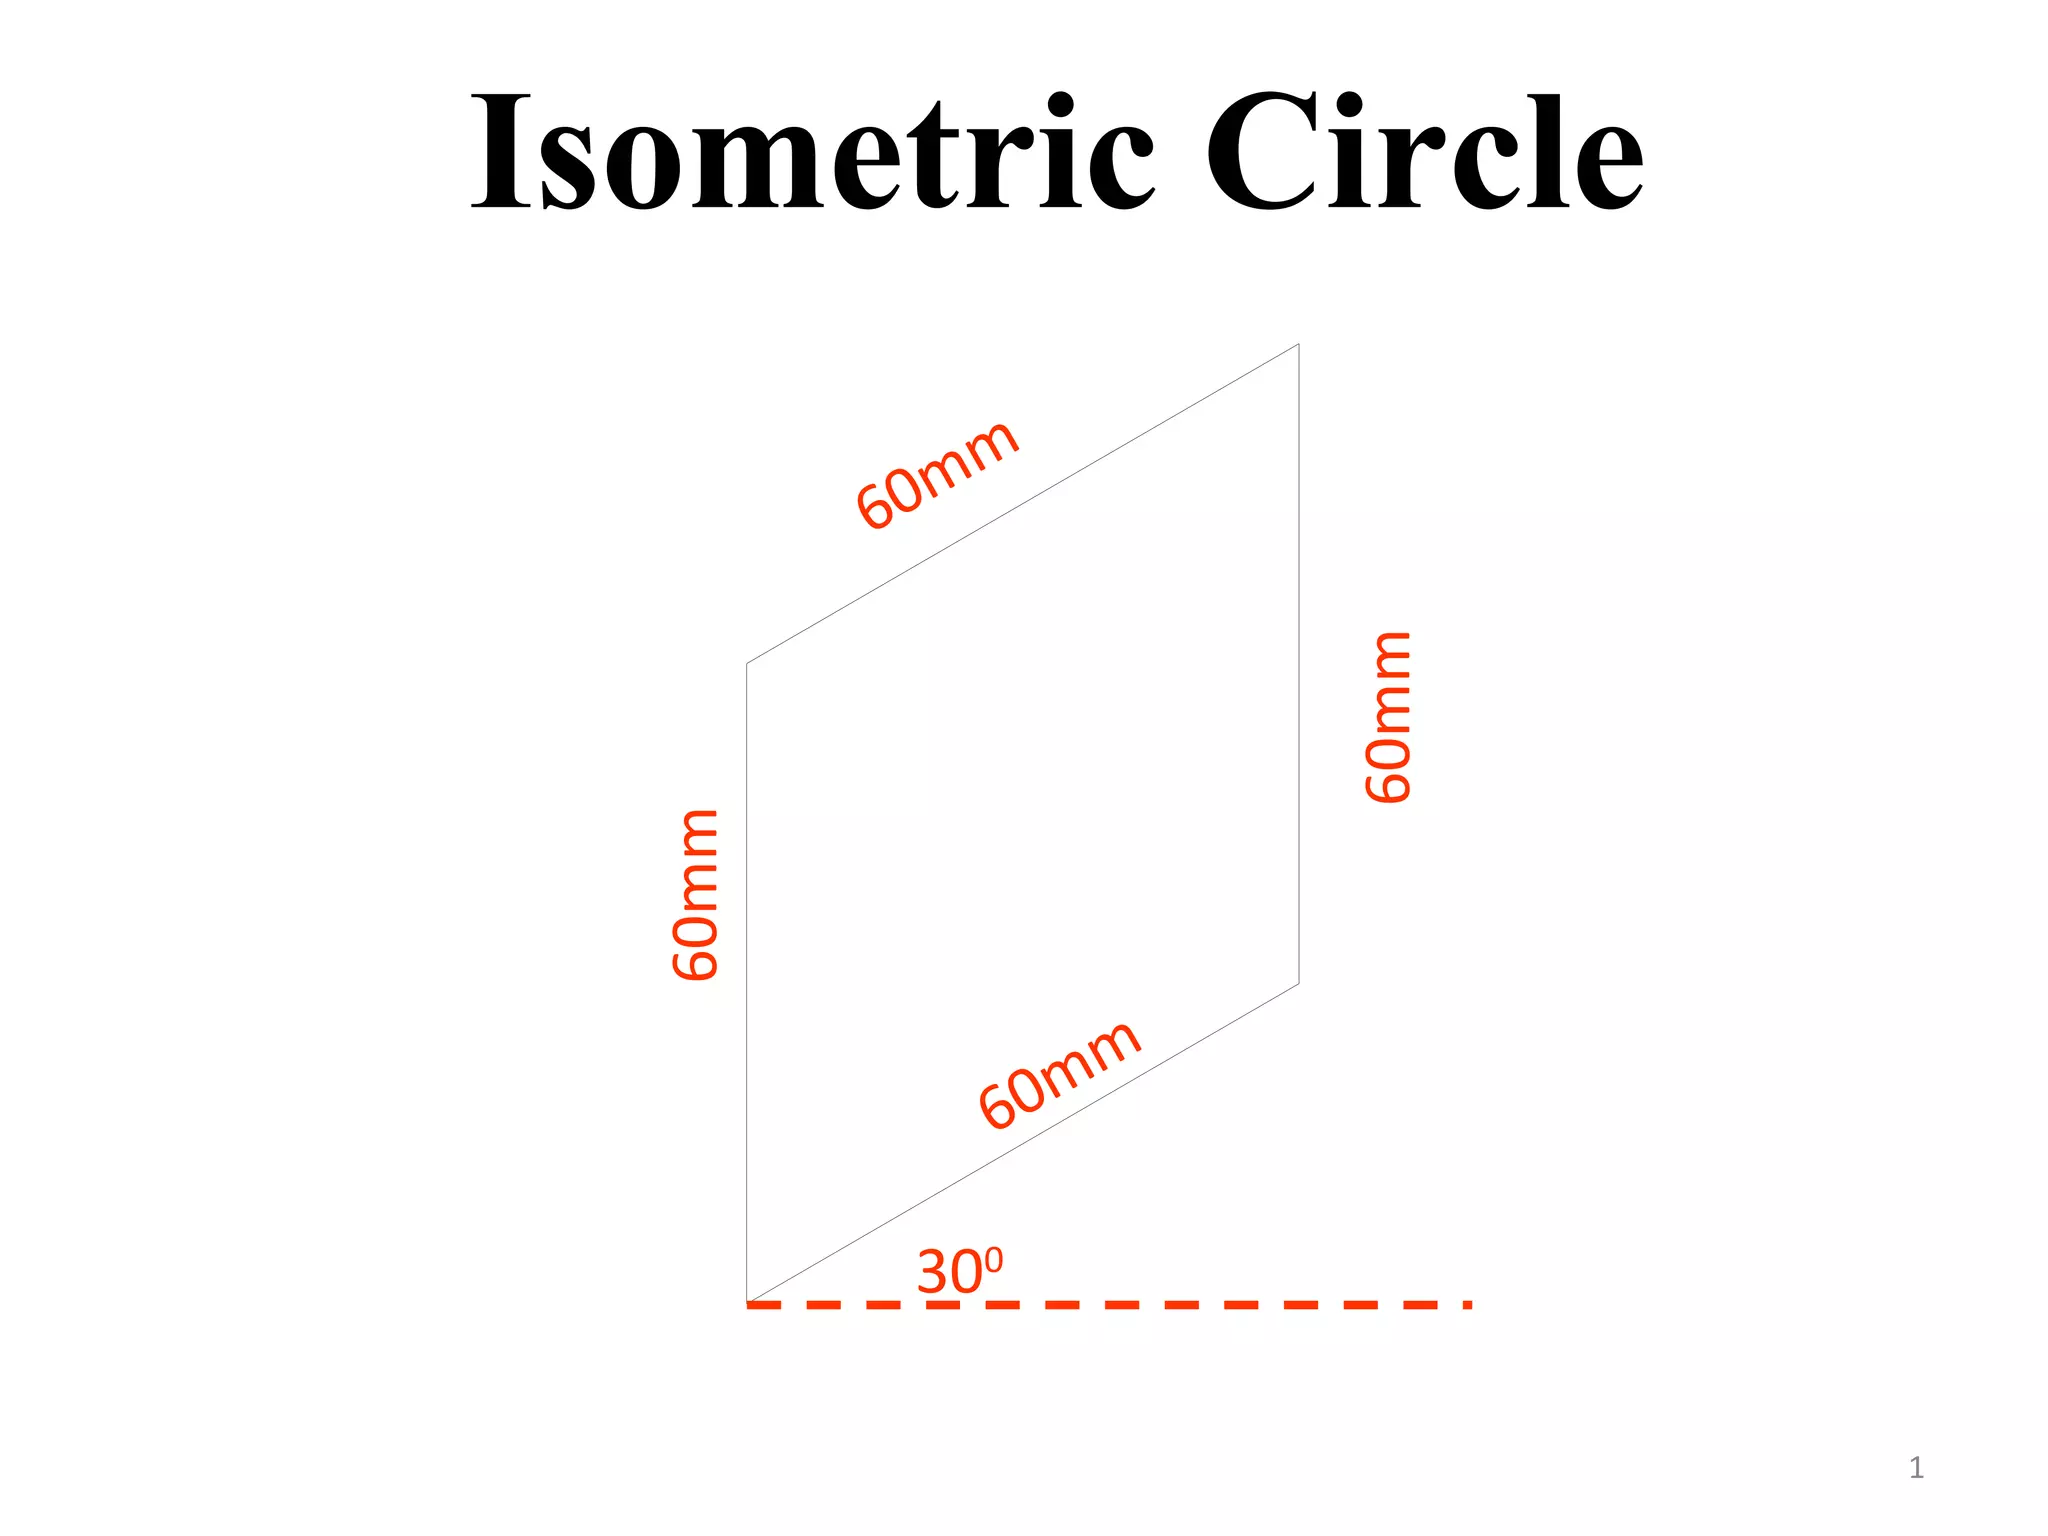
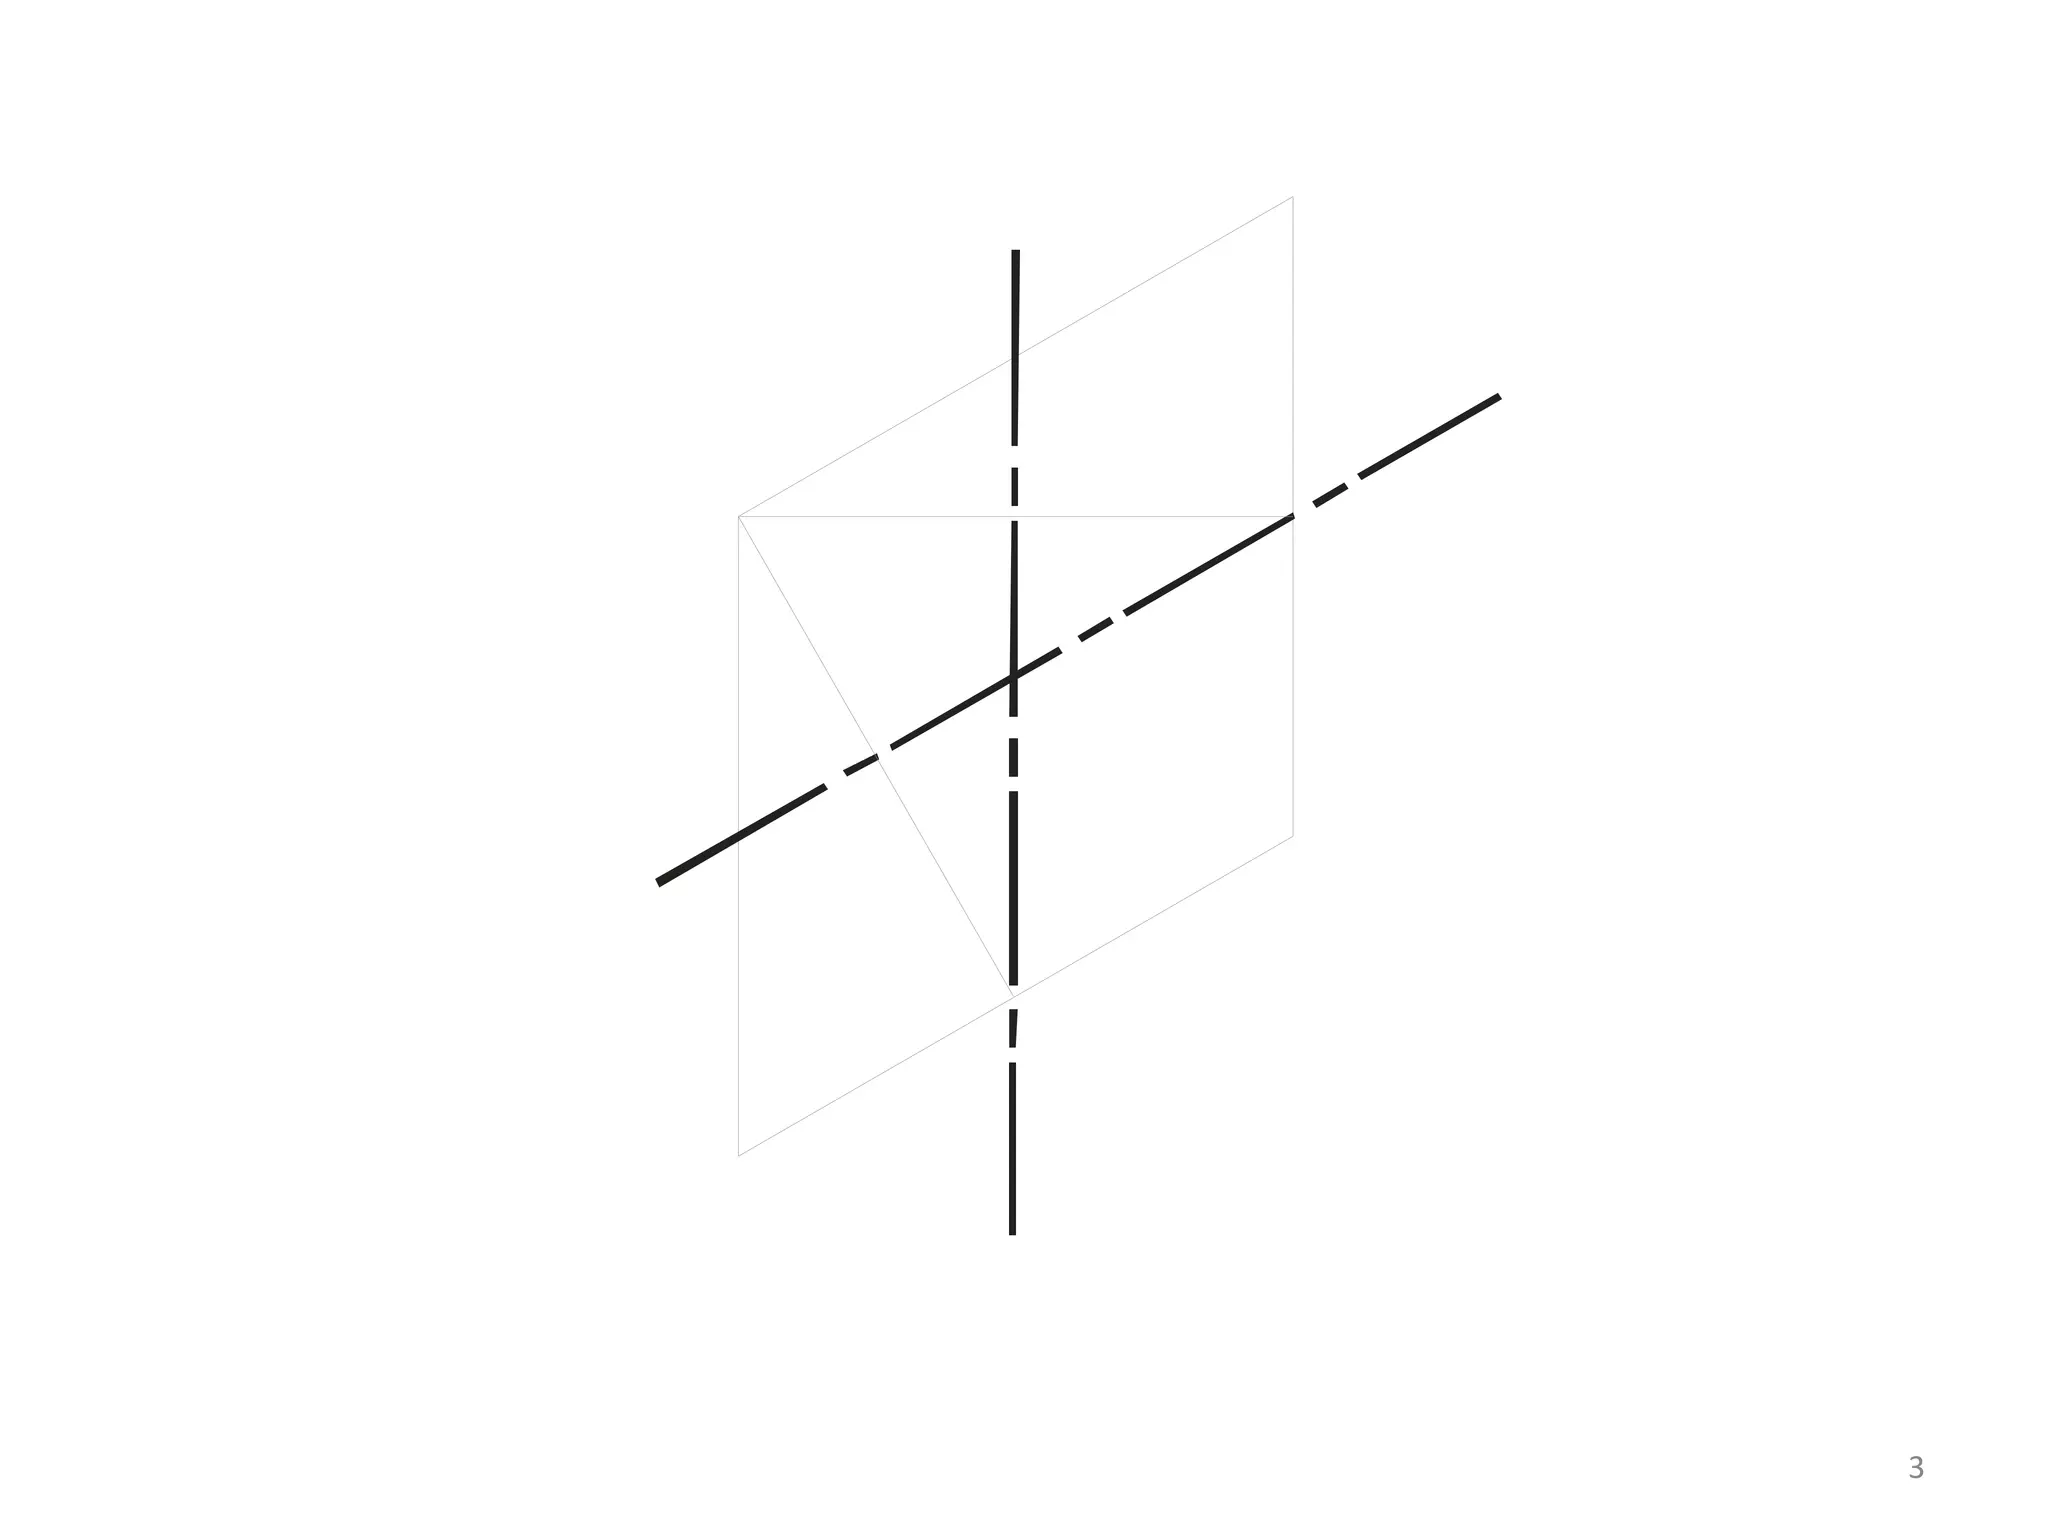
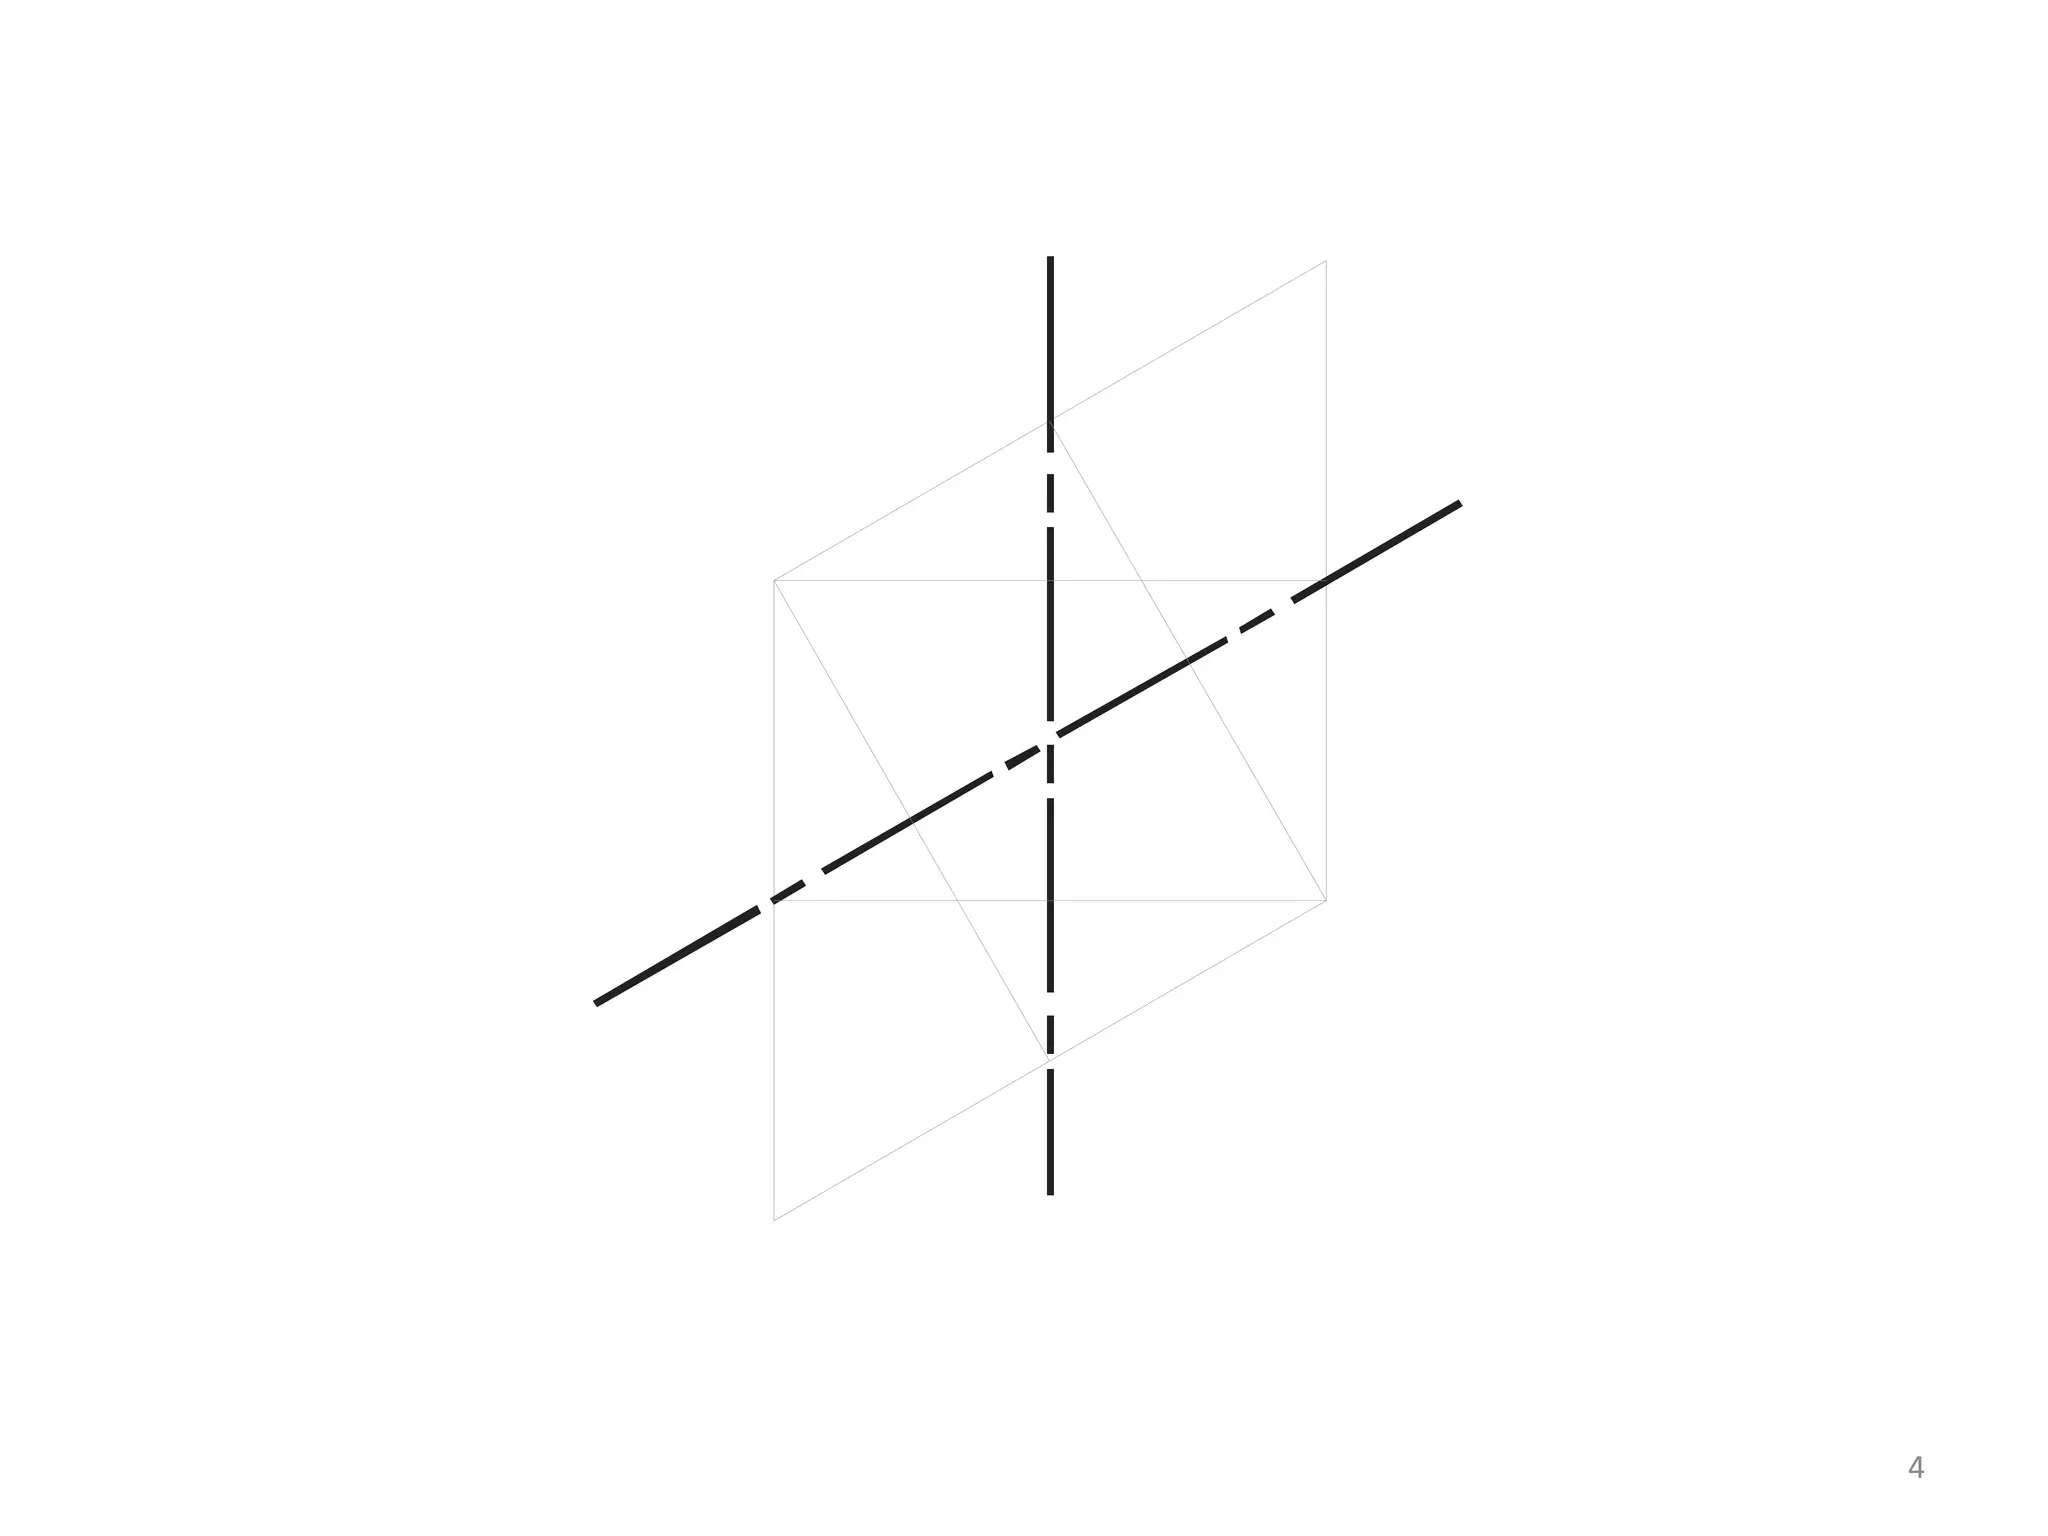
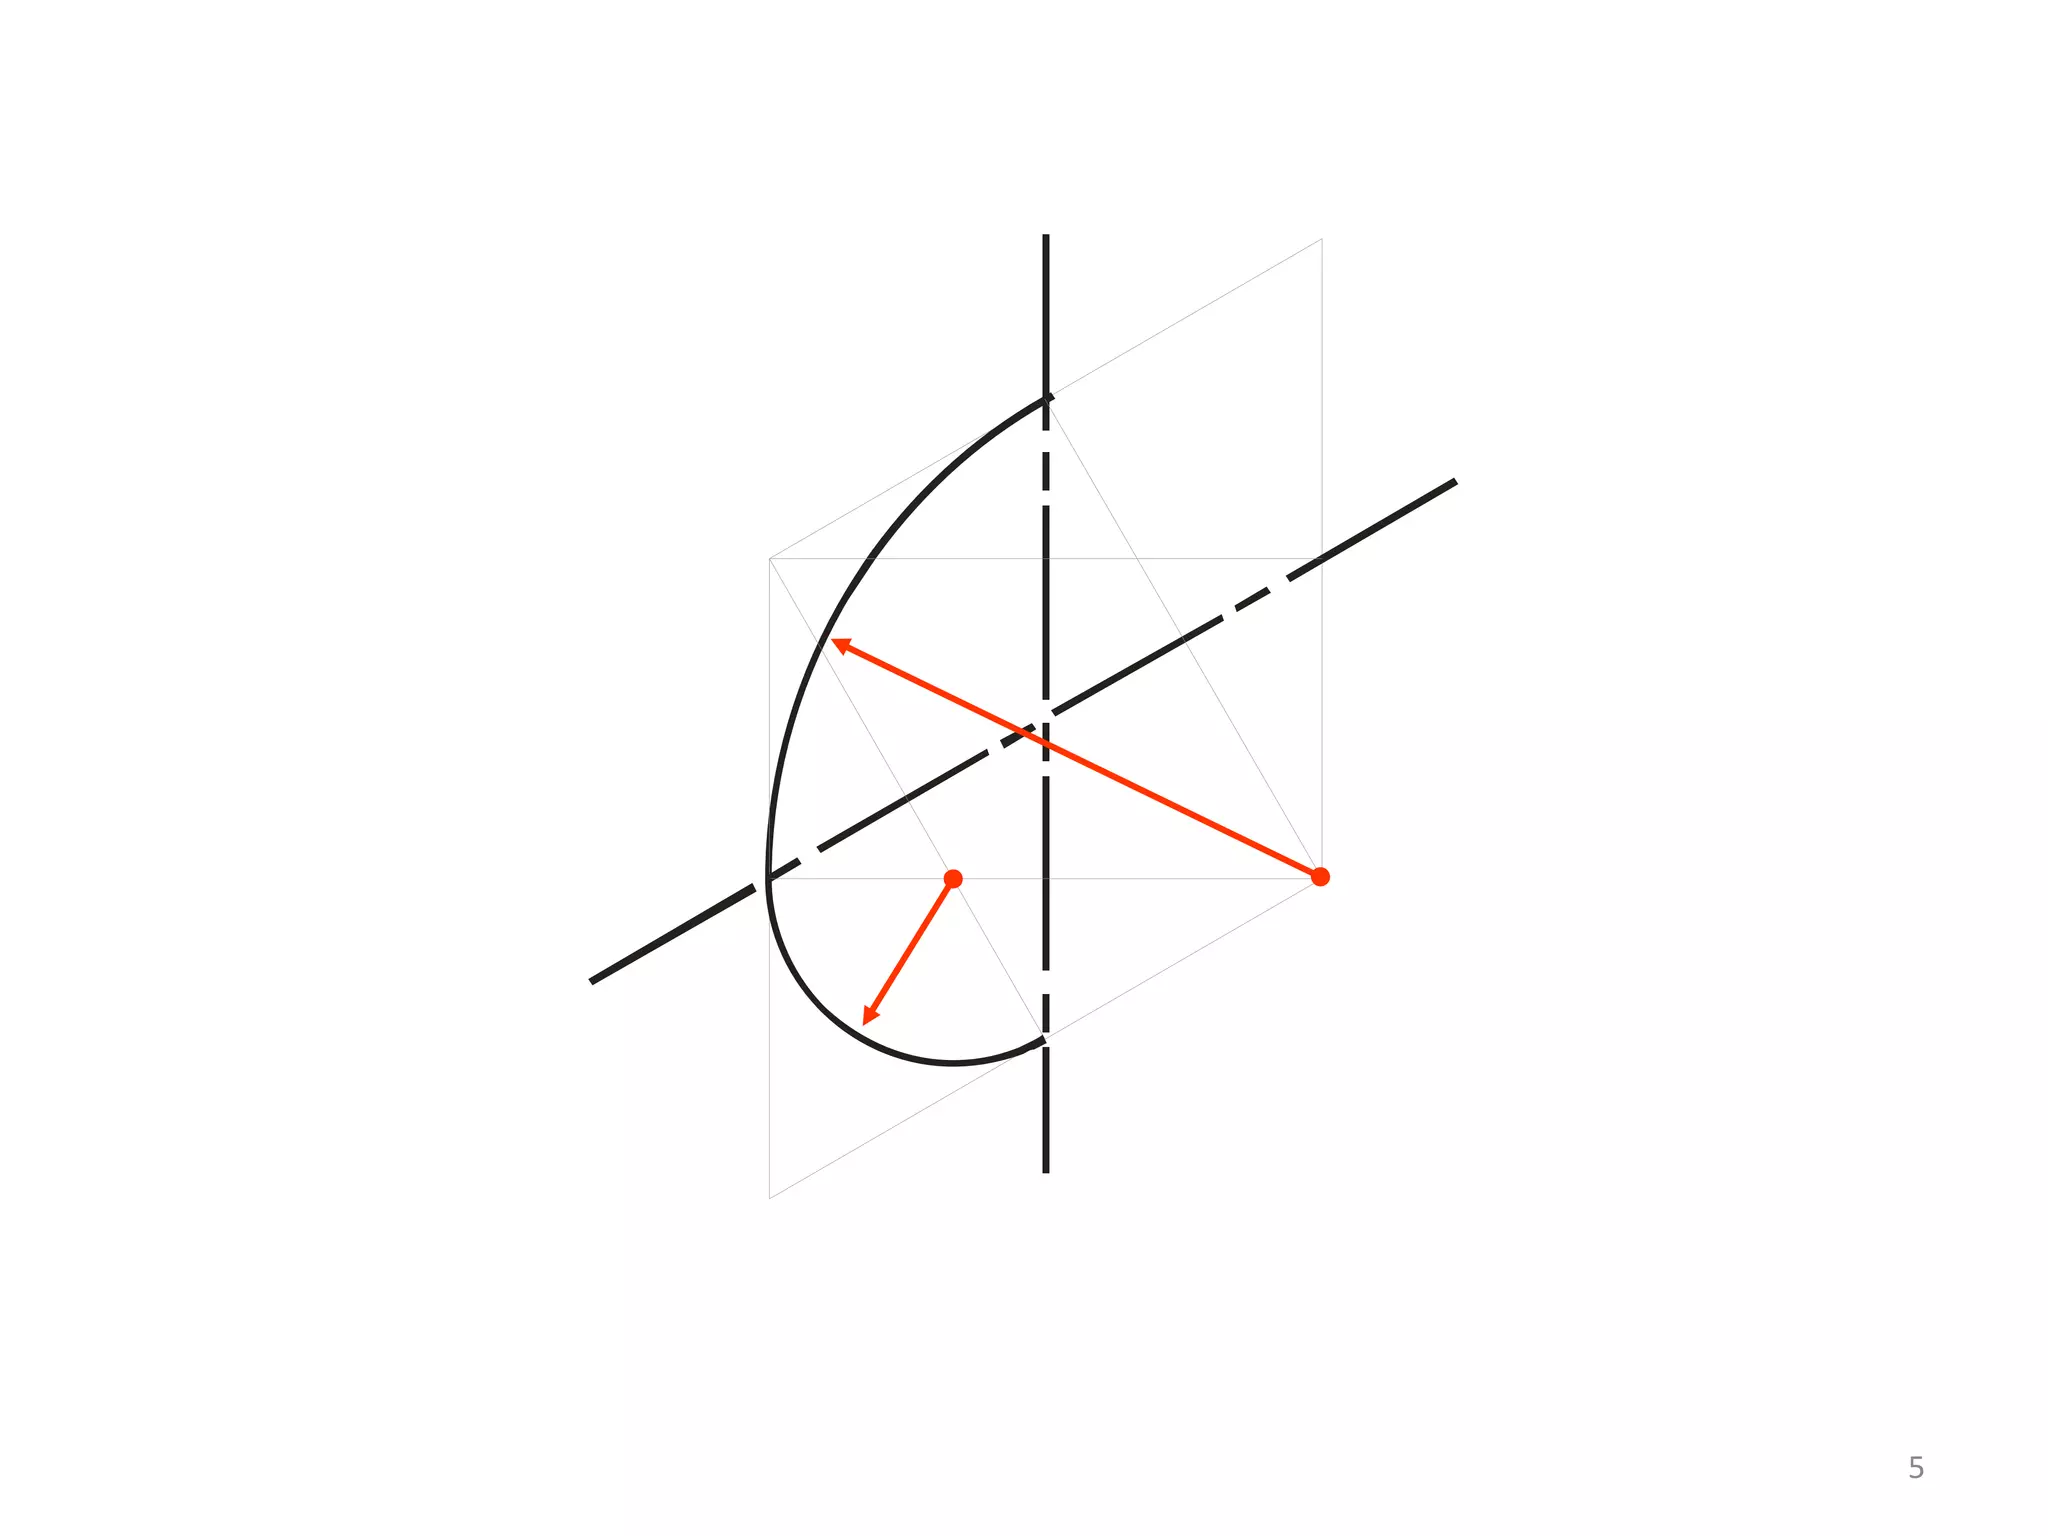
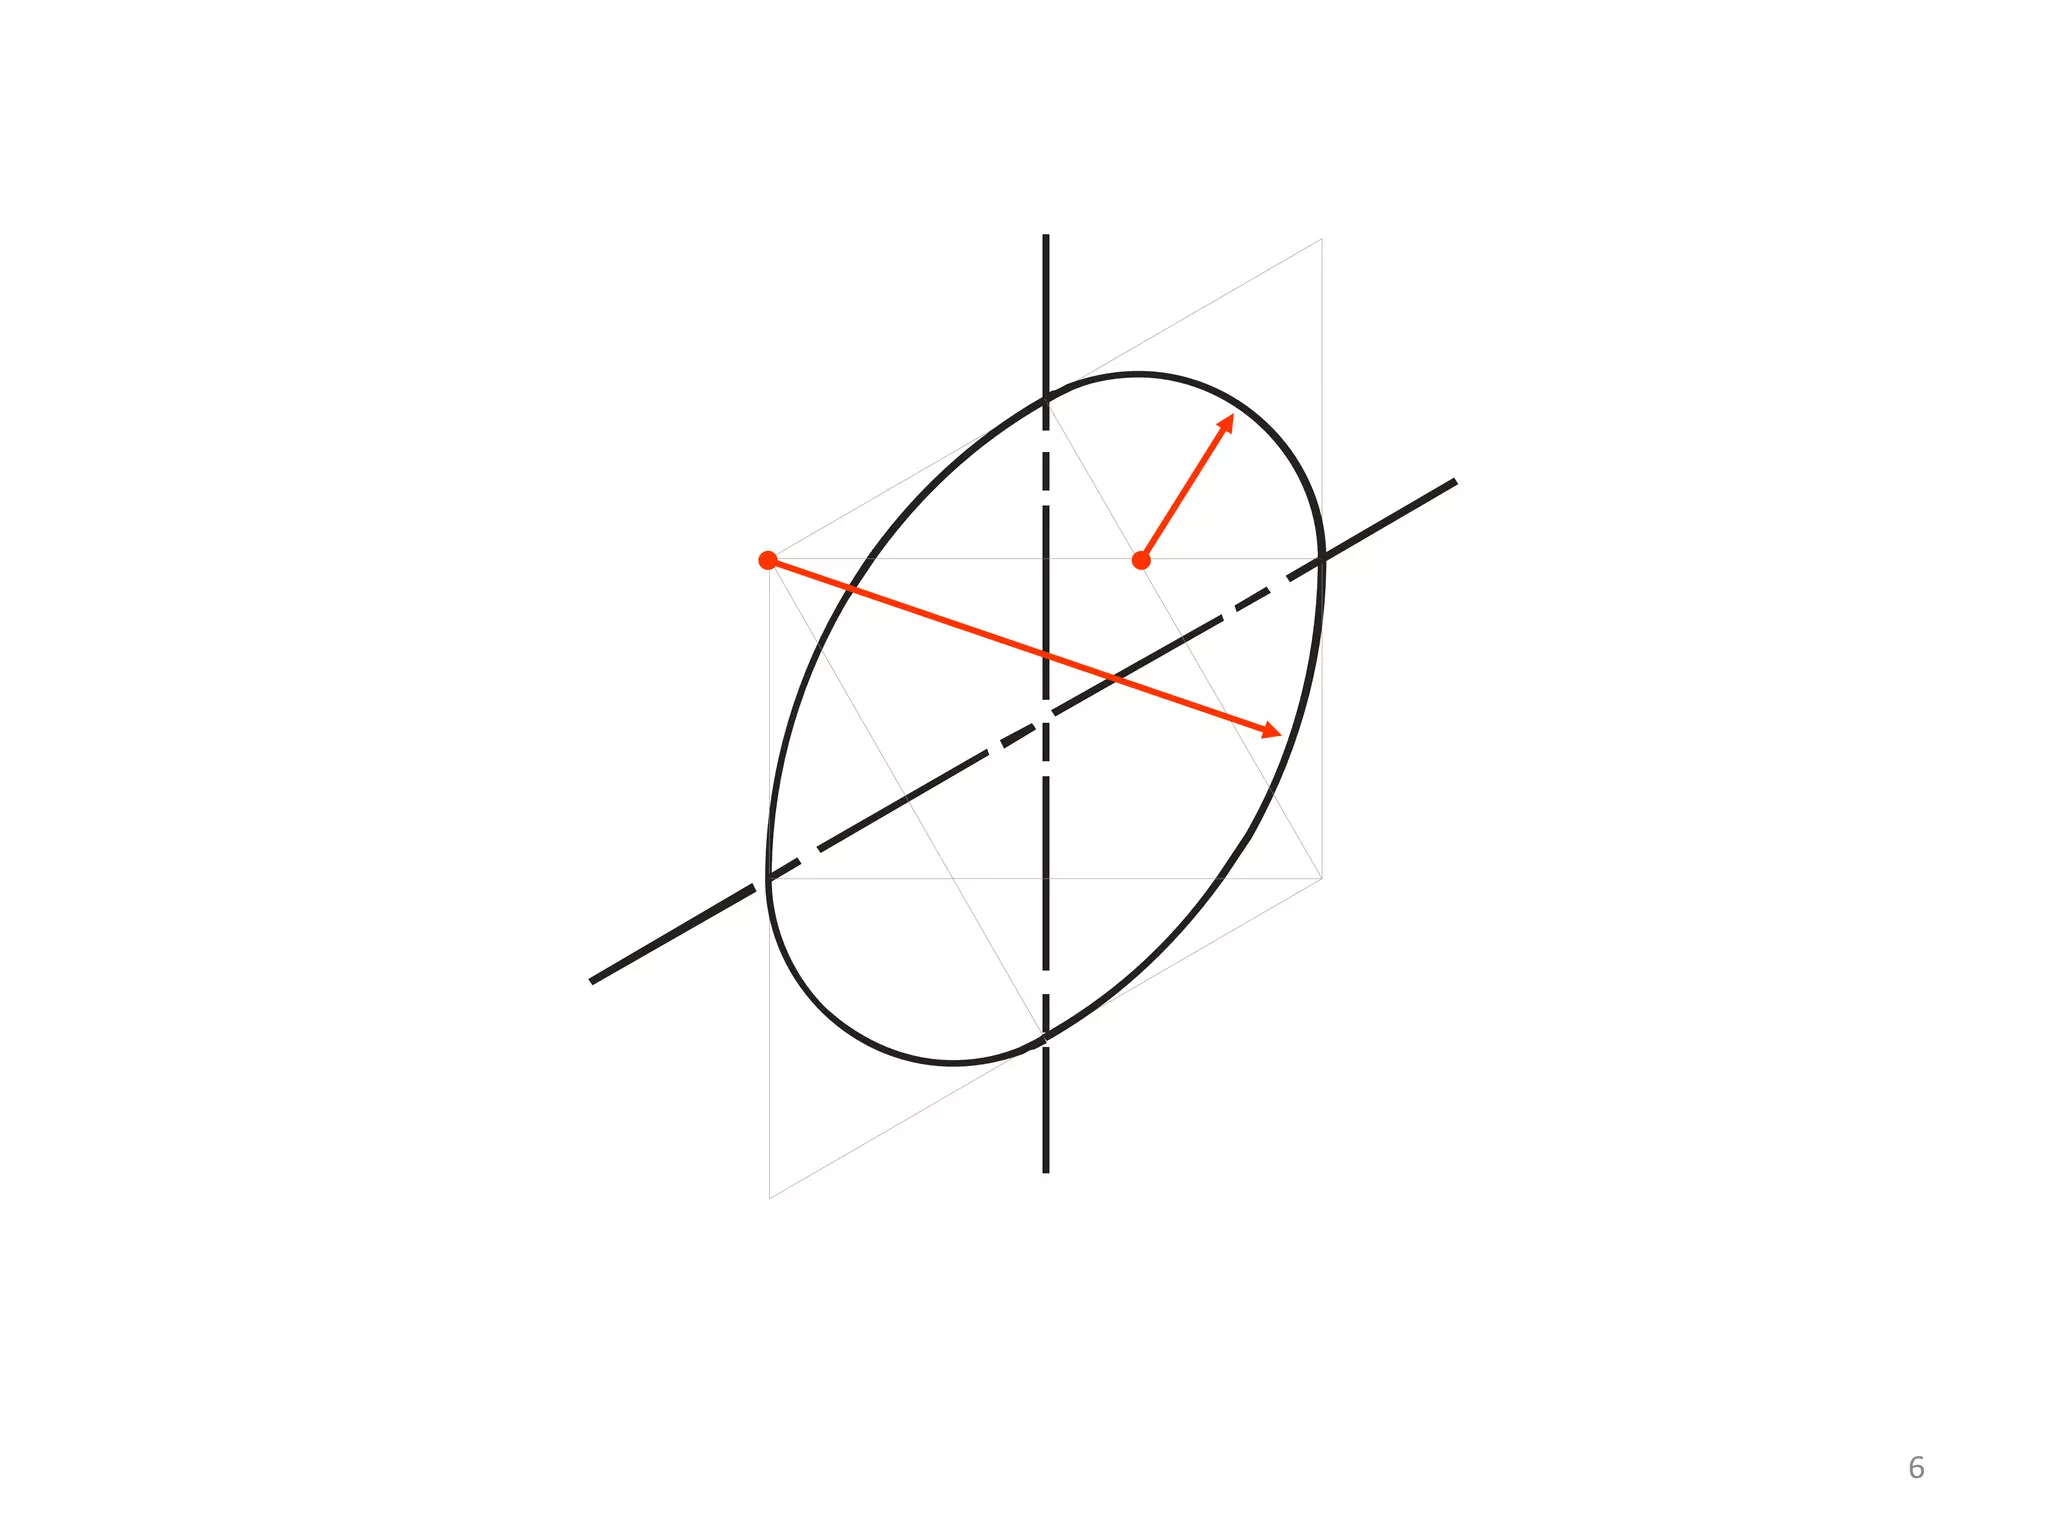
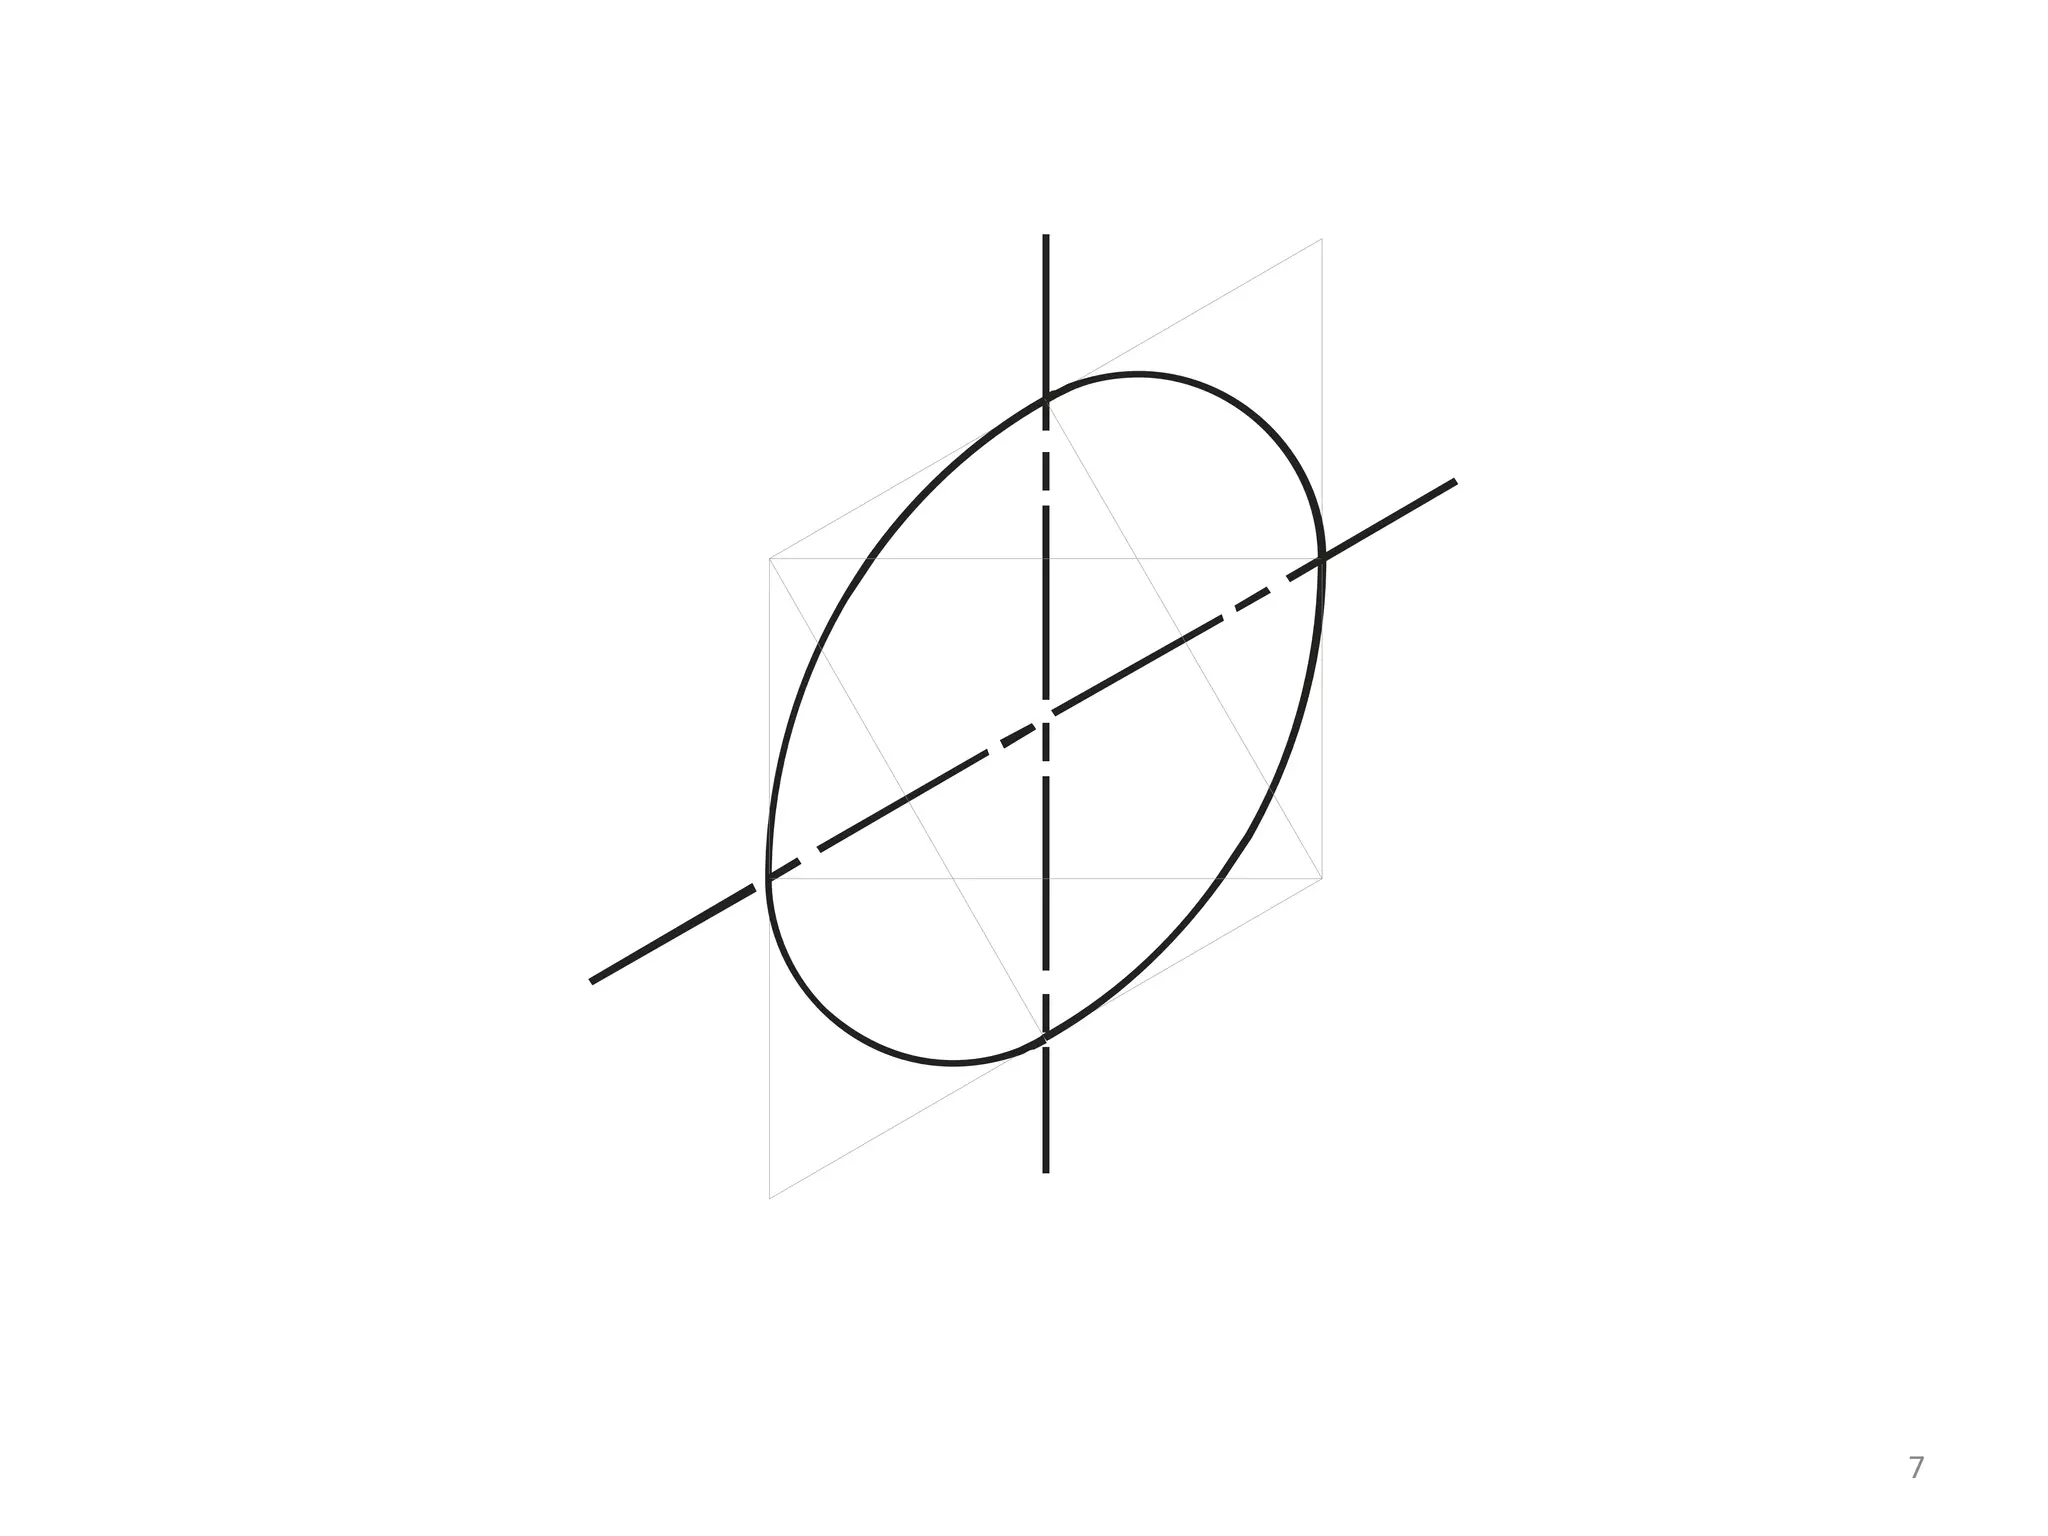
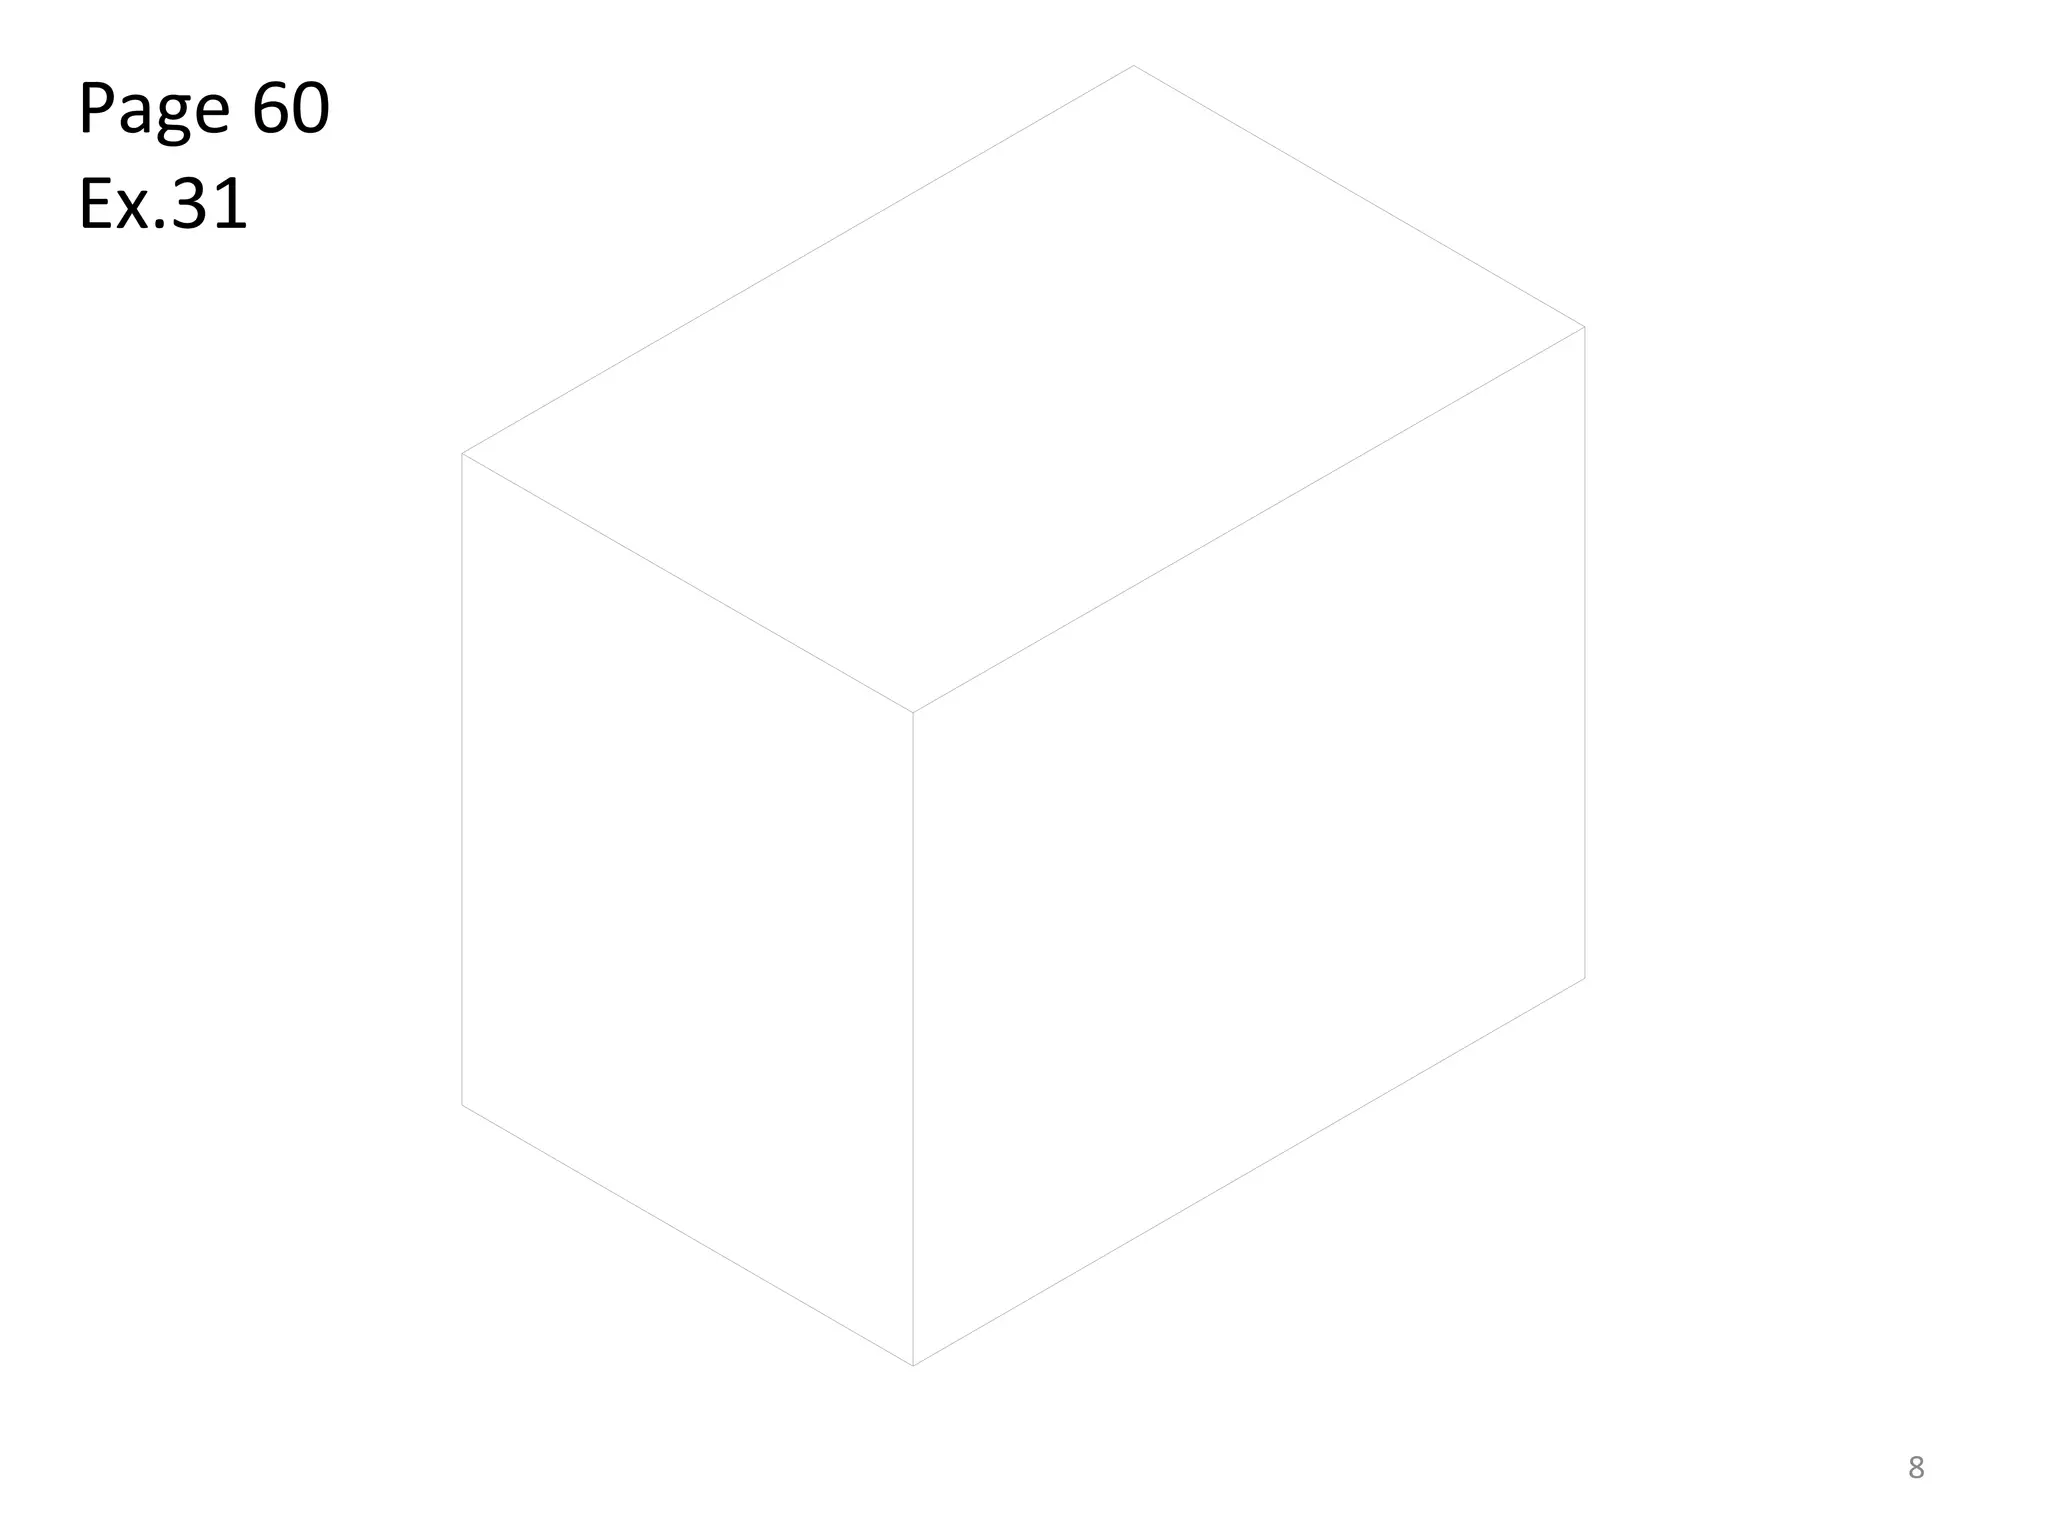
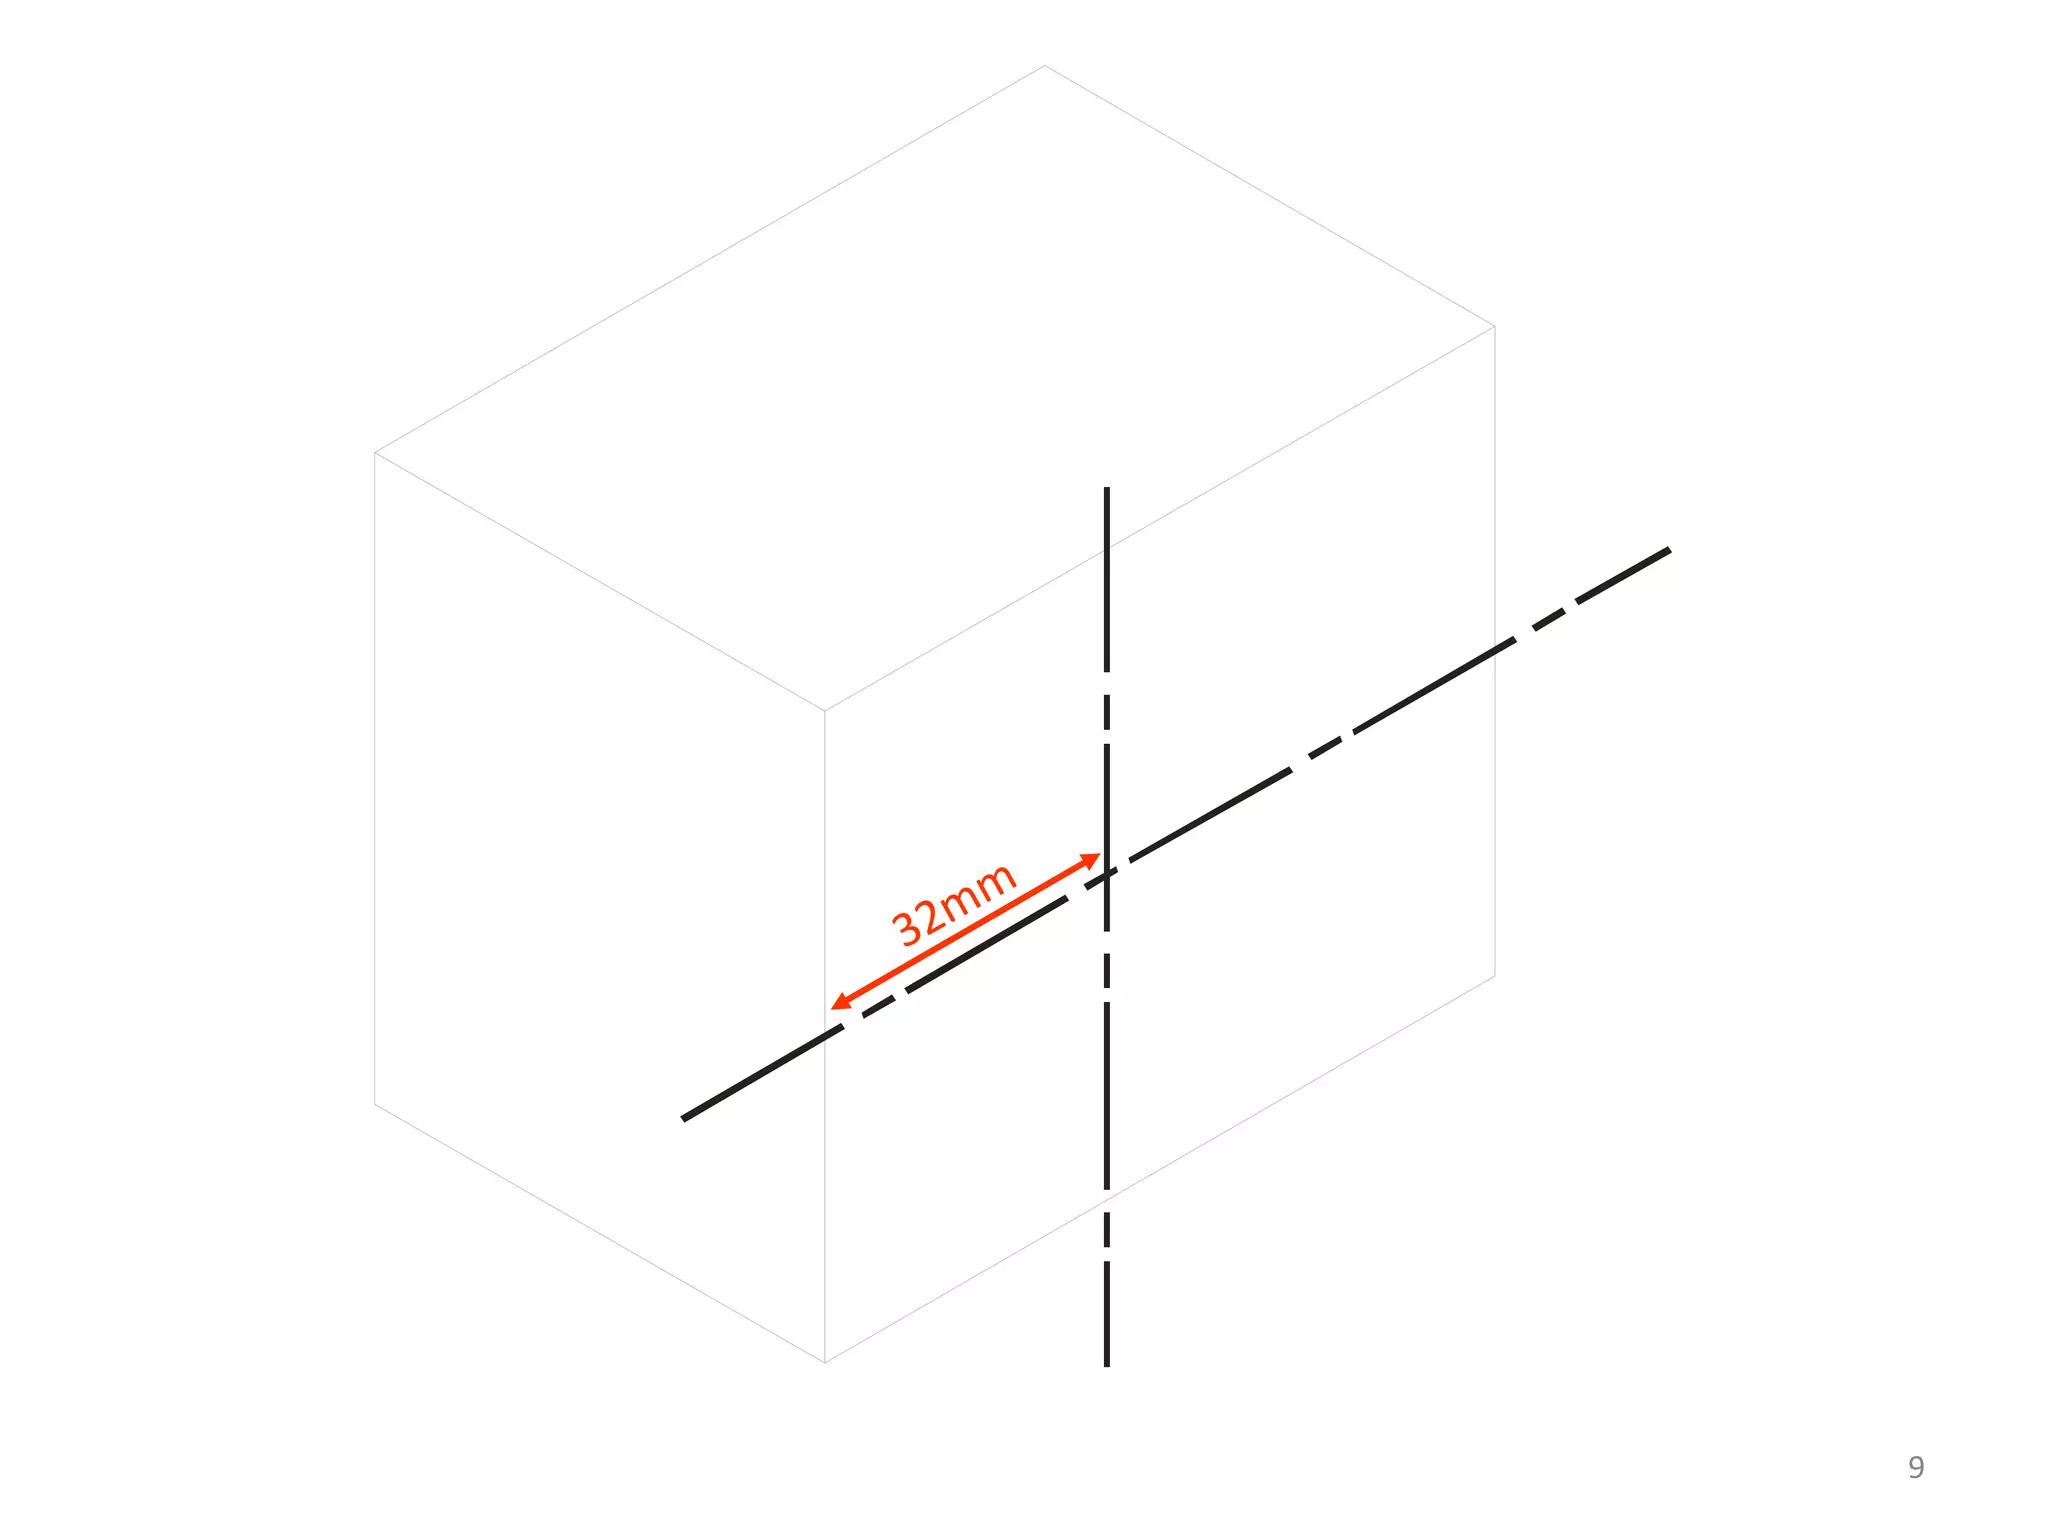
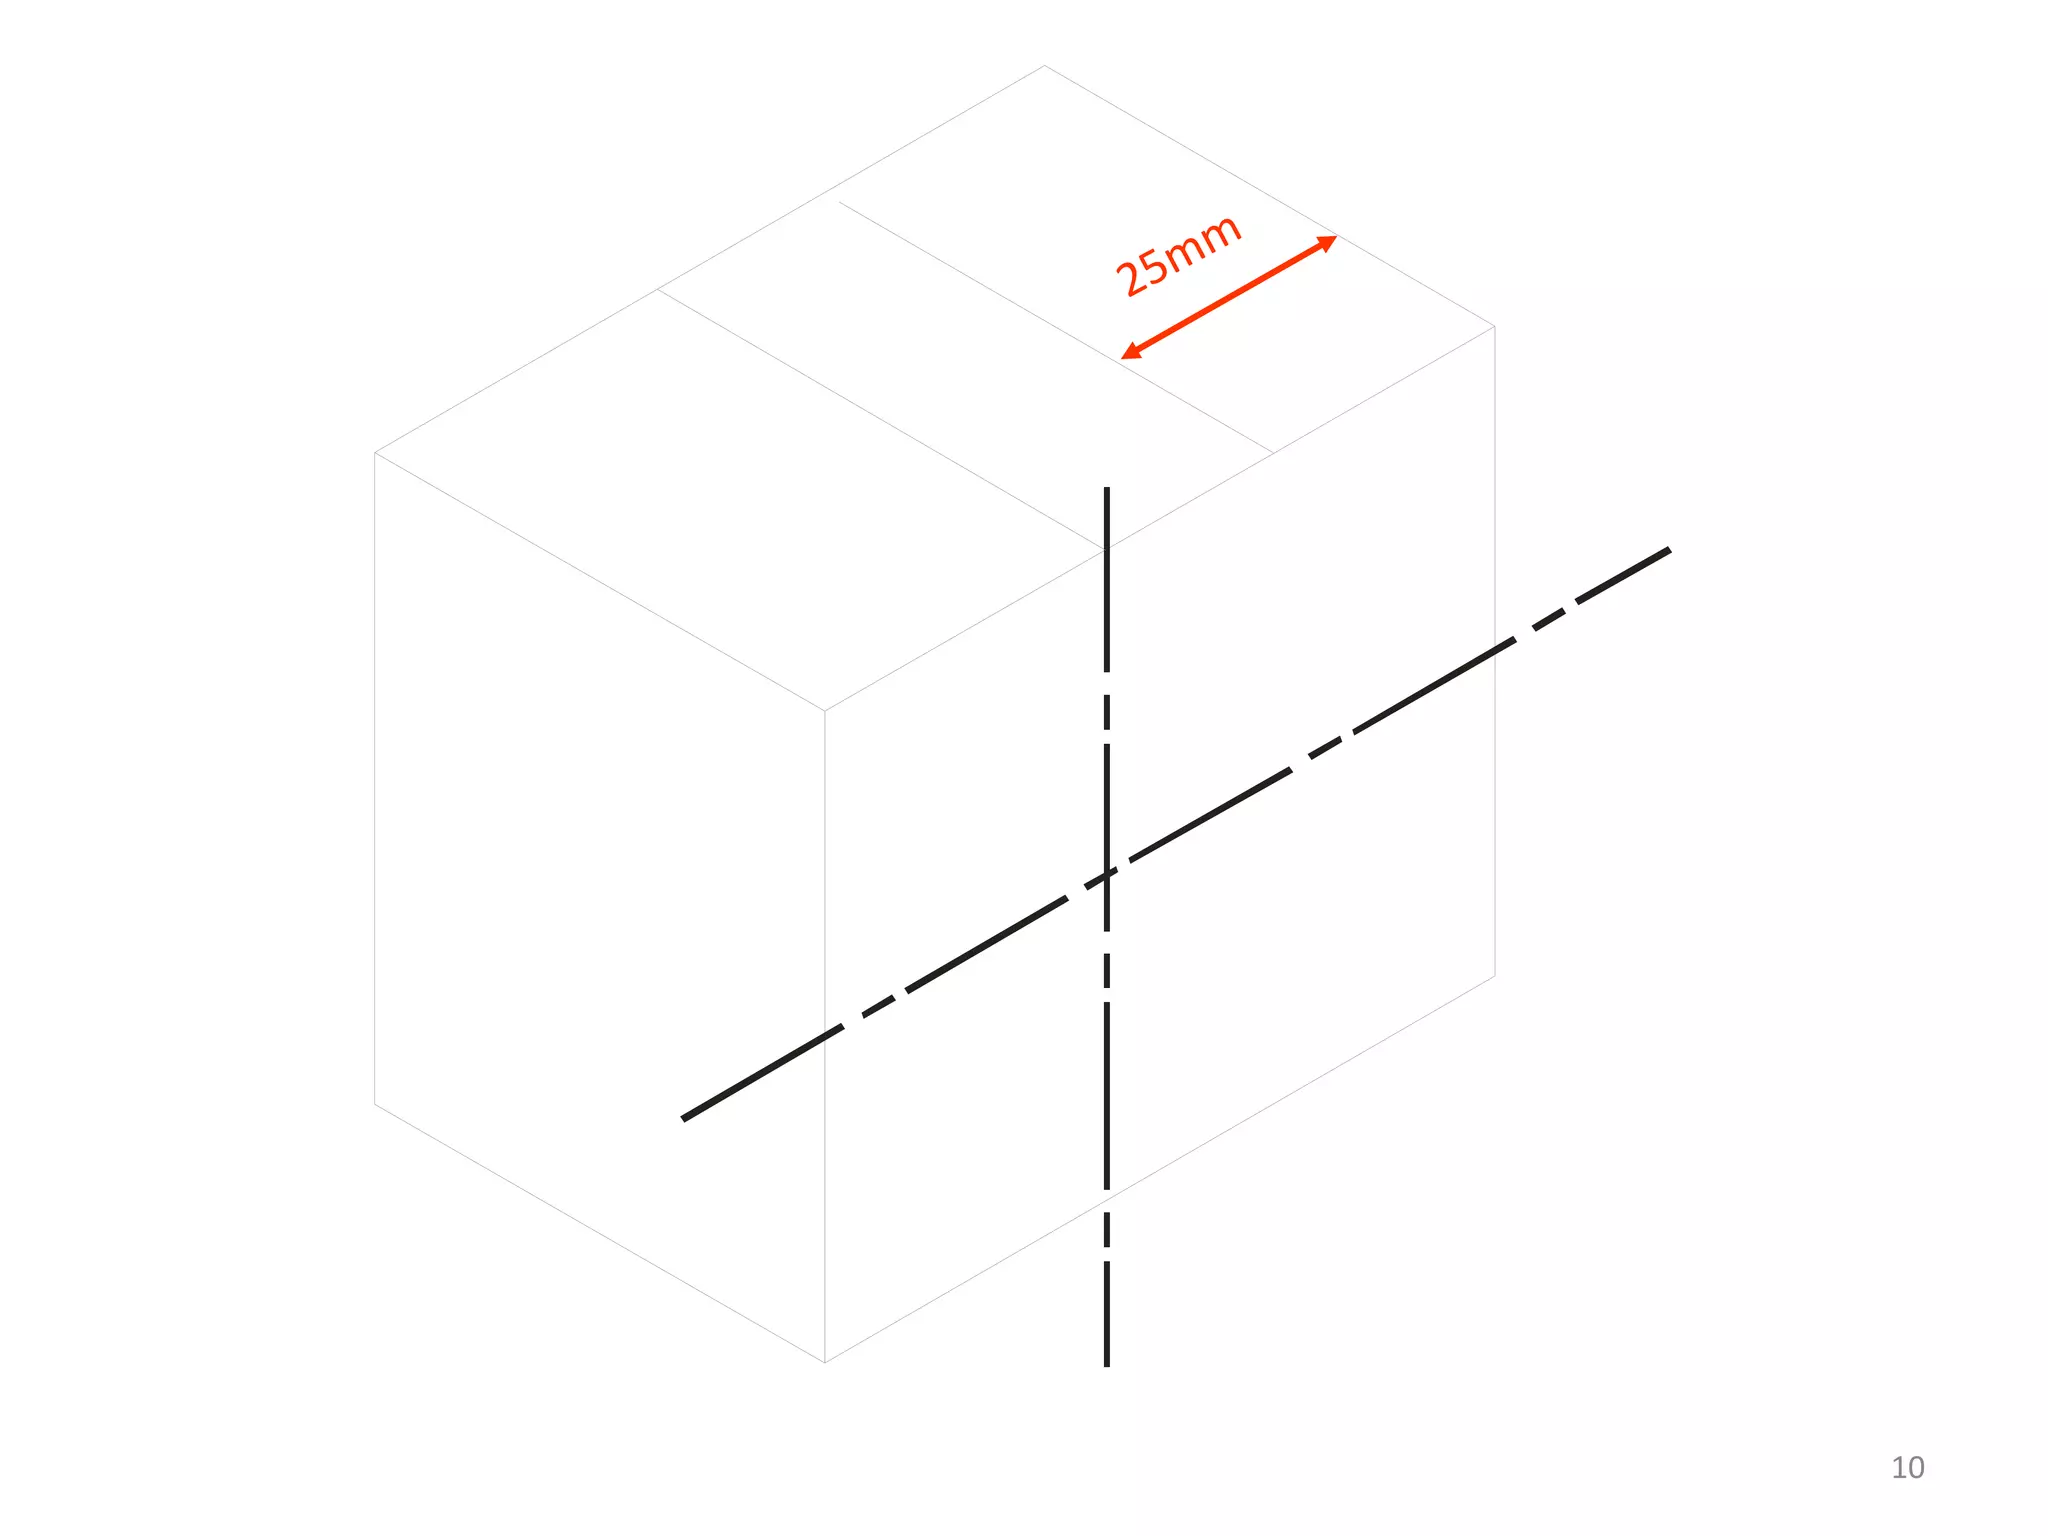
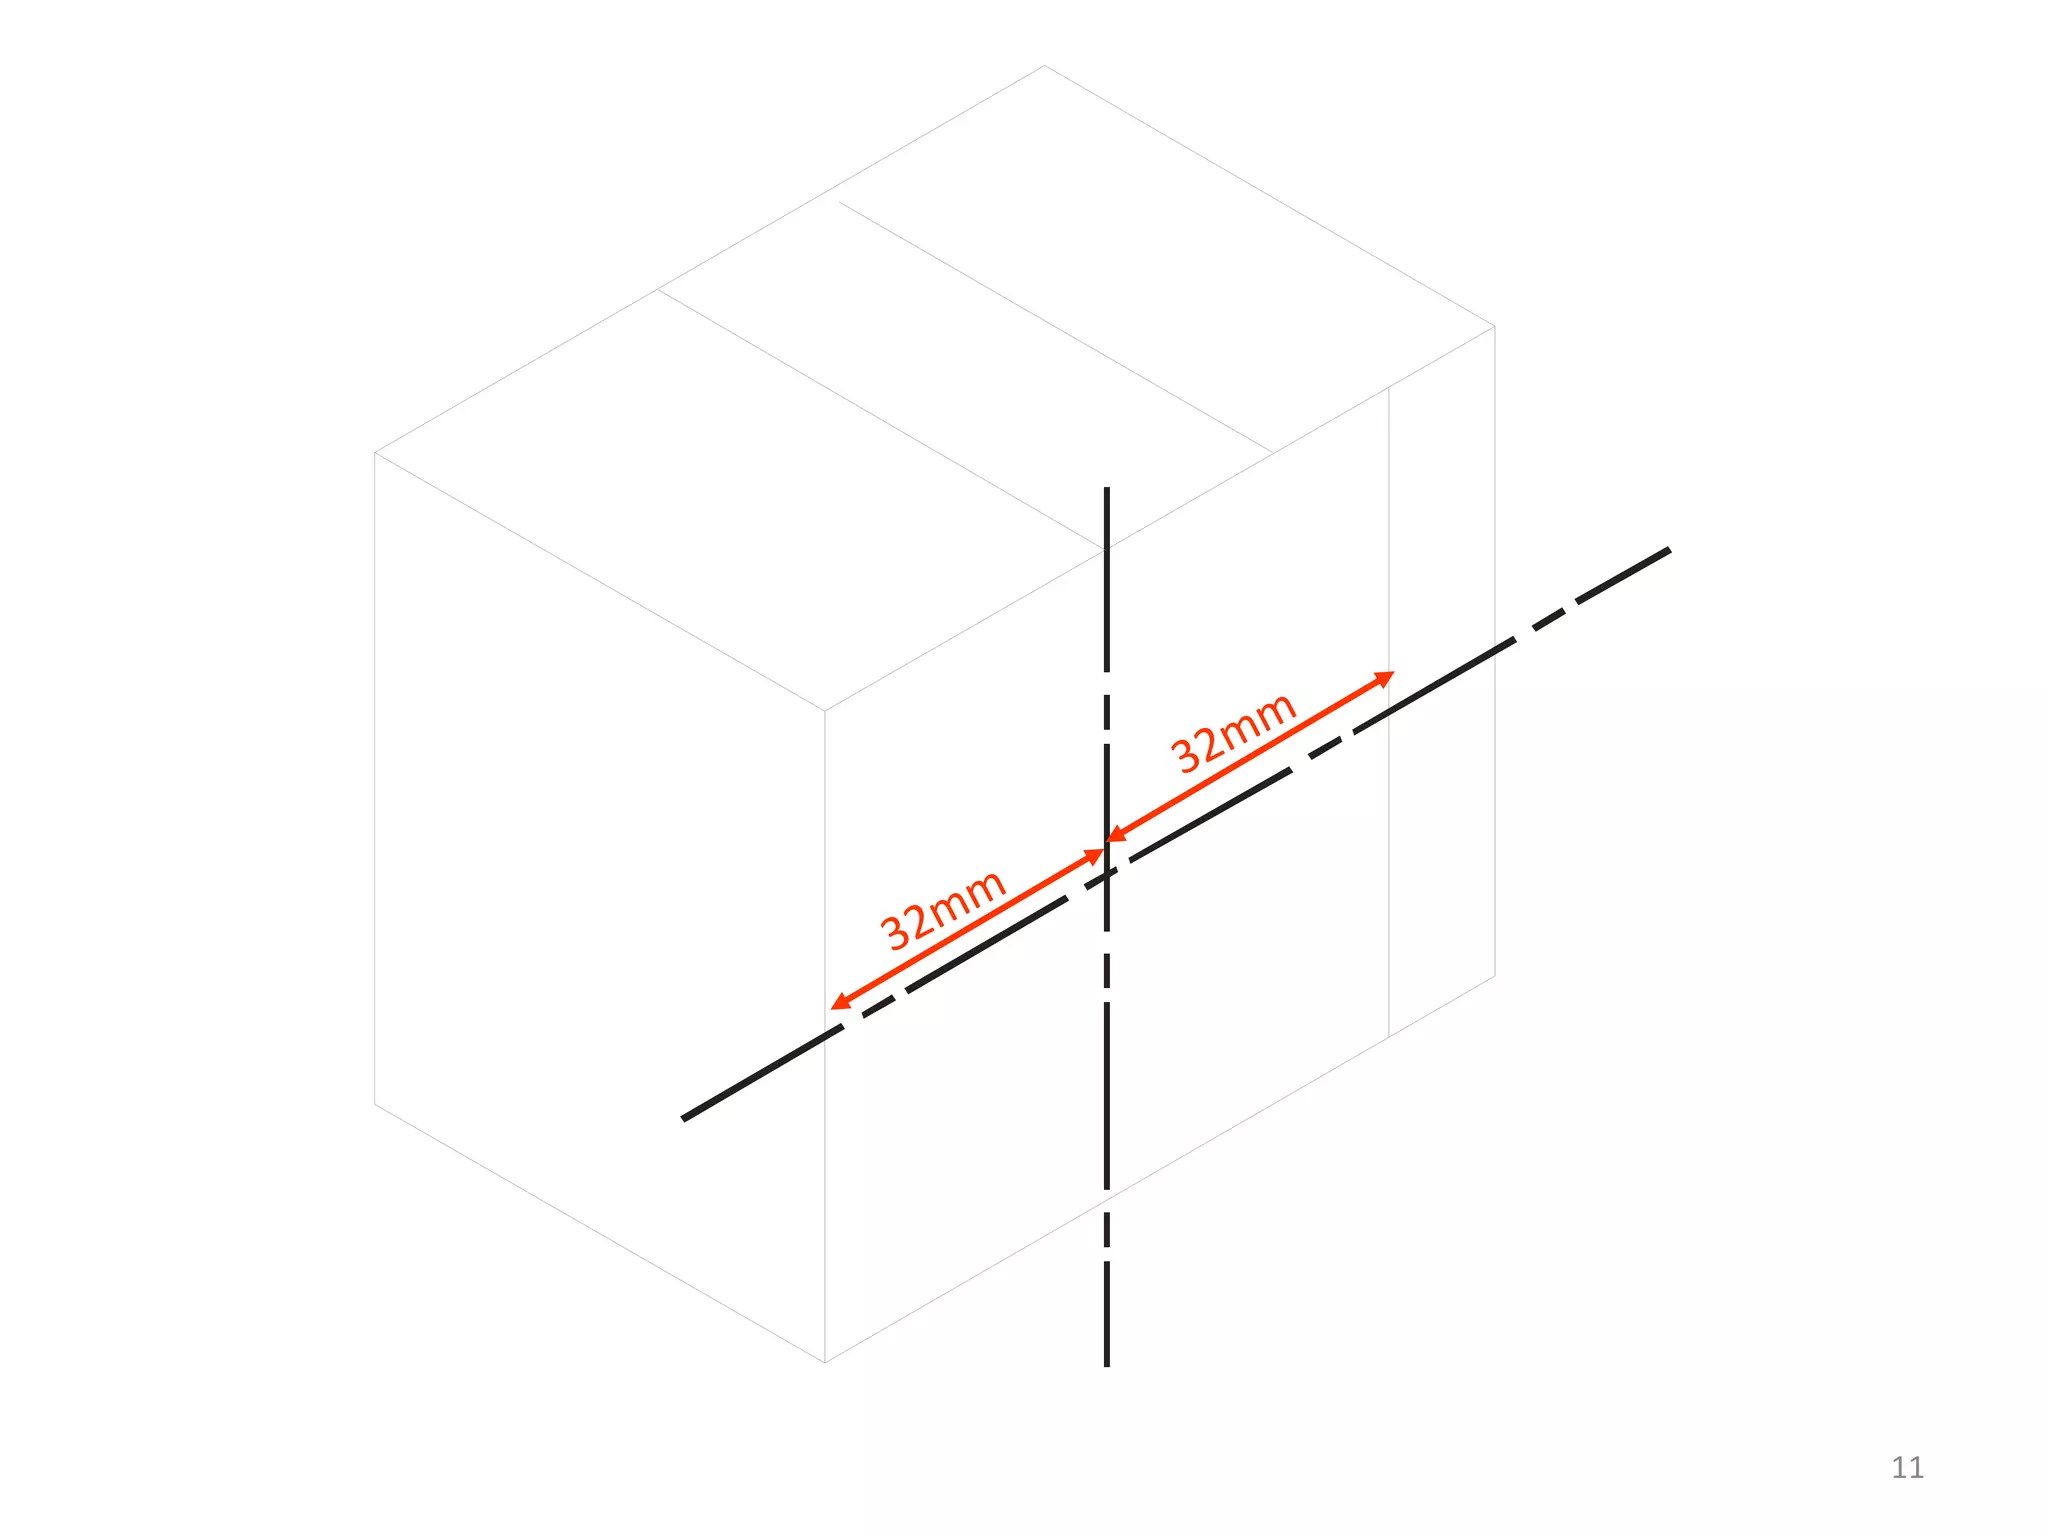
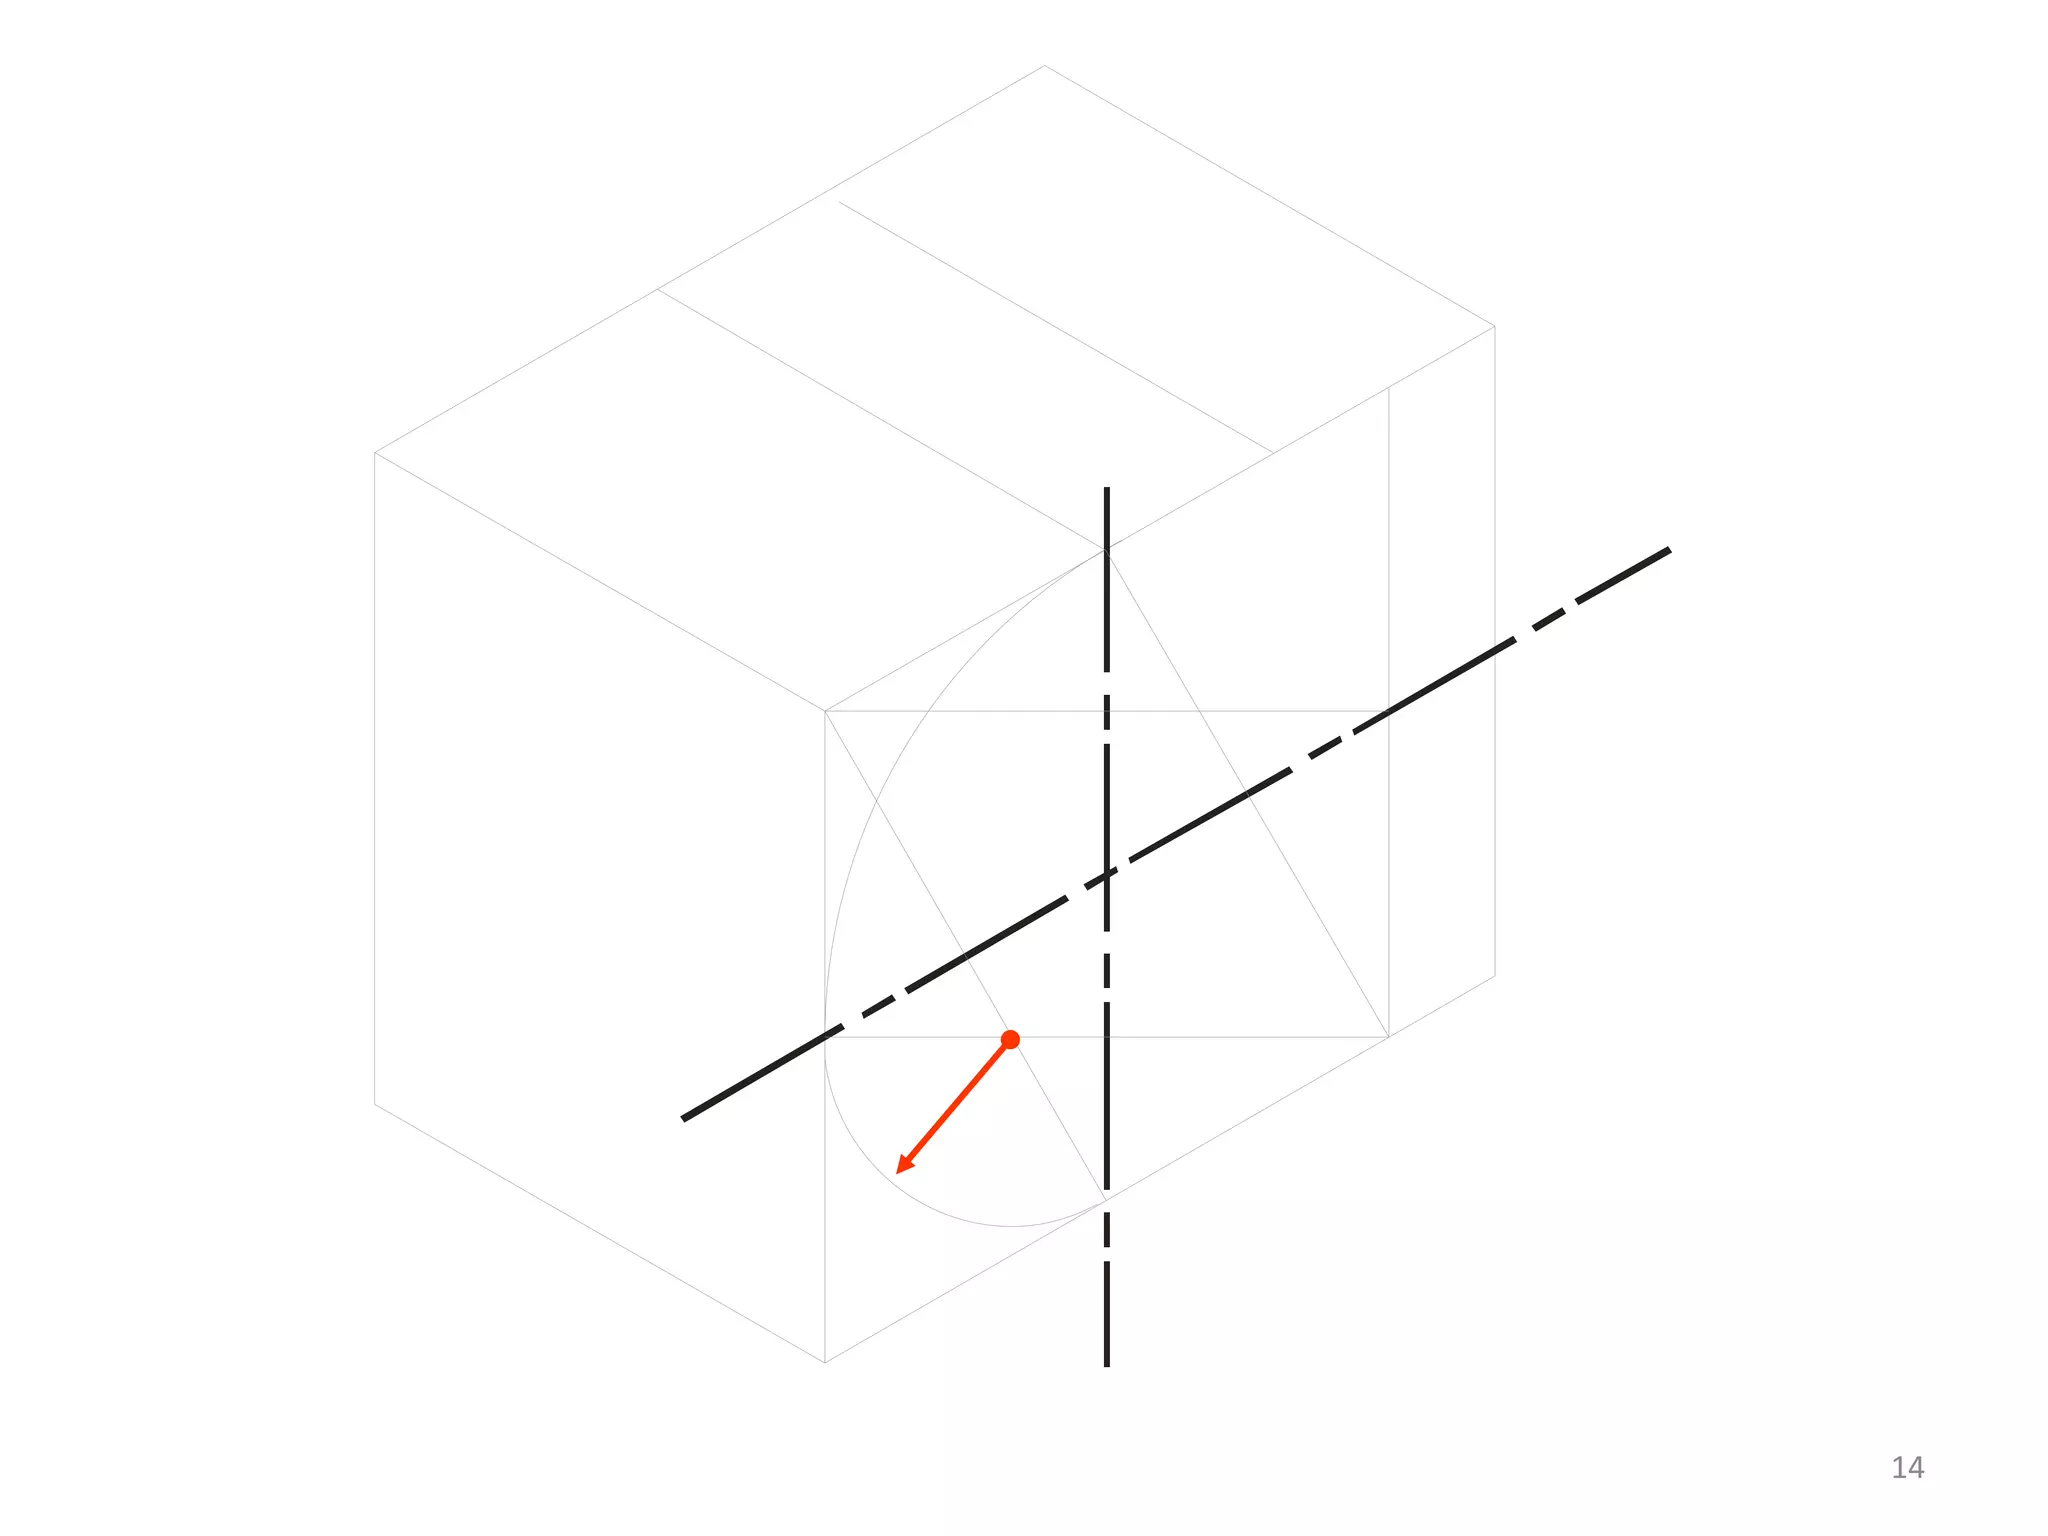
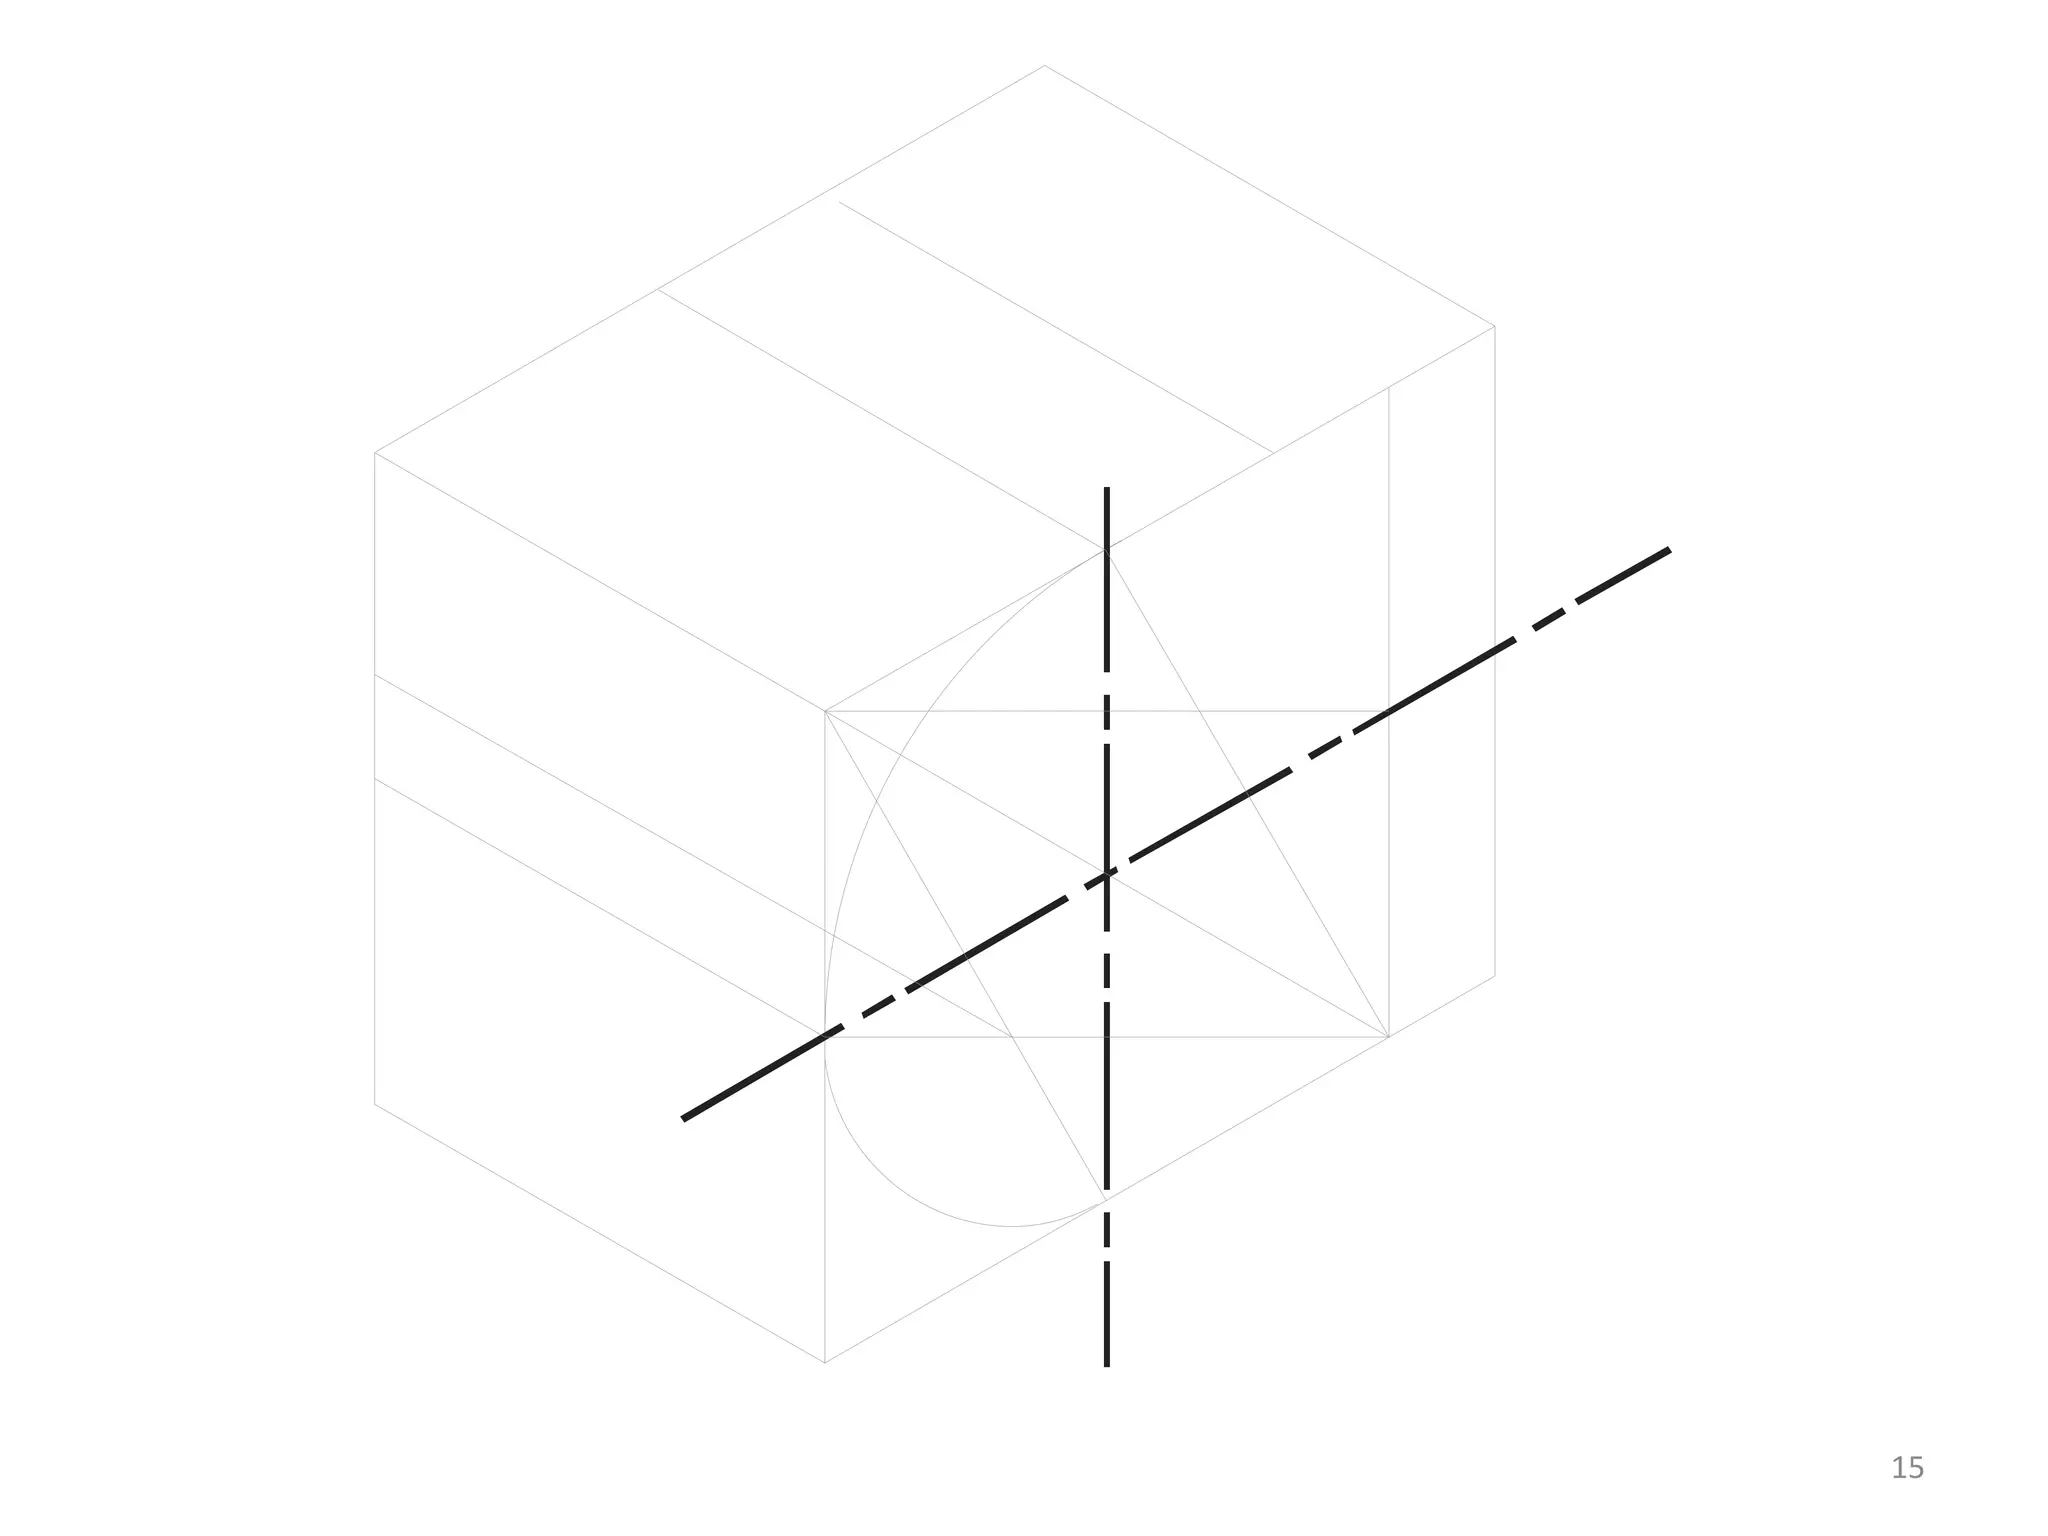
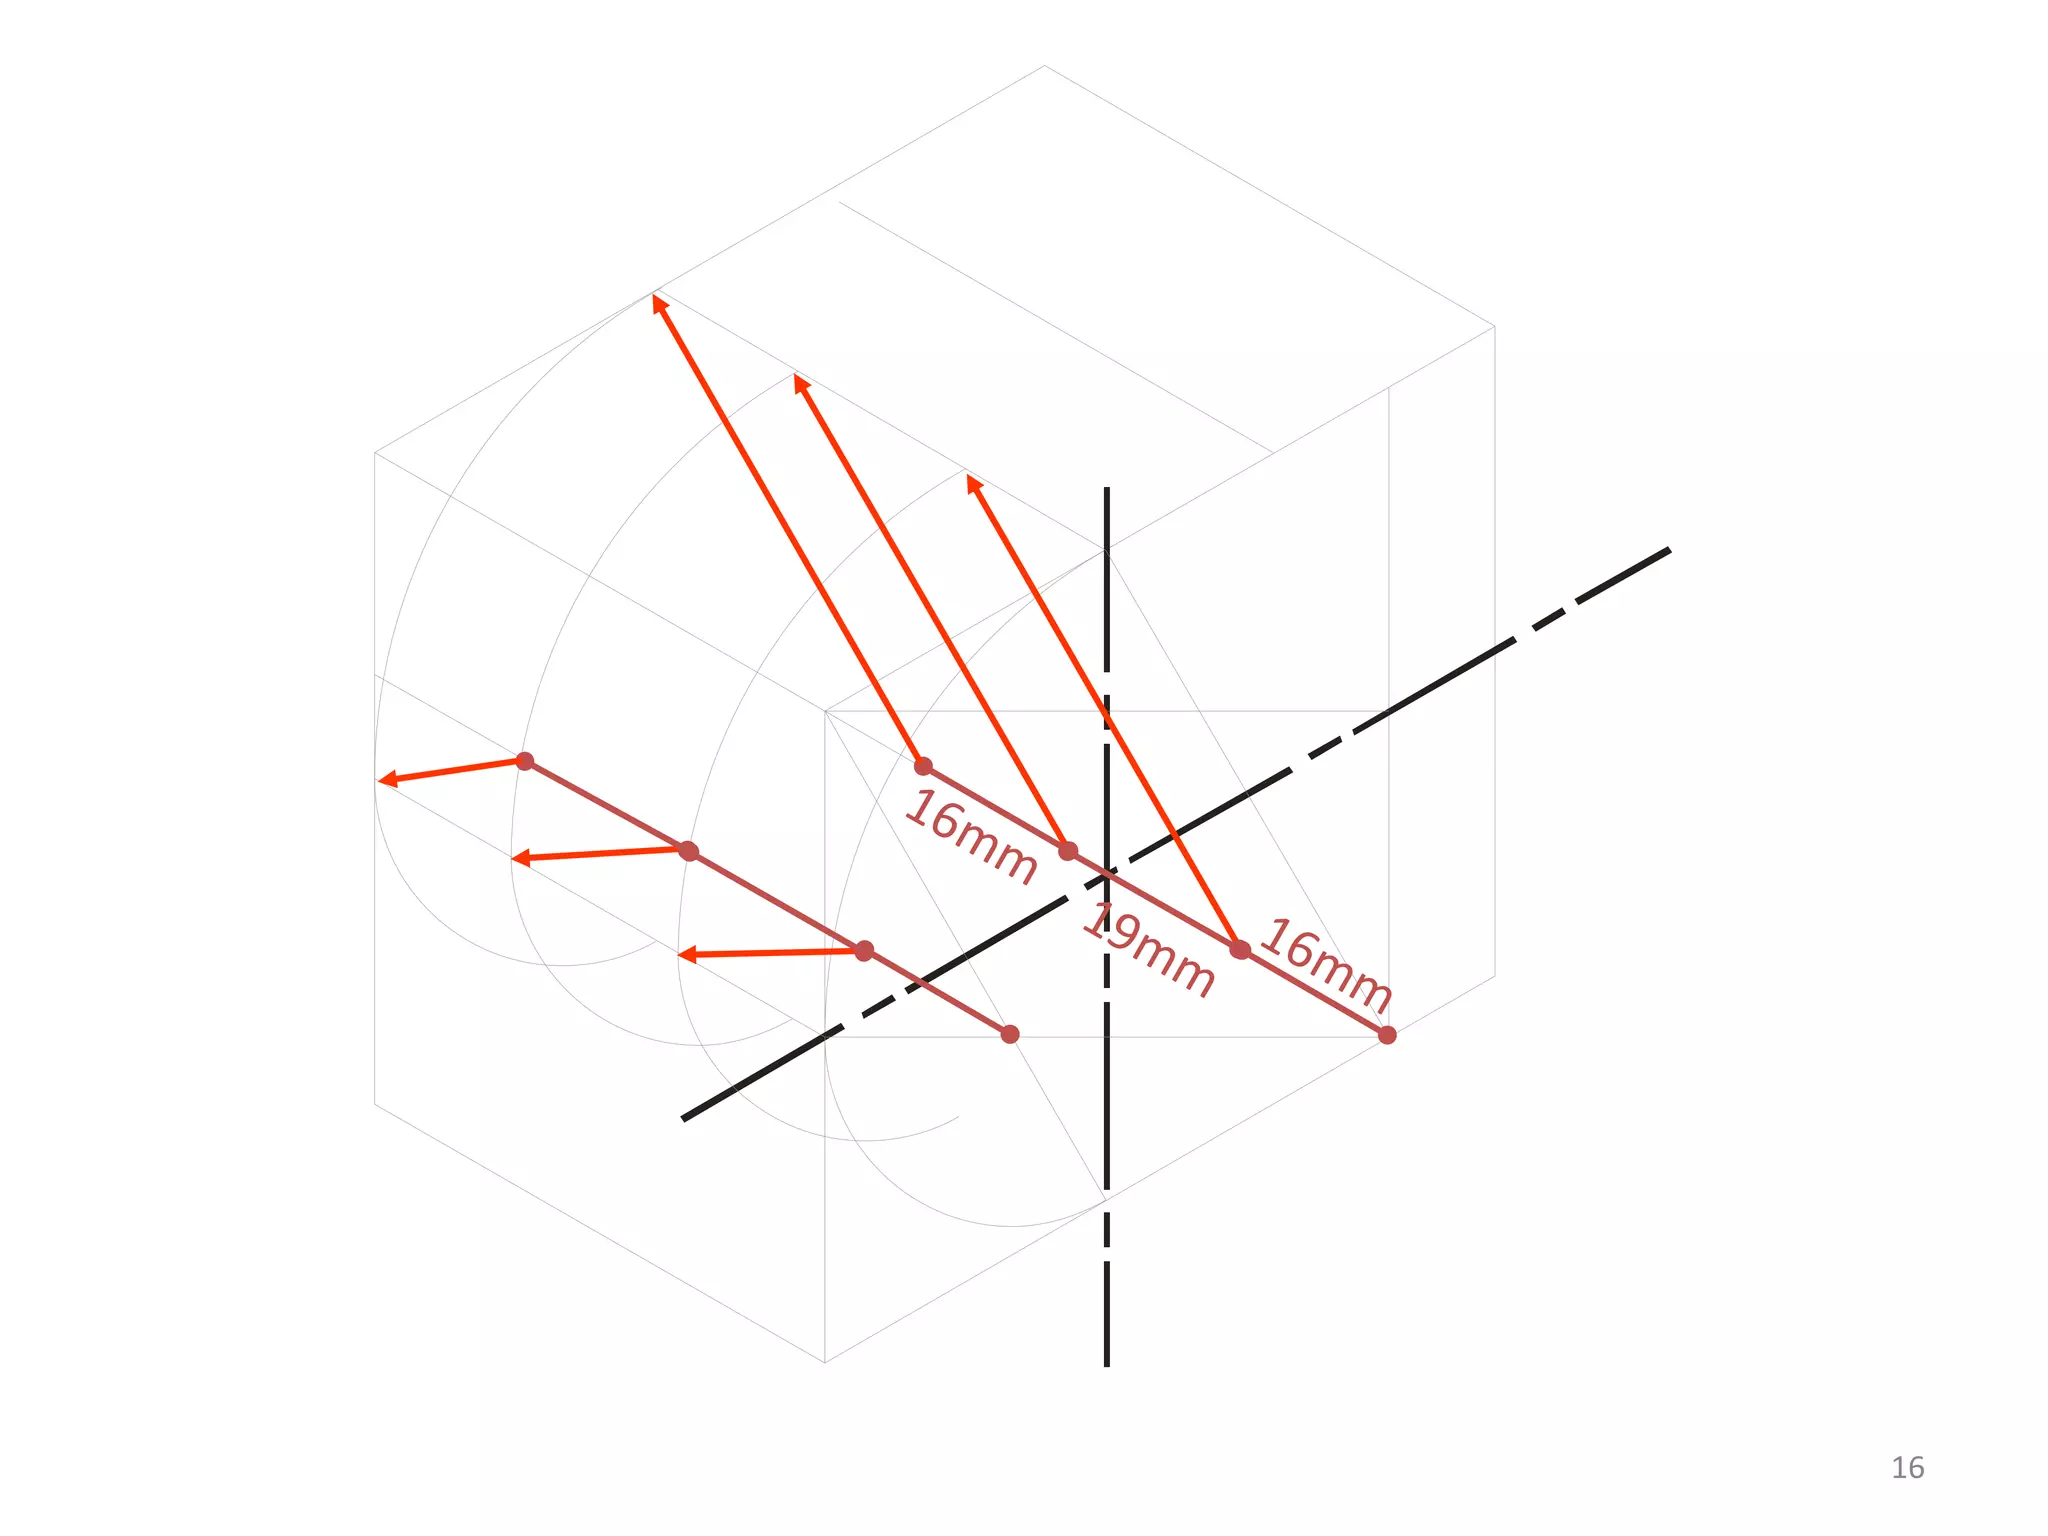
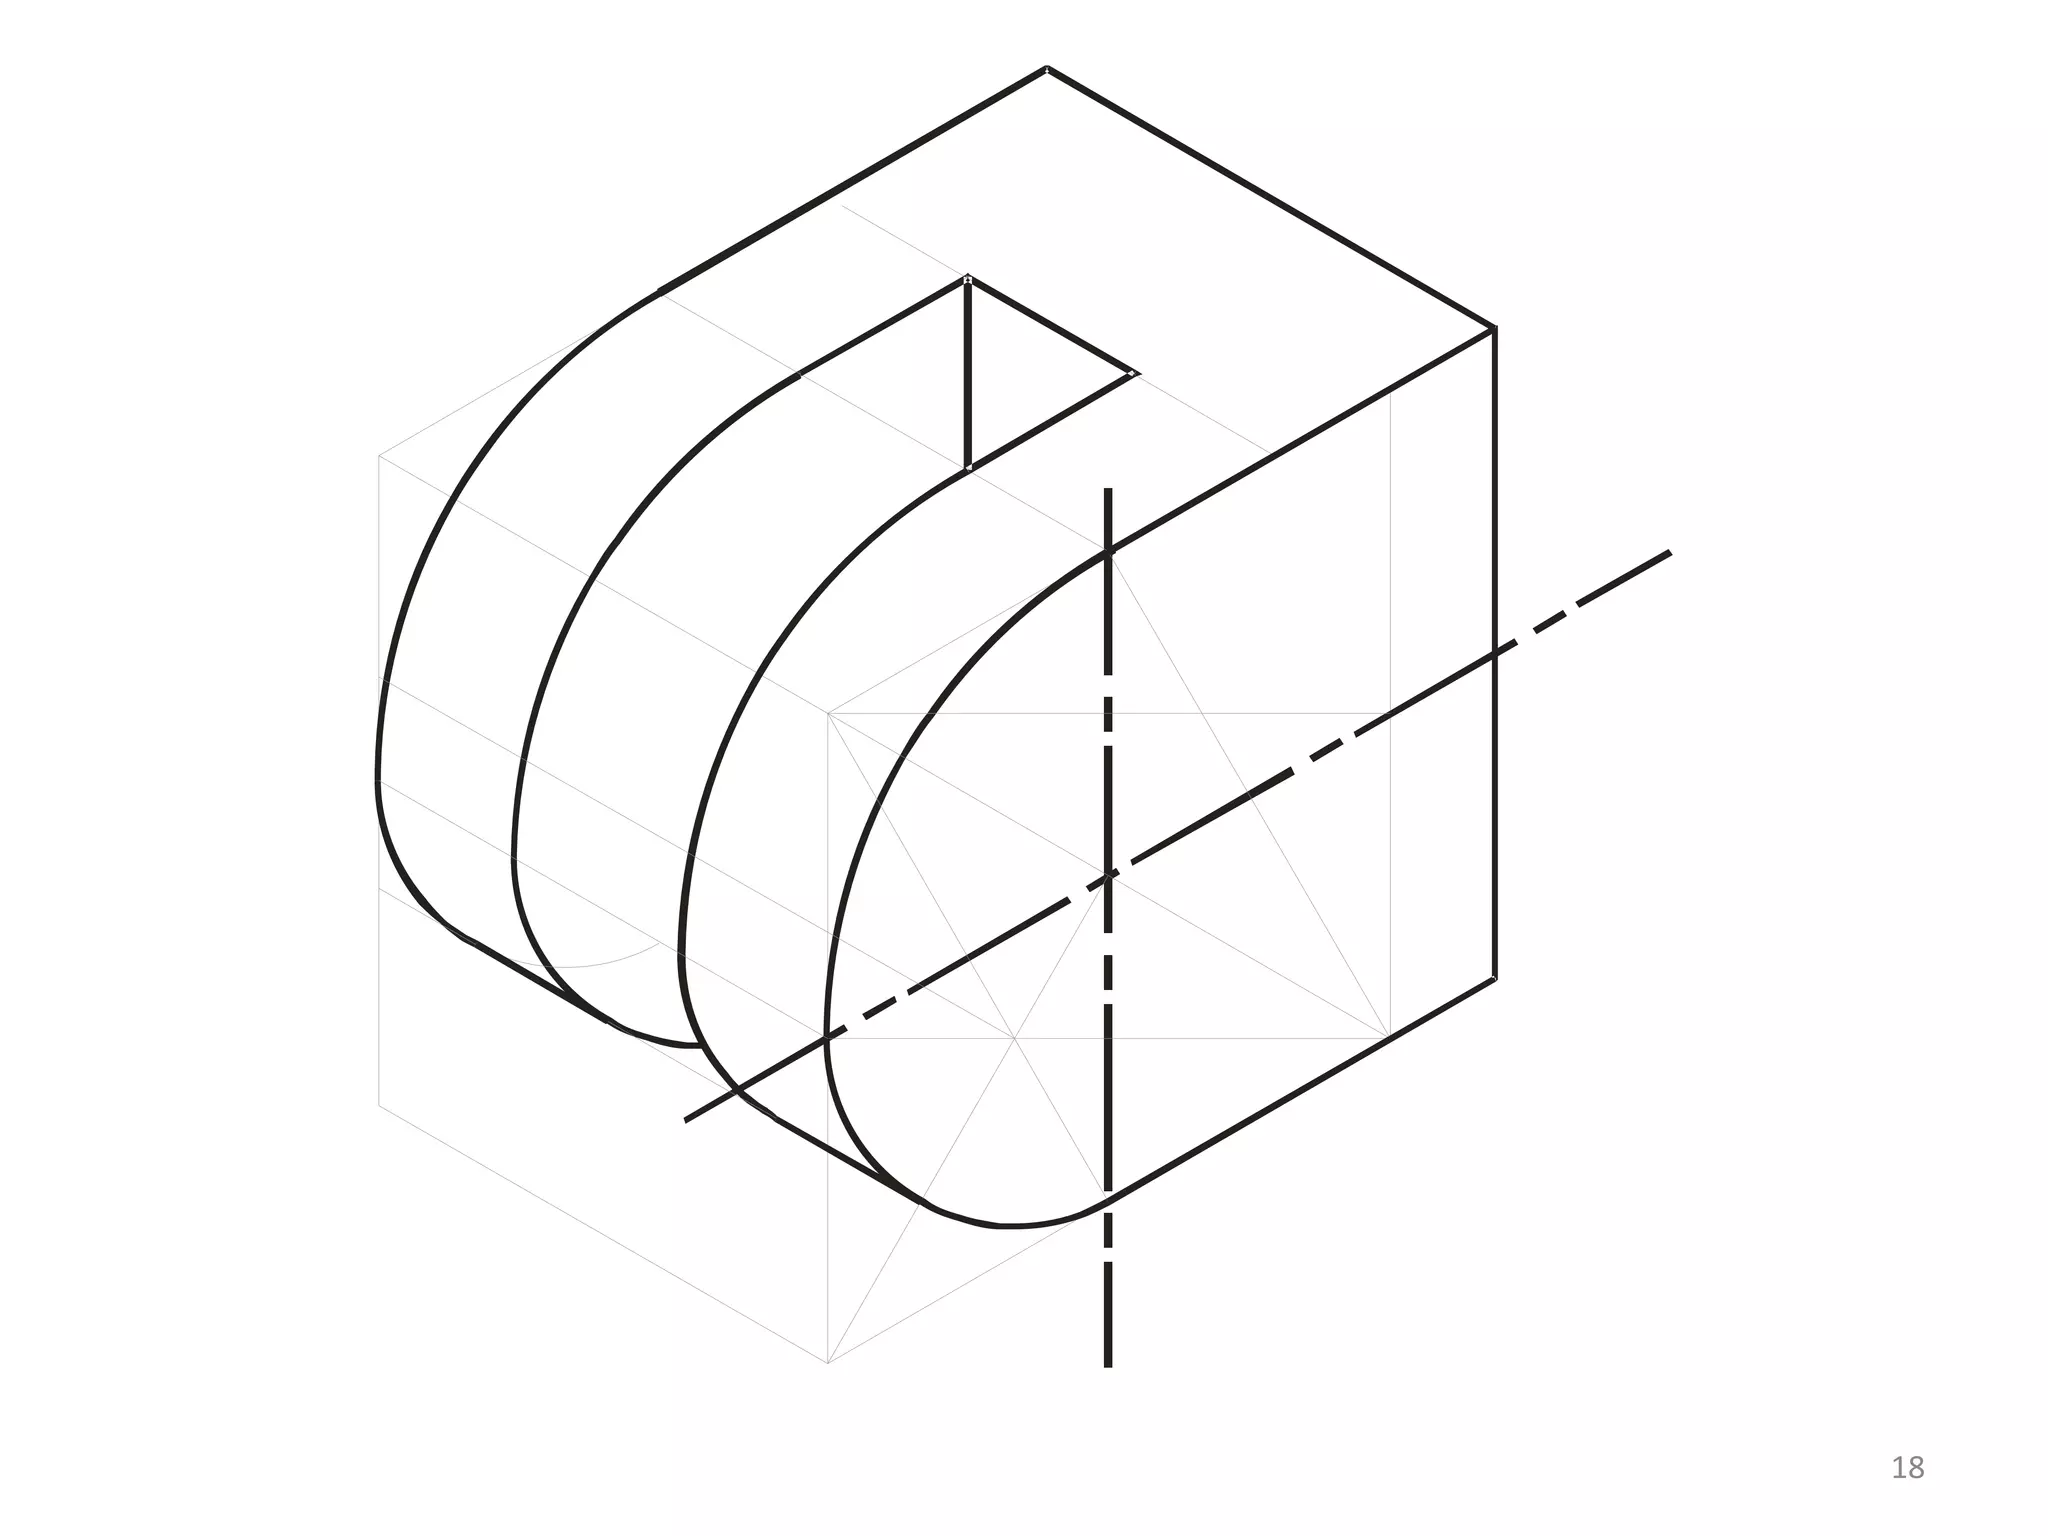
This document contains measurements and dimensions for creating a technical drawing, including measurements of 60mm, 300, 32mm, 25mm, 16mm, and 19mm. The drawing involves creating an isometric circle using these various measurements.
This document discusses involutes and how they relate to gear teeth. It provides the following key points:
1) An involute is a curve traced by a point on a taut cord unwinding from a circle or polygon. It becomes straighter as it unwinds and is straighter for larger base circles.
2) The teeth of gears have the shape of an involute curve. This ensures the relative rotation speeds of mating gears remains constant while engaged, preventing vibration and wear.
3) Steps are provided to draw the involute curve for different basic shapes including a straight line, triangle, square, hexagon, circle, and half circle/hexagon combination.
The document describes how to draw different regular polygons using a compass and circle. A regular polygon has equal sides and angles. Regular hexagons and equilateral triangles can be drawn by marking arcs around a circle at equal intervals and connecting the marks. Regular octagons and squares are drawn by first drawing perpendicular diameters of a circle and then bisecting the angles formed at their intersection. Regular pentagons are constructed by drawing arcs from specific points on a diameter using a compass setting based on other points and lines drawn on the circle.
Basic geometrical constuctions is how to construct angle by using compass and ruler.
this slide can help students or teachers to construct any angles especially for special angles they are 90 degree, 60 degree, 45 degree and 30 degree.
Here is a 1:4 scale constructed to measure up to 5 decimeters:
[DIAGRAM]
A line 12.5 cm long is divided into 5 equal divisions, with each division representing 1 decimeter. The first division is further divided into 10 equal sub-divisions, with each sub-division representing 1 centimeter. Numbers 0, 1, 2, 3, 4 are marked to the right of the divisions to indicate decimeters. "cm" is marked to the left of 0 to label the centimeter sub-divisions. "1:4" is written below to indicate the representative fraction.
The document describes various techniques for technical drawing, including copying segments and angles, bisecting segments and angles, and different types of projection. It discusses orthographic projection, which uses parallel lines of sight perpendicular to the projection plane to represent 3D objects in 2D views. Multiview projection shows the object through multiple views, while axonometric projection shows three dimensions in a single view, though with some distortion of angles and sizes. Hidden and center lines are also covered.
This document contains a detailed lesson plan for teaching students about the mean of grouped data. It includes the objectives, which are to state the formula for finding the mean of grouped data, find the mean of grouped data, and solve problems involving the mean of grouped data. The lesson plan outlines the procedures the teacher will follow, which includes introducing the topic, discussing the concept and formula for finding the mean of grouped data, working through examples, and having students practice calculating the mean of grouped data sets through exercises. The lesson aims to help students understand how to calculate the mean when data is grouped into intervals with frequencies rather than having individual data points.
This lecture contains the detail of isometric projections of an object. This will improve your skills to draw isometric views which is the major part of engineering drawings.
1. The document defines axonometric and oblique projections, and explains the differences between isometric projections, drawings, and axes.
2. It provides steps for sketching in isometric views from both actual objects and multi-view drawings, including positioning axes and enclosing shapes before adding details.
3. Guidelines are given for orienting complex object features and determining which orientations are better for oblique sketching.
The document provides instructions for drawing an isometric square with each side equal to the diameter of a circle. It explains how to draw the horizontal and vertical center lines of the square and its diagonals. It then gives directions to draw construction lines from two corners to the midpoint of another side, and to use the intersections as centers to draw arcs with a compass to complete the four corners of the isometric square.
This document defines terminology used in isometric projection drawings. It discusses isometric axes, lines, planes, scales, and views. It then provides examples of how to construct isometric views of common 3D shapes like squares, rectangles, triangles, pentagons, hexagons, circles, prisms, pyramids, cones, cylinders, and spheres. Key steps include enclosing shapes in rectangles or squares, using isometric scales, and constructing shapes made of lines parallel or perpendicular to isometric axes.
The document discusses scales used in maps, models, plans and drawings. It explains that a scale is a ratio that compares the size of an object to its representation. It provides examples of different scales using ratios such as 1cm = 2cm at a scale of 1:2, 1cm = 3cm at a scale of 1:3, and 5cm = 1cm at a scale of 5:1. It concludes by instructing the reader to practice scaling images using the Keynote app on their device.
This document provides information on isometric projections and isometric drawing techniques. It discusses how isometric projections allow three faces of an object to be viewed at once by pivoting the object 45 degrees. It also describes how isometric drawings are created using a "box construction" method where measurement lines are drawn at 30 degree angles to form an outline box for the object. The stages of isometric drawing are outlined as sketching the box, measuring details, and final layout. Methods for drawing non-isometric lines, circles, and rounded objects in isometric perspective are also summarized.
The document describes two curves - a cycloid and an involute. A cycloid is the curve traced by a point on the edge of a rolling circle. It provides an example of a coin rolling on a table, tracing out a cycloid path. An involute is the curve traced by one end of a taut string unwinding from a circle. It provides an example of coir unwinding from a drum through 360 degrees, tracing out an involute curve.
This document provides information about constructing different types of polygons and solving problems involving polygons. It defines triangles, quadrilaterals, and regular polygons. It discusses classifying triangles by angles and sides. It describes different types of quadrilaterals including parallelograms, rectangles, squares, trapezoids, isosceles trapezoids, and trapeziums. The document provides step-by-step examples for constructing triangles, squares, rectangles, pentagons, and hexagons. It includes examples of constructing polygons given specific side lengths or included angles. Finally, it provides practice problems for constructing various polygons.
The document discusses perimeter and area. It defines perimeter as the length of all sides of a shape added together and is measured using a ruler. Area is defined as the space inside a shape and is calculated by counting the number of squares that fit inside the shape. The document contains interactive elements to learn about calculating perimeter and area through examples and practice questions.
Introduction to Engineering drawing and GraphicsNUST Stuff
This chapter provides an overview of engineering drawings and their components. It discusses drawing standards, the graphics and word languages used to describe objects, and traditional drawing tools. It also covers topics like line types, lettering, scales, and layout of a drawing sheet. Engineering drawings combine graphics and text to precisely depict the size, shape, and specifications of objects in a standardized way to facilitate understanding between technical teams.
Cross sections are 2D shapes that result when a 3D figure is cut by a plane. The plane can be parallel or perpendicular to the base of the 3D figure. A horizontal cross section of a cone is a circle, while a vertical cross section is a triangle. Both the horizontal and vertical cross sections of a cylinder are circles and rectangles, respectively.
The document discusses various types of technical drawings including axonometric projections, oblique projections, and isometric drawings. It explains the differences between axonometric, oblique, and isometric projections. The key steps for creating isometric sketches from actual objects and multi-view drawings are outlined, including positioning the object, defining axes, adding details, and darkening visible lines. Guidelines for orienting complex objects in isometric sketches are also provided.
Dimensioning, scales, lines and multiple projectionsAkash Patel
Fiction is a form of narrative, one of the four rhetorical modes of discourse. Fiction-writing also has modes for fiction-writing: action, exposition, description, dialogue, summary, and transition (Morrell 2006, p. 127). Author Peter Selgin refers to methods, including action, dialogue, thoughts, summary, scene, and description (Selgin 2007, p. 38). Currently, there is no consensus within the writing community regarding the number and composition of fiction-writing modes and their uses.
Description is the fiction-writing mode for transmitting a mental image of the particulars of a story. Together with dialogue, narration, exposition, and summarization, description is one of the most widely recognized of the fiction-writing modes. As stated in Writing from A to Z, edited by Kirk Polking, description is more than the amassing of details; it is bringing something to life by carefully choosing and arranging words and phrases to produce the desired effect (Polking 1990, p. 106). The most appropriate and effective techniques for presenting description are a matter of ongoing discussion among writers and writing coaches.Fiction is a form of narrative, one of the four rhetorical modes of discourse. Fiction-writing also has modes for fiction-writing: action, exposition, description, dialogue, summary, and transition (Morrell 2006, p. 127). Author Peter Selgin refers to methods, including action, dialogue, thoughts, summary, scene, and description (Selgin 2007, p. 38). Currently, there is no consensus within the writing community regarding the number and composition of fiction-writing modes and their uses.
Description is the fiction-writing mode for transmitting a mental image of the particulars of a story. Together with dialogue, narration, exposition, and summarization, description is one of the most widely recognized of the fiction-w
Basic introduction to Engineering DrawingTariku Dessie
This document is an introduction to basic engineering drawing presented by Tariku D. at Debre Berhan University. It discusses the classification of drawings as either artistic or engineering drawings. Engineering drawings are further divided into freehand sketches, instrument drawings, and computer-aided drawings. The document also covers drawing scales, instruments such as T-squares and protractors, line types including visible, hidden and center lines, and other basics of engineering drawing.
This document discusses the concepts and techniques for creating isometric drawings. Isometric drawings show a 3D object from 3 views - top, front, and side - with all lines drawn at a 30 degree angle from the horizontal. There are different methods for constructing isometric drawings depending on the shape of the object, such as the box method for rectangular objects or frame method for objects with vertices. Circles and curves can also be drawn in isometric views using techniques like locating the center of an ellipse or drawing along coordinates.
The document discusses assembly drawings and isometric views. It explains that assembly drawings show how parts of a product fit together, and can be drawn as fitted assemblies or exploded views. Exploded views separate the parts to show the correct assembly order. The document then provides rules for drawing isometric projections, including that vertical lines stay vertical and horizontal lines incline 30 degrees, all lines are foreshortened, non-isometric lines are drawn using two connecting isometric lines, and hidden edges are typically omitted.
This document provides guidance on freehand sketching techniques for isometric projections and sketches. It discusses sketching lines, arcs, circles, curves, and objects from orthographic views. Key steps include locating centers and tangent points, using construction lines, and extruding 2D shapes to add the third dimension. Parallel lines should remain parallel in isometric views. Complex objects can be sketched by combining simple shapes or adding details gradually to the main form.
Computer Aided Drawing sheets for using the commands of AutoCAD Software.
The sheets for beginners , who want to learn the commands of AutoCAD software .
After finishing those sheets , you will feel confident in using AutoCAD in general.
Download the original presentation for animation and clear understanding. This Presentation describes the concepts of Engineering Drawing of VTU Syllabus. However same can also be used for learning drawing concepts. Please write to me for suggestions and criticisms here: hareeshang@gmail.com or visit this website for more details: www.hareeshang.wikifoundry.com.
This document discusses isometric projection and how to draw isometric views of objects. It explains that isometric projection shows all three dimensions of an object using three intersecting axes at 120 degree angles. True dimensions are used for isometric views of single solids, while isometric projections of combinations of solids use compressed isometric dimensions. Common techniques for drawing isometric views, like the box method and 4-center method for circles, are described. Several step-by-step examples demonstrate how to apply these techniques to draw isometric views of prisms, cylinders, and cut pyramids. Tips are provided on what details to include or omit in isometric drawings.
The document provides instructions for drawing 13 isometric views of differently shaped blocks. For each block, three orthographic views are shown in figures 1 through 13 and directions are given to draw a full size isometric view of the block in the direction of the arrows shown, with a grid size of 10 mm x 10 mm and without showing hidden details.
1. The document describes various solids and their classification into two groups - Group A consisting of solids with bases and tops of the same shape, and Group B consisting of solids with bases of some shape and just a point as the top.
2. Dimensional parameters of different solids like cylinders, cones, prisms and pyramids are defined. Positions of solids relative to planes are also described.
3. Three step methods for solving problems involving solids inclined to horizontal and vertical planes are outlined. Various categories of illustrated problems involving different cases are listed.
Lecture 3 A Isometric And Orthographic Sketching 2009nttf
The document discusses isometric and orthographic sketching techniques used in engineering design. It compares engineering drawings to sketches and explains that sketches are used in early conceptual design while drawings are for final production. Various methods for sketching objects in isometric and orthographic views are presented, including unfolding 3D objects, transferring between views using construction lines, and ordering of drawing different object surfaces. Students are assigned to practice these techniques by sketching a cell phone in isometric and orthographic views.
i have created my own ppt on the topic name Isometric Projection.its a topic which is in engg. graphics book.
plzz download and give reviews abt that ppt.
Steps in constructing an isometric drawingRodolfo Aquino
The document outlines the 7 steps to construct an isometric drawing: 1) Draw the three axes at 30 degrees, 2) Plot the principal dimensions of Height, Width, and Depth, 3) Draw the outer lines of the object lightly, 4) Add the internal details by analyzing points, 5) Check the accuracy, 6) Trace visible edges with darker lines, 7) Label the drawing. It also lists 4 key points to remember like keeping axes equally spaced at 120 degrees and using light lines initially.
An isometric drawing is a type of technical drawing that shows an object with equal measures on three axes at 30 degree angles to give the impression of three-dimensions on a two-dimensional plane. It is constructed using a horizontal line intersected perpendicularly by a vertical axis, with two additional axes at 30 degrees to the left and right that allow lengths to be marked off and connected in a way that suggests depth.
Download the original presentation for animation and clear understanding. This Presentation describes the concepts of Engineering Drawing of VTU Syllabus. However same can also be used for learning drawing concepts. Please write to me for suggestions and criticisms here: hareeshang@gmail.com or visit this website for more details: www.hareeshang.wikifoundry.com.
The document contains instructions and examples for 14 exercises related to orthographic projection. The exercises include identifying views of objects from different angles, matching orthographic drawings to isometric or oblique views, sketching projections of objects, and drawing multi-view orthographic projections of components with dimensions. Solutions or spaces for solutions are provided for each exercise.
Isometric projections for engineering studentsAkshay Darji
The document discusses isometric projections and isometric drawing. It begins by explaining the limitations of orthographic views and how isometric projections show all three dimensions of an object in a single view. It then defines the principles and types of projection, including orthographic, pictorial, axonometric, isometric, dimetric and trimetric. The remainder of the document focuses specifically on isometric projection, defining isometric axes, lines, planes and drawings. It provides examples of how to construct isometric views of various objects from their orthographic projections.
The document discusses concepts related to automatic control systems including open loop and closed loop systems. It covers topics such as feedback, controllers like proportional, integral and proportional integral differential controllers. It also provides examples of automatic control systems used in various industries and applications. The document consists of lecture slides on control systems for a class.
Download link: https://www.researchgate.net/publication/318852873_Engineering_Drawing_-_I
DOI: 10.13140/RG.2.2.22512.56328
An engineering drawing is a type of technical drawing, used to fully and clearly define requirements for engineered items, and is usually created in accordance with standardized conventions for layout, nomenclature, interpretation, appearance size, etc.
Its purpose is to accurately and unambiguously capture all the geometric features of a product or a component. The end goal of an engineering drawing is to convey all the required information that will allow a manufacturer to produce that component.