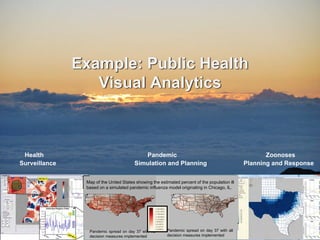
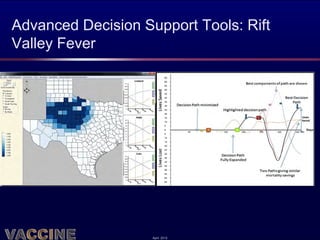
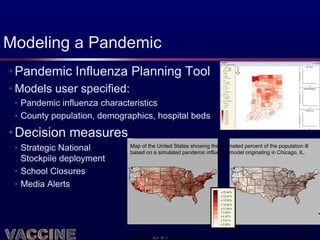
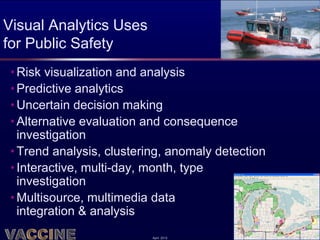
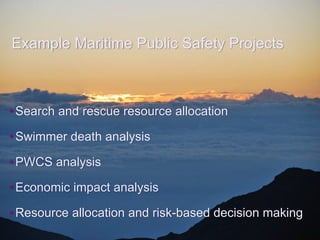
The document discusses visual analytics solutions developed by the VACCINE Center to address challenges in public health, maritime safety, public safety, and resource allocation. It provides examples of visual analytics tools developed for pandemic modeling and response, syndromic surveillance, maritime search and rescue analysis, hazardous materials planning, and large scale evacuation modeling. The solutions leverage interactive visualizations, predictive analytics, and multi-source data integration to enable effective decision making.
Selected Summit Sponsors and Partners showcase their most promising brain health & enhancement initiatives and solutions.
8.30-10am. At the frontier with Neuroscape, VR/ AR and Photobiomodulation
*Adam Gazzaley, UCSF Professor of Neurology, presents Neuroscape
*Dr. Walter Greenleaf, Medical VR/ AR Expert at Stanford Virtual Human Interaction Lab, provides an overview of health applications of virtual & augmented reality (VR/AR)
*Dr. Lew Lim, Founder & CEO of Vielight, discusses photobiomodulation as a new way to enhance brain function
contact information.
10.30-11am. Dr. Bob Schafer, Director of Research at Lumos Labs, presents their expanding vision for brain training, including mindfulness.
*Álvaro Fernández, CEO and Editor-in-Chief of SharpBrains
*Sarah Lenz Lock, Senior Vice President for Policy at AARP and Executive Director of the Global Council on Brain Health (GCBH)
*Dr. April Benasich, Director of the Baby Lab at the Rutgers Center for Molecular and Behavioral Neuroscience
*Chaired by: Dr. Cori Lathan, Co-Chair of the World Economic Forum’s Council on the Future of Human Enhancement
Slidedeck supporting session held during the 2017 SharpBrains Virtual Summit: Brain Health & Enhancement in the Digital Age (December 5-7th). Learn more at: https://sharpbrains.com/summit-2017/
Information is the principle driver of competitive advantage. How it is collected, analysed and communicated determines our success. No single resource is more critical to organisational survival.
The amount of data in the world is exponentially increasing, to a point where companies capture significant amounts of information about their customers, suppliers, and operations. Millions of networked sensors are being embedded in everything from mobile phones to cars. Social networks and location data from mobile devices will continue to fuel this exponential data growth. These huge data pools are commonly being referred to as "big data".
This talk examines how analytics and big data are exploiting information to drive competitive advantage.
Confronting Reality with Big Data & Learning Analytics
We are experiencing an explosion in the quantity of data available online from archives and live streams. Learning Analytics is concerned with how educational research, and learning platform design, can make more effective use of such data (Long & Siemens, 2011). Improving outcomes through the analysis of data is of interest to researchers, administrators, systems architects, social media developers, educators and learners. Analytics are being held up by some as a way to confront, and tackle, the tough new realities of less money, less attention, and higher accountability for quality of learning.
Researchers and vendors are building reporting capabilities into tools that provide unprecedented levels of data on learners. This symposium will show what is possible, and what's coming soon. What objections could possibly be raised to such progress?
However, information infrastructure embodies and shapes worldviews: classification schemes are not only systematic ways to capture and preserve, but also to forget, by virtue of what remains invisible (Bowker & Star, 1999). Learning analytics and recommendation engines are designed with a particular conception of ‘success’, driving the patterns deemed to be evidence of progress, the interventions that are deemed appropriate, the data captured and the rules that fire in software.
This symposium will air some of the critical arguments around the limits of decontextualised data and automated analytics, which often appear reductionist in nature, failing to illuminate higher order learning. There are complex ethical issues around data fusion, and it is not clear to what extent learners are empowered, in contrast to being merely the objects of tracking technology. Educators may also find themselves at the receiving end of a new battery of institutional ‘performance indicators’ that do not reflect what they consider to be authentic learning and teaching.
This Symposium will provide the opportunity to hear a series of brief presentations introducing contrasting perspectives, before the debate is opened to all. Speakers from a cross-section of The Open University will describe how we are connecting datasets, analysing student data and prototyping next generation analytics. Complementing this, JISC will present a national capability perspective, with an update on the JISC CETIS ‘landscape analysis’ of the field, which will clarify potential benefits, issues to consider, and help institutions to assess their current capability and possible next steps.
Participants will catch up with developments in this fast moving field, through exposure to the possibilities of analytics, as well as issues to be alert to.
How can we harness digital technologies and artificial intelligence (AI) to s...SharpBrains
*Dr. Oliver Harrison. Chief Executive of the Health Moonshot at Telefónica Innovation
*Nancy Briefs, President and CEO of Digital Cognition Technologies
*Emma Yang, 9th grader, Creator of Timeless app and MIT Solver
*Belén Guerra-Carrillo, NSF Fellow and graduate student researcher at University of Califonia, Berkeley
*Chaired by: Kayt Sukel, science writer
*Álvaro Fernández, CEO and Editor-in-Chief of SharpBrains
*Sarah Lenz Lock, Senior Vice President for Policy at AARP and Executive Director of the Global Council on Brain Health (GCBH)
*Dr. April Benasich, Director of the Baby Lab at the Rutgers Center for Molecular and Behavioral Neuroscience
*Chaired by: Dr. Cori Lathan, Co-Chair of the World Economic Forum’s Council on the Future of Human Enhancement
Slidedeck supporting session held during the 2017 SharpBrains Virtual Summit: Brain Health & Enhancement in the Digital Age (December 5-7th). Learn more at: https://sharpbrains.com/summit-2017/
The Health Equity and Accountability Act of 2011 (HEAA) is a bill introduced by the Congressional Tri-Caucus to eliminate health disparities among racial and ethnic groups. An advocacy group called the Community Working Group meets weekly to discuss strategies to update and pass the HEAA in the 112th Congress. They analyze how the HEAA complements the Affordable Care Act and conduct outreach to build support for the bill. The HEAA aims to strengthen existing laws and policies to reduce health inequities faced by communities of color.
The document discusses Canada's Multi-Agency Situational Awareness System (MASAS), which aims to simplify information sharing between emergency response agencies by providing a single system to share incident information in real-time, rather than through separate communication channels. MASAS uses an open architecture and standards to allow various response tools and agencies to share information on a common operating picture in order to improve coordination and response times. The system has gained recognition in Canada as a national priority for public safety and has expanded to include over 225 agencies and organizations.
Este documento proporciona instrucciones para crear un virus informático. Describe cómo insertar código malicioso en archivos y sitios web populares para infectar a otros usuarios. Además, recomienda distribuir el virus a través de foros en línea y sitios de wikis populares para maximizar su propagación.
The document outlines a plan for a leadership training organized by Muhayyo Satvoldieva for girls at the #69 Aitmatov School in Kyrgyzstan on April 10, 2012. The goal of the training was to show girls they could also become leaders. The plan was to invite talented girls and invite the school psychologist to help prepare girls to become future social leaders. The training would discuss what it means to be a leader and encourage the girls that they can be leaders too. The organizer hoped the training would help more women become leaders in Kyrgyzstan in the future.
The document discusses the Software Sustainability Institute's community engagement efforts, including its Agents/Super Pals program and Fellows program. It recruits early-career and mid-career researchers to gather intelligence, run workshops, and provide feedback. The Fellows program has grown from 10 Agents in 2011 to 15 Fellows in 2013 across various research domains. The goals are to effectively serve the research community, maximize the Institute's impact, and promote awareness of software sustainability best practices.
AFHCAN provides telehealth solutions to remote Alaskan communities through a network of 235 sites belonging to 39 health organizations. It started as a federally funded project in 1998 to address the challenges of delivering healthcare across Alaska's vast, sparsely populated territory. AFHCAN has deployed hardware and software to all sites, and helped connect organizations to telecommunications. It has established clinical programs in specialties like cardiology, psychology and dentistry. AFHCAN also provides training, and has expanded its educational offerings through a partnership with the University of Alaska. The network has grown significantly since 2001 and facilitates hundreds of thousands of telehealth encounters each year.
The document summarizes UNC's defense research and development programs that support the military. It discusses degree programs, short courses, internships and fellowships aligned with military needs. It also describes the UNC Defense Applications Group, which is a multi-disciplinary group of faculty that work on applied research challenges for the military. Finally, it lists UNC's core capabilities for military applications such as medical research, human performance, materials science and autonomous systems.
Improving Access to Research Data: What does changing legislation mean for y...Marieke Guy
Presentation given at Bett: Technology in Higher Education Conference, Jan 30 - 31
http://www.bettshow.com/Default.aspx?nid=15&refer=17&id=mainLnk2&id1=ssubLnk8
Uber Operations is a data integration company founded in 2004 and headquartered in Tallahassee, Florida. They focus on data integration and information exchange to solve challenges around disparate data sources and secure data transport. Their mission is to strategically apply resources to guarantee client success by integrating the world's data. They have expertise in various integration technologies and provide services to both public and private sector healthcare organizations.
The webinar explores some of the current opportunities for AI within Life Science and look ahead to what we can expect to see over the coming years. These are the accompanying slides.
This document provides an overview and outline for a professional development short course on exploring data through accessing, understanding, and visualizing data to gain insight. The course will be taught by instructors Ted Meyer and Dr. Brand Fortner and cover topics such as the purposes of visualization, basic concepts of visual perception, processes for creating effective visualizations, and using visualization tools and standards.
Scholar Plot –
Scalable Data Visualization Methods for Academic Careers
Kyeongan (Karl) Kwon
PhD Dissertation
Department of Computer Science
University of Houston
Monday July 18, 2016
Abstract
In this dissertation, I have developed scalable data visualization methods to depict a scholar's accomplishments at a glance. The evaluation of scholarly achievements in academia is largely based on the researcher's publication record. This record is communicated in exhaustive detail in the researcher's curriculum vitae (CV) or in summary via her/his h-index. The h-index, although a convenient abstraction, does not consider neither the time of the publication nor the impact factor (IF) of the journal where it appeared. I present a novel method that visually complements the h-index, revealing at a glance the nature of a researcher's scholastic record. This method (which includes the visualizations Scholar Plot and Academic Garden) is particularly appropriate for web interfaces, as it produces information that is compact and simple, yet highly illuminating.
Scholar Plot uses Google Scholar, Impact Factor, and NSF/NIH/NASA funding data to create a temporal representation of a researcher's publication/funding record that blends publication prestige with paper popularity and funding information. Scholar Plot affords an insightful appraisal of academics at one's fingertips. Academic Garden applies to individual academics, departments, colleges, and any other academic group thereof, such as a research lab or a project team. Academic Garden uses the flower metaphor to visually articulate performance of academic entities. The width of the flower's stem is commensurate to the academic funding the entity received (`juice conduit'). The height of the flower's stem is commensurate to the impact of the entity's intellectual products (`visibility'). The diameter of the flower's disc is commensurate to the prestige of the venues where these products appeared (`fancy factor'). Scholar Plot and Academic Garden bring clarity, transparency, and fairness in hiring, promotion, tenure, and funding decisions.
For the validation of the Academic Garden, I ran data analysis using Endowed Chaired Faculty, a prestigious honor in the United States, for the top 10 universities according to the US News Report 2015. The analysis demonstrated that chaired faculty can be predicted using the 3 merit criteria of citations, impact factor, and funding.
Citizen science at informal science education institutions workshop slidesCitizenScience.org
Citizen science programs have the potential to increase participants' knowledge of science content and processes, engagement with science, and development of skills like data collection and analysis. Science centers are well positioned to develop citizen science programs that can provide learning experiences for visitors and meaningful data for scientific research. Evaluating these programs can measure their impact on outcomes like knowledge, attitudes, behaviors, and scientific literacy.
This document summarizes DigiSight's mission to integrate mobile diagnostic tools into clinical care. It describes that DigiSight currently works with 13 ophthalmic tests on mobile applications and is developing additional tools like fundus imaging and IOP monitoring. The product is a single, secure portal that unites diagnostic data into a complete clinical view for physicians. Use cases show benefits for clinical care, financial performance, and research. Clinical studies have been completed and major partners include retinal specialists. Ophthalmology is a good specialty to start in given concentrated providers and large, motivated patient populations for conditions diagnosed using mobile tools.
This document summarizes the findings of the ERIAL project, an ethnographic study of how students find and use information at academic libraries. The project used interviews and diaries with over 700 students and faculty. It found that students approach research like Google searches, relying on simple keyword searches and iterative searching rather than refining searches. Students also tend to cursorily evaluate sources based on accessibility rather than accuracy. The search tools available to students influence which sources they utilize. The study suggests libraries need to better understand student information behaviors and design tools and instruction with their practices in mind.
Connecting Physicians and iPads to Support Patient Careevardell
This document discusses using iPads in clinical settings for patient education and care. It provides examples of how iPads can be used to look up information at the patient's bedside, display images and videos, and complete electronic forms and questionnaires. Barriers to iPad adoption like cost and technical issues are addressed. Results from a pilot study show promise for using iPads for these functions. Overall, the document argues that iPads show potential to improve patient care and education if implementation challenges can be overcome.
Brian Fisher is a researcher who specializes in analytics studies in healthcare. He has a background in biology, medical biophysics, and experimental psychology. Currently, he works at SFU's School of Interactive Arts and Technology and UBC's Media & Graphics Interdisciplinary Centre. His lab, SCIENCElab, applies techniques from cognitive science and human-computer interaction to areas like emergency management, aircraft safety, and healthcare monitoring. The lab uses methods like cognitive ethnography and "pair analytics" to incorporate scientific knowledge into interactive visualization design and evaluation. Fisher discusses examples involving emergency response coordination and immunological response analysis to infectious diseases. He emphasizes the importance of interdisciplinary collaboration between technology developers, health professionals, and visual analytics researchers to advance
Pivotal role of intelligence analysis in ILPdalened
This is a presentation I delivered at a "Intelligence Strategies for Law Enforcement" conference in March 2010 in Pretoria. The focus was what analysts\' role is and what contribution they can make to the fight against crime. I represented the International Association for Law Enforcement Intelligence Analysts (IALEIA). You might find slide 5 with the 4 steps in the Intel cycle useful to describe to your colleagues what they can expect from you in all phases of the Intel process. I was a bit disappointed with the conference, as the organizers have definitely not done research to understand the topic themselves or get speakers that understand even the basics of intelligence.... However, I got some good feedback after the conference, but it looks as if we still have a very long struggle ahead of us to establish Intel-led policing in SA...
Pivotal role of Intelligence analysts in intelligence-led-policingDalene
Intelligence analysts play a pivotal role in supporting law enforcement. Their work involves strategic analysis like environmental scanning and indicator development as well as operational analysis such as answering the "5Ws and H" and producing target profiles. For analysis to be successful, there needs to be a decision-making system to support, a willingness to think ahead and apply results, and information sharing across boundaries. The International Association of Law Enforcement Intelligence Analysts (IALEIA) promotes the intelligence analysis profession through training, publications, partnerships, and recognition awards. While analysis capacity is currently limited in Africa, there are signs of growing awareness and an awakening across disciplines on the continent in recent years.
The document provides an update from the director of CACR (Center for Applied Cybersecurity Research). It summarizes the upcoming spring seminar series speakers, thanks those involved in making the seminars possible, and discusses the current cybersecurity landscape including frequent software vulnerabilities and data breaches. It also outlines the director's wishes for better software evaluation tools, more sharing of breach details and intelligence, and increased funding spanning research and operations. Finally, it provides an overview of CACR's vision and role within Indiana University to interweave technical and policy expertise across disciplines to improve cybersecurity.
AI for the Human Retina to Protect Newborn VisionStepan Pushkarev
The document discusses using artificial intelligence to help screen newborn babies for vision issues. It describes Pr3vent, a company that uses AI to analyze retinal images to identify potential vision problems. The document outlines the benefits of universal newborn vision screening to prevent vision loss and the economic savings it could provide. It then discusses how Pr3vent is developing an AI system trained on hundreds of thousands of retinal images to help identify issues and scale screening efforts. The document also covers lessons learned from developing healthcare AI applications and ensuring they are transparent, accountable and can be integrated into clinical workflows.
1) Jordan Engbers is a chief scientist and CTO who has experience in bioinformatics, neuroscience, clinical data science, and founding two data science companies.
2) Data science is a multidisciplinary field that uses techniques from many areas like statistics, computer science, and domain knowledge to understand data and help improve decision making.
3) The impact of data science comes from developing data products - tools that deliver insights from data to drive better decisions. This requires both scientific rigor and software engineering practices.
Maruthi Prithivirajan, Head of ASEAN & IN Solution Architecture, Neo4j
Get an inside look at the latest Neo4j innovations that enable relationship-driven intelligence at scale. Learn more about the newest cloud integrations and product enhancements that make Neo4j an essential choice for developers building apps with interconnected data and generative AI.
Threats to mobile devices are more prevalent and increasing in scope and complexity. Users of mobile devices desire to take full advantage of the features
available on those devices, but many of the features provide convenience and capability but sacrifice security. This best practices guide outlines steps the users can take to better protect personal devices and information.
The document discusses the Software Sustainability Institute's community engagement efforts, including its Agents/Super Pals program and Fellows program. It recruits early-career and mid-career researchers to gather intelligence, run workshops, and provide feedback. The Fellows program has grown from 10 Agents in 2011 to 15 Fellows in 2013 across various research domains. The goals are to effectively serve the research community, maximize the Institute's impact, and promote awareness of software sustainability best practices.
AFHCAN provides telehealth solutions to remote Alaskan communities through a network of 235 sites belonging to 39 health organizations. It started as a federally funded project in 1998 to address the challenges of delivering healthcare across Alaska's vast, sparsely populated territory. AFHCAN has deployed hardware and software to all sites, and helped connect organizations to telecommunications. It has established clinical programs in specialties like cardiology, psychology and dentistry. AFHCAN also provides training, and has expanded its educational offerings through a partnership with the University of Alaska. The network has grown significantly since 2001 and facilitates hundreds of thousands of telehealth encounters each year.
The document summarizes UNC's defense research and development programs that support the military. It discusses degree programs, short courses, internships and fellowships aligned with military needs. It also describes the UNC Defense Applications Group, which is a multi-disciplinary group of faculty that work on applied research challenges for the military. Finally, it lists UNC's core capabilities for military applications such as medical research, human performance, materials science and autonomous systems.
Improving Access to Research Data: What does changing legislation mean for y...Marieke Guy
Presentation given at Bett: Technology in Higher Education Conference, Jan 30 - 31
http://www.bettshow.com/Default.aspx?nid=15&refer=17&id=mainLnk2&id1=ssubLnk8
Uber Operations is a data integration company founded in 2004 and headquartered in Tallahassee, Florida. They focus on data integration and information exchange to solve challenges around disparate data sources and secure data transport. Their mission is to strategically apply resources to guarantee client success by integrating the world's data. They have expertise in various integration technologies and provide services to both public and private sector healthcare organizations.
The webinar explores some of the current opportunities for AI within Life Science and look ahead to what we can expect to see over the coming years. These are the accompanying slides.
This document provides an overview and outline for a professional development short course on exploring data through accessing, understanding, and visualizing data to gain insight. The course will be taught by instructors Ted Meyer and Dr. Brand Fortner and cover topics such as the purposes of visualization, basic concepts of visual perception, processes for creating effective visualizations, and using visualization tools and standards.
Scholar Plot –
Scalable Data Visualization Methods for Academic Careers
Kyeongan (Karl) Kwon
PhD Dissertation
Department of Computer Science
University of Houston
Monday July 18, 2016
Abstract
In this dissertation, I have developed scalable data visualization methods to depict a scholar's accomplishments at a glance. The evaluation of scholarly achievements in academia is largely based on the researcher's publication record. This record is communicated in exhaustive detail in the researcher's curriculum vitae (CV) or in summary via her/his h-index. The h-index, although a convenient abstraction, does not consider neither the time of the publication nor the impact factor (IF) of the journal where it appeared. I present a novel method that visually complements the h-index, revealing at a glance the nature of a researcher's scholastic record. This method (which includes the visualizations Scholar Plot and Academic Garden) is particularly appropriate for web interfaces, as it produces information that is compact and simple, yet highly illuminating.
Scholar Plot uses Google Scholar, Impact Factor, and NSF/NIH/NASA funding data to create a temporal representation of a researcher's publication/funding record that blends publication prestige with paper popularity and funding information. Scholar Plot affords an insightful appraisal of academics at one's fingertips. Academic Garden applies to individual academics, departments, colleges, and any other academic group thereof, such as a research lab or a project team. Academic Garden uses the flower metaphor to visually articulate performance of academic entities. The width of the flower's stem is commensurate to the academic funding the entity received (`juice conduit'). The height of the flower's stem is commensurate to the impact of the entity's intellectual products (`visibility'). The diameter of the flower's disc is commensurate to the prestige of the venues where these products appeared (`fancy factor'). Scholar Plot and Academic Garden bring clarity, transparency, and fairness in hiring, promotion, tenure, and funding decisions.
For the validation of the Academic Garden, I ran data analysis using Endowed Chaired Faculty, a prestigious honor in the United States, for the top 10 universities according to the US News Report 2015. The analysis demonstrated that chaired faculty can be predicted using the 3 merit criteria of citations, impact factor, and funding.
Citizen science at informal science education institutions workshop slidesCitizenScience.org
Citizen science programs have the potential to increase participants' knowledge of science content and processes, engagement with science, and development of skills like data collection and analysis. Science centers are well positioned to develop citizen science programs that can provide learning experiences for visitors and meaningful data for scientific research. Evaluating these programs can measure their impact on outcomes like knowledge, attitudes, behaviors, and scientific literacy.
This document summarizes DigiSight's mission to integrate mobile diagnostic tools into clinical care. It describes that DigiSight currently works with 13 ophthalmic tests on mobile applications and is developing additional tools like fundus imaging and IOP monitoring. The product is a single, secure portal that unites diagnostic data into a complete clinical view for physicians. Use cases show benefits for clinical care, financial performance, and research. Clinical studies have been completed and major partners include retinal specialists. Ophthalmology is a good specialty to start in given concentrated providers and large, motivated patient populations for conditions diagnosed using mobile tools.
This document summarizes the findings of the ERIAL project, an ethnographic study of how students find and use information at academic libraries. The project used interviews and diaries with over 700 students and faculty. It found that students approach research like Google searches, relying on simple keyword searches and iterative searching rather than refining searches. Students also tend to cursorily evaluate sources based on accessibility rather than accuracy. The search tools available to students influence which sources they utilize. The study suggests libraries need to better understand student information behaviors and design tools and instruction with their practices in mind.
Connecting Physicians and iPads to Support Patient Careevardell
This document discusses using iPads in clinical settings for patient education and care. It provides examples of how iPads can be used to look up information at the patient's bedside, display images and videos, and complete electronic forms and questionnaires. Barriers to iPad adoption like cost and technical issues are addressed. Results from a pilot study show promise for using iPads for these functions. Overall, the document argues that iPads show potential to improve patient care and education if implementation challenges can be overcome.
Brian Fisher is a researcher who specializes in analytics studies in healthcare. He has a background in biology, medical biophysics, and experimental psychology. Currently, he works at SFU's School of Interactive Arts and Technology and UBC's Media & Graphics Interdisciplinary Centre. His lab, SCIENCElab, applies techniques from cognitive science and human-computer interaction to areas like emergency management, aircraft safety, and healthcare monitoring. The lab uses methods like cognitive ethnography and "pair analytics" to incorporate scientific knowledge into interactive visualization design and evaluation. Fisher discusses examples involving emergency response coordination and immunological response analysis to infectious diseases. He emphasizes the importance of interdisciplinary collaboration between technology developers, health professionals, and visual analytics researchers to advance
Pivotal role of intelligence analysis in ILPdalened
This is a presentation I delivered at a "Intelligence Strategies for Law Enforcement" conference in March 2010 in Pretoria. The focus was what analysts\' role is and what contribution they can make to the fight against crime. I represented the International Association for Law Enforcement Intelligence Analysts (IALEIA). You might find slide 5 with the 4 steps in the Intel cycle useful to describe to your colleagues what they can expect from you in all phases of the Intel process. I was a bit disappointed with the conference, as the organizers have definitely not done research to understand the topic themselves or get speakers that understand even the basics of intelligence.... However, I got some good feedback after the conference, but it looks as if we still have a very long struggle ahead of us to establish Intel-led policing in SA...
Pivotal role of Intelligence analysts in intelligence-led-policingDalene
Intelligence analysts play a pivotal role in supporting law enforcement. Their work involves strategic analysis like environmental scanning and indicator development as well as operational analysis such as answering the "5Ws and H" and producing target profiles. For analysis to be successful, there needs to be a decision-making system to support, a willingness to think ahead and apply results, and information sharing across boundaries. The International Association of Law Enforcement Intelligence Analysts (IALEIA) promotes the intelligence analysis profession through training, publications, partnerships, and recognition awards. While analysis capacity is currently limited in Africa, there are signs of growing awareness and an awakening across disciplines on the continent in recent years.
The document provides an update from the director of CACR (Center for Applied Cybersecurity Research). It summarizes the upcoming spring seminar series speakers, thanks those involved in making the seminars possible, and discusses the current cybersecurity landscape including frequent software vulnerabilities and data breaches. It also outlines the director's wishes for better software evaluation tools, more sharing of breach details and intelligence, and increased funding spanning research and operations. Finally, it provides an overview of CACR's vision and role within Indiana University to interweave technical and policy expertise across disciplines to improve cybersecurity.
AI for the Human Retina to Protect Newborn VisionStepan Pushkarev
The document discusses using artificial intelligence to help screen newborn babies for vision issues. It describes Pr3vent, a company that uses AI to analyze retinal images to identify potential vision problems. The document outlines the benefits of universal newborn vision screening to prevent vision loss and the economic savings it could provide. It then discusses how Pr3vent is developing an AI system trained on hundreds of thousands of retinal images to help identify issues and scale screening efforts. The document also covers lessons learned from developing healthcare AI applications and ensuring they are transparent, accountable and can be integrated into clinical workflows.
1) Jordan Engbers is a chief scientist and CTO who has experience in bioinformatics, neuroscience, clinical data science, and founding two data science companies.
2) Data science is a multidisciplinary field that uses techniques from many areas like statistics, computer science, and domain knowledge to understand data and help improve decision making.
3) The impact of data science comes from developing data products - tools that deliver insights from data to drive better decisions. This requires both scientific rigor and software engineering practices.
Similar to Iscram ebert keynote_apr_2012_v2_small (20)
Maruthi Prithivirajan, Head of ASEAN & IN Solution Architecture, Neo4j
Get an inside look at the latest Neo4j innovations that enable relationship-driven intelligence at scale. Learn more about the newest cloud integrations and product enhancements that make Neo4j an essential choice for developers building apps with interconnected data and generative AI.
Threats to mobile devices are more prevalent and increasing in scope and complexity. Users of mobile devices desire to take full advantage of the features
available on those devices, but many of the features provide convenience and capability but sacrifice security. This best practices guide outlines steps the users can take to better protect personal devices and information.
Pushing the limits of ePRTC: 100ns holdover for 100 daysAdtran
At WSTS 2024, Alon Stern explored the topic of parametric holdover and explained how recent research findings can be implemented in real-world PNT networks to achieve 100 nanoseconds of accuracy for up to 100 days.
Unlocking Productivity: Leveraging the Potential of Copilot in Microsoft 365, a presentation by Christoforos Vlachos, Senior Solutions Manager – Modern Workplace, Uni Systems
UiPath Test Automation using UiPath Test Suite series, part 5DianaGray10
Welcome to UiPath Test Automation using UiPath Test Suite series part 5. In this session, we will cover CI/CD with devops.
Topics covered:
CI/CD with in UiPath
End-to-end overview of CI/CD pipeline with Azure devops
Speaker:
Lyndsey Byblow, Test Suite Sales Engineer @ UiPath, Inc.
Programming Foundation Models with DSPy - Meetup SlidesZilliz
Prompting language models is hard, while programming language models is easy. In this talk, I will discuss the state-of-the-art framework DSPy for programming foundation models with its powerful optimizers and runtime constraint system.
Let's Integrate MuleSoft RPA, COMPOSER, APM with AWS IDP along with Slackshyamraj55
Discover the seamless integration of RPA (Robotic Process Automation), COMPOSER, and APM with AWS IDP enhanced with Slack notifications. Explore how these technologies converge to streamline workflows, optimize performance, and ensure secure access, all while leveraging the power of AWS IDP and real-time communication via Slack notifications.
AI 101: An Introduction to the Basics and Impact of Artificial IntelligenceIndexBug
Imagine a world where machines not only perform tasks but also learn, adapt, and make decisions. This is the promise of Artificial Intelligence (AI), a technology that's not just enhancing our lives but revolutionizing entire industries.
GraphSummit Singapore | The Art of the Possible with Graph - Q2 2024Neo4j
Neha Bajwa, Vice President of Product Marketing, Neo4j
Join us as we explore breakthrough innovations enabled by interconnected data and AI. Discover firsthand how organizations use relationships in data to uncover contextual insights and solve our most pressing challenges – from optimizing supply chains, detecting fraud, and improving customer experiences to accelerating drug discoveries.
Goodbye Windows 11: Make Way for Nitrux Linux 3.5.0!SOFTTECHHUB
As the digital landscape continually evolves, operating systems play a critical role in shaping user experiences and productivity. The launch of Nitrux Linux 3.5.0 marks a significant milestone, offering a robust alternative to traditional systems such as Windows 11. This article delves into the essence of Nitrux Linux 3.5.0, exploring its unique features, advantages, and how it stands as a compelling choice for both casual users and tech enthusiasts.
Unlock the Future of Search with MongoDB Atlas_ Vector Search Unleashed.pdfMalak Abu Hammad
Discover how MongoDB Atlas and vector search technology can revolutionize your application's search capabilities. This comprehensive presentation covers:
* What is Vector Search?
* Importance and benefits of vector search
* Practical use cases across various industries
* Step-by-step implementation guide
* Live demos with code snippets
* Enhancing LLM capabilities with vector search
* Best practices and optimization strategies
Perfect for developers, AI enthusiasts, and tech leaders. Learn how to leverage MongoDB Atlas to deliver highly relevant, context-aware search results, transforming your data retrieval process. Stay ahead in tech innovation and maximize the potential of your applications.
#MongoDB #VectorSearch #AI #SemanticSearch #TechInnovation #DataScience #LLM #MachineLearning #SearchTechnology
Communications Mining Series - Zero to Hero - Session 1DianaGray10
This session provides introduction to UiPath Communication Mining, importance and platform overview. You will acquire a good understand of the phases in Communication Mining as we go over the platform with you. Topics covered:
• Communication Mining Overview
• Why is it important?
• How can it help today’s business and the benefits
• Phases in Communication Mining
• Demo on Platform overview
• Q/A
GraphRAG for Life Science to increase LLM accuracyTomaz Bratanic
GraphRAG for life science domain, where you retriever information from biomedical knowledge graphs using LLMs to increase the accuracy and performance of generated answers
GraphSummit Singapore | The Future of Agility: Supercharging Digital Transfor...Neo4j
Leonard Jayamohan, Partner & Generative AI Lead, Deloitte
This keynote will reveal how Deloitte leverages Neo4j’s graph power for groundbreaking digital twin solutions, achieving a staggering 100x performance boost. Discover the essential role knowledge graphs play in successful generative AI implementations. Plus, get an exclusive look at an innovative Neo4j + Generative AI solution Deloitte is developing in-house.
TrustArc Webinar - 2024 Global Privacy SurveyTrustArc
How does your privacy program stack up against your peers? What challenges are privacy teams tackling and prioritizing in 2024?
In the fifth annual Global Privacy Benchmarks Survey, we asked over 1,800 global privacy professionals and business executives to share their perspectives on the current state of privacy inside and outside of their organizations. This year’s report focused on emerging areas of importance for privacy and compliance professionals, including considerations and implications of Artificial Intelligence (AI) technologies, building brand trust, and different approaches for achieving higher privacy competence scores.
See how organizational priorities and strategic approaches to data security and privacy are evolving around the globe.
This webinar will review:
- The top 10 privacy insights from the fifth annual Global Privacy Benchmarks Survey
- The top challenges for privacy leaders, practitioners, and organizations in 2024
- Key themes to consider in developing and maintaining your privacy program
1. Visual Analytics: Powering Discovery,
Innovation, and Decision Making
(Much more than Big Data Analytics plus Visualization)
David S. Ebert
ebertd@purdue.edu
2. Path
Introduction to our Center - VACCINE
Motivation and introduction to visual analytics
Example solutions we’ve developed
Health visual analytics
Maritime public safety and law enforcement
Public safety
Resource allocation
Visual analytic challenges and future
April 2012
3. SFU, JIBC
UBC
UW
Purdue
Penn St.
Ind U
VaTech
Stanford
NC UNCC
A&T
Navajo GaTech
Tech JSU U
Stuttgart
UT UHD Swansea U
Austin
FIU
April 2012
4. VACCINE Mission
• Provide visual analytic and scalable
solutions for all 2.3 million extended
homeland security personnel
• 185,000 DHS personnel, 350,000 law enforcement personnel,
750,000 homeland security practitioners, 2.3 million extended
personnel
• Achieve excellence in visual
analytics and visualization sciences
• Educate homeland security
stakeholders and the next
generation of talent
April 2012
5. Who We Are:
International Team of Experts
- 75+ Faculty, 25 institutions
• Purdue University • University of Houston, Downtown
• Georgia Institute of Technology • Virginia Tech
• Pennsylvania State University • Indiana University
• Stanford University • Florida International University
• University of North Carolina at • University of Texas at Austin
Charlotte • Morgan State University
• University of Washington • Navajo Technical College
• Simon Fraser University • University of Stuttgart
• University of British Columbia • University of Swansea, UK
• Justice Institute of British • Oxford
Columbia • University of Calgary
• Ontario Institute of Technology • University of Manitoba
• Dalhousie University • Carleton University
•
April 2012
University of Victoria
6. Some VACCINE Regional and
Corporate Partners
• Indiana Department of Homeland Security • Motorola
• Indiana State Department of Health • Harris Corporation
• Indianapolis Public Safety • Boeing
• Charlotte Mecklenburg Police Department • Next Wave Systems, LLC
• Lafayette, West Lafayette, Purdue Police • Banfield, The Pet Hospital
Departments • Raytheon
• Tippecanoe County EMA & Sherriff’s • MacDonald, Dettwiler and Associates
Department • Oculus Info Inc.
• Harrisburg, PA Police • Kx Systems
• Coast Guard Sector Boston, Seattle, LA • Bank of America
• Joint Harbor Operations Command • Duke Energy
Center
• World Vision International
• Port of Seattle
• Gates Foundation
• Indianapolis Public Safety
• Kimberly Clark
• USCG District 9, D5, D1
• Hallmark
April 2012
7. Some VACCINE
Government Partners
• U.S. Coast Guard • National Maritime Intelligence
• Federal Emergency Management Center
Agency • Defence Research & Development
Canada
• Customs and Border Patrol
• National Geospatial Intelligence • Foreign Broadcast Information
Agency Service
• US-CERT
• National Science Foundation
• Army Research Office • Oak Ridge National Laboratories
• Department of Defense • US Army Corps of Engineers-
ERDC
• Department of Health and Human
Services • Pacific Northwest National
Laboratory
• U.S. Dept. of State
• ARL CERDEC & ARDEC
• National Institute of Justice
• US Attorney’s Office (David Capp)
April 2012
8. What We Do
• Enable effective decision making through interactive
visual analytic environments
• Enable effective communication of information
• Provide quantitative, reliable, reproducible evidence
• Enable user to be more effective from planning to
detection to response to recovery
• Enable proactive and predictive visual analytics
• Enable effective situational awareness (perception,
comprehension, projection)
April 2012
9. Path
Introduction to our Center - VACCINE
Motivation and introduction to visual
analytics
Example solutions we’ve developed
Health visual analytics
Maritime public safety and law enforcement
Public safety
Resource allocation
Visual analytic challenges and future
April 2012
10. Motivation
To solve today’s and tomorrow’s problems requires
exploring, analyzing, and reasoning with massive,
multisource, multiscale, heterogeneous, streaming
data
Image of Analyst’s Notebook
April 2012
11. Definition
Visual Analytics1 is the science of analytical reasoning facilitated
by interactive visual interfaces
People use visual analytics tools and techniques to
• Synthesize information and derive insight from massive, dynamic,
ambiguous, and often conflicting data
• Detect the expected and discover the unexpected
• Provide timely, defensible, understandable assessments
• Communicate assessment effectively for action
1. Illuminating the Path: The R&D Agenda for Visual
Analytics, Editors: Thomas and Cook
April 2012
12. Statistical and Information
Analytics
Interaction Science Geospatial Analytics
Cognitive & Scientific Computing
Perceptual Sciences Foundations
of
Visual
Visual Analytics Graphics and Visualization
Design and
Communication
Decision Sciences Knowledge
Knowledge Discovery
Data Management &
Knowledge
April 2012
13. What’s Needed for Proactive and
Predictive Visual Analytics?
• Reliable and reproducible models and simulation
• Understanding of the data
• Distribution and skewness, errors, appropriate analysis
techniques
• Understanding of the sources and types of data
• Comparable or Correlative sources of data
• Appropriate transformations applied to enable meaningful
comparison and correlation
• Understanding of the use and problem to be solved!
April 2012
14. How to Harness Visual Representations
• Visual representations translate data into a visible
form, highlighting important features, such as
commonalities and anomalies
• Visual representations make it easy for users to
perceive salient aspects of their data quickly
• These visual representations augment the cognitive
reasoning process with perceptual reasoning which
enhances the analytical reasoning process
1 – J. J. Thomas and K. A. Cook (Ed.). Illuminating the Path: The R&D Agenda for Visual Analytics. National
Visualization and Analytics Center, 2005.
April 2012
15. Why Was I Invited?
Visual Analytics Uses
for Crisis Management and Response?
• Trend analysis, clustering, anomaly detection
• Interactive, multi-day, month, type investigation
• Multisource, multimedia data integration & analysis
• Purpose:
• Planning for resiliency
• Long-term analysis
• Predictive analytics
• Training
• Detection
• Investigation
• Response
• Recovery, remediation
April 2012
16. Visual Analytics vs. Situational Awareness
Situational Awareness Sensemaking
situational awareness as a sensemaking process (courtesy Alan MacEachren)
Situational awareness model (after
Endsley, 1995; top) compared to
model of sense making (after Pirolli
& Card, 2005; bottom) Situational Awareness
Perception of Comprehension
State of Projection of Performanc
elements in of current Decision
environment future status e of actions
current situation situation
goals & objectives; preconceptions
Sensemaking
Foraging loop Sense-making loop
Search & filter Read & extract Schematize Build case Tell story
External data Evidence
Shoebox Schema Hypotheses Presentation
source file
Search for Search for Search for Search for support Reevaluate
information relations evidence
April 2012
17. Path
Introduction to our Center - VACCINE
Motivation and introduction to visual analytics
Example solutions we’ve developed
Health visual analytics
Maritime public safety and law enforcement
Public safety
Resource allocation and business intelligence
Visual analytic challenges and future
April 2012
18. Example: Public Health
Visual Analytics
Health Pandemic Zoonoses
Surveillance Simulation and Planning Planning and Response
Map of the United States showing the estimated percent of the population ill
based on a simulated pandemic influenza model originating in Chicago, IL.
Pandemic spread on day 37 with no Pandemic spread on day 37 with all
decision measures implemented decision measures implemented
19. Visual Analytics For Syndromic Surveillance
• Syndromic surveillance: detection of adverse health events
focusing on pre-diagnosis information to improve response time
• Pre-diagnosis information can consist of multiple data sources:
– Over the counter medicine sales
– News reports on emerging diseases
– Pro-med news feeds
– Emergency department chief complaints
April 2012
20. Hypothesis Generation and Exploration
Best Paper Nominee, IEEE Symposium on Visual Analytics Science and Technology (VAST), October 2008, for
“Understanding Syndromic Hotspots – A Visual Analytics Approach,” 21
(Maciejewski, R., Rudolph, S., Hafen, R., Abusalah, A., Yakout, M., Ouzzani, M., Cleveland, W., Grannis, S., Wade,
April 2012
M Ebert D )
21. Time Series Modeling
• Seasonal-Trend
Decomposition Based
on Loess
• Time series can be viewed as
the sum of multiple trend
components
• For each data
signal, components are extracted
• Can then analyze correlation
between components
Hafen, R., Anderson, D., Cleveland, W., Maciejewski, R., Ebert, D., Abusalah, A., Yakout, M., Ouzzani, M., Grannis, S., “STL for
Modeling, Visualizing, and Monitoring Disease Counts,” BMC Medical Informatics and Decision Making, 9(21), 2009. 22
April 2012
24. Modeling a Pandemic
• Pandemic Influenza Planning Tool
• Models user specified:
• Pandemic influenza characteristics
• County population, demographics, hospital beds
• Decision measures
Map of the United States showing the estimated percent of the population ill
• Strategic National based on a simulated pandemic influenza model originating in Chicago, IL.
Stockpile deployment
• School Closures
• Media Alerts
Pandemic spread on day 37 with no Pandemic spread on day 37 with all
decision measures implemented
April 2012 decision measures implemented
25. Visual Analytics Uses
for Public Safety
• Risk visualization and analysis
• Predictive analytics
• Uncertain decision making
• Alternative evaluation and consequence
investigation
• Trend analysis, clustering, anomaly detection
• Interactive, multi-day, month, type
investigation
• Multisource, multimedia data
integration & analysis
April 2012
26. Example Maritime Public Safety Projects
• Search and rescue resource allocation
• Swimmer death analysis
• PWCS analysis
• Economic impact analysis
• Resource allocation and risk-based decision making
April 2012
27. Example: Visual Analytics Environment
• Supports decision making and risk assessment
• Interactive exploration and analysis of trends, patterns and
anomalies
• Allows analysis of risks associated with
• Closing one or more Coast Guard stations
• Find optimal stations that absorb work load of the closing station
• Allocating new resources
• Impact on safety and efficiency of operation
• Currently being used by analysts at the U.S. Ninth District,
HQ, and Atlantic Commands
April 2012
28. Example: USCG D9 Search
And Rescue Operational Analysis
• Interactive visual analytics of multivariate
performance metrics for each unit’s activities
• Interactive linked spatial temporal display, calendar
view, and timeline views
April 2012
29. System Features: SAR Risk Profile
Time taken by CG stations to deploy an asset to the Great Lakes to respond to
a SAR incident.
April 2012
30. U.S. Coast Guard Search and Rescue VA (cgSARVA)
Partners: USCG LANT 7 (Operational Analysis) , USCG D9, USCG D5
IMPACTS:
• Analyzed impact of CG auxiliary
stations on search and rescue mission
in Great Lakes
• Used for resource allocation for SAR
• Provided evidence of temporal and
spatial patterns used in planning –
new insights to SAR mission
• Hurricane Irene resource allocation
decision based on cgSARva analysis
and visualization
• Highest SAR workload that weekend for D9
April 2012
31. 180
FY
160 2006
140
U.S. Coast Guard 120
FY
2007
Swimmer Death Analysis 100
FY
2008
80 FY
2009
60
Impact: 40
FY
2010
• Analyzed spatial and temporal 20
FY
patterns of shore-based and 0
2011
boat-based swimmer deaths to 5 YEAR
AVG
understand death dramatic
increase in D9 in Summer 2010 Findings:
• Provided information and • Swimmer deaths
• August highest frequency
visualizations used for public • Late afternoon highest frequency
information campaign 2011 and for • Lake Michigan (south and west shore) have high
concentration
patrols 2011
• Boating deaths
• Significant decrease in deaths in 2011 • Fri, Sat, Sun account for almost all deaths
• Mid July to Mid August have highest frequency
Swimmer Deaths – Type ‘Swim’- Apr-Oct 2010 (Lives Lost (only 1 week significantly high)
14
13
12
Field)
11
10
9
8
• 2009-2010 from MISLE Data
7
6
5
4 • Large increase on Mon, Thu, Fri, Sun
3
2
1
0 • Early and late season increase
6 am
6 pm
12 am
10 am
11 am
12 pm
10 pm
11 pm
1 am
2 am
3 am
4 am
5 am
7 am
8 am
9 am
1 pm
2 pm
3 pm
4 pm
5 pm
7 pm
8 pm
9 pm
April 2012
32. Resource Allocation and Risk-Based
Decision Making
• Explore risk-based decision
making and utilize historical data
for analysis and prediction
• Total Risk, Mitigated Risk,
Residual Risk
• Explore 11 different USCG missions
• Explore allocation of assets with
different capabilities
• Explore staffing, utilization, assets
vs. risk measures
• Perform What-If scenarios
April 2012
33. Example Public Safety Projects:
• Evacuation planning and management
• Hazardous Materials - mobile imaging
• Law enforcement visual analytics
• Additional projects
• GARI – gang graffiti
• Jigsaw
April 2012
36. MERGE: Mobile Emergency Response
Guide – System Overview
Image Capture Image Analysis
1 2
Display Information Database Query
4
3
April 2012
37. MERGE – iVALET Interactive Plume
Visualization and Evacuation Planning
• Chemical release plume
modeling identifies census
tracts with the highest
number of expected
people affected
April 2012
38. Geovisual Analytics Support For Sensemaking
In Public Health And Crisis Management
(GeoVista Center, PSU)
• SensePlace – leveraging news to support infectious
disease modeling and delivery of services in a
developing country context
• SensePlace2 – leveraging social media to support
situational awareness for health and crises
April 2012
39. SensePlace2: Place-Time-Concept
Analytics
query time filter & grid map of tweet frequency matching query;
window freq display graduated circles depict 500 most relevant
tweets; support for spatial filter by distance
from point
history
view
ranked, sortable 500 selected
most relevant tweets place
http://www.geovista.psu.edu/SensePlac
e2/
April 2012
42. Visual Analytics Law Enforcement Toolkit
(VALET, iVALET)
End-Users: Lafayette, WL Police, Indiana Fusion Center, Indiana State Police, Ohio Fusion Center (initiated)
Impacts:
• In use to analyze crime patterns in
Lafayette, Indiana and connect strings
of activities
• Mobile version being released to
public (November 2011) for
community-based policing
• Investigating correlation of bus routes
and crime, street lights and crime
• Analyzing time of day problems and
improving accuracy of police record VALET delivered:
management system • Spring 2011: WL, Lafayette Police
• Novel statistical predictive model iVALET delivered:
incorporated for planning • October 2011: Purdue, WL Police
April 2012
43. Linked Predictive Crime Models by Type
Visual Analytics Law Enforcement Toolkit
(VALET)- Tippecanoe County Example
•
Day vs. Night Thefts
2008 (red) vs. 2007 (blue background)
Aggravated Theft
April 2012
44. Drunkenness / Public Intoxication
Day-of-the-Week
60
50
40
30
20
10
0
Sat
Wed
Mon
Tue
Thu
Fri
Sun
April 2012
45. Football season
Drunkenness / Public Intoxication Home
Away
PU vs. Notre Dame
PU vs. Iowa
PU Lost: 10-38
Homecoming (Sat.) PU Lost: 21-31
PU vs. Illinois
PU Won: 21-14
Day-of-the-Week
60
50
40
30
20
10
0
Sat
Mon
Tue
Wed
Thu
Fri
Sun
April 2012
46. iVALET
• Explore criminal,
traffic and civil
data on-the-go
• Risk assessment
• Use current
spatial +
temporal context
into analysis
April 2012
47. iVALET
• Linked views to
explore multivariate
spatiotemporal
dataset
• Analytical tools to
help explore data
April 2012
48. GeoVISTA CrimeViz
… an extensible web-based
geovisualization application
that supports exploration of &
sensemaking about criminal
activity in space & time
Project Personnel:
Alan M. MacEachren
Robert E. Roth GeoVISTA Center
Department of
Kevin S. Ross Geography
Scott Pezanowski Penn State University
maceachren@psu.edu
http://www.geovista.psu.edu/CrimeViz
April 2012
49. GeoVISTA CrimeViz: Year/Month View
Aggrevated Assault, by month, for a year; map depicts freq/cell in Nov.
April 2012
50. Crime Analytics & SA Issues and Techniques
• Fuse data from a variety of sources
• Law enforcement records management
• Weather and phases of the moon
• Street light locations, bus routes
• Tracking release data of offenders
• Civil court data
• Social Media
• Local event calendar
• Reliable predictive models
• Understandability and trust of predictions
• Main Question: What helps officers, detectives, chief
do their variety of jobs?
April 2012
51. Jigsaw:
Visual Analytics for Investigative Analysis
and Exploration of Document Collections “Putting the pieces together”
Goal: Assist investigators with understanding, sense-making, and analysis of
large, unstructured and structured document collections
Approach: Provide multiple visual perspectives on the documents and
entities within them, highlighting connections between entities
April 2012
52. Gang Graffiti Recognition and Analysis Using a Mobile Telephone (GARI)
Edward J. Delp, Mireille Boutin
Collaborating Institution(s): Purdue University
End-User(s): Gary Coons, Chief/Indianapolis Department of Public Safety Division of Homeland Security and
IMPD, Indiana Fusion Center Gang Task Force
IMPACT:
• Allows police to catalog and analyze gang GARI delivered:
graffiti images into a database system to better • Summer 2011:
track and determine gang activity throughout a • IMPD gang detectives
• August 2011:
region
• IMPD at large
• Will allow the graffiti images to be “interpreted” • Ind Fusion Gang Task Force
• More than 40 users and 450 graffiti images • October 2011:
acquired • Gang detectives across
Indiana
April 2012
53. Path
Introduction to our Center - VACCINE
Motivation and introduction to visual analytics
Example solutions we’ve developed
Health visual analytics
Public safety
Resource allocation
Visual analytic challenges and future
April 2012
54. Five Six Challenges for Proactive & Predictive
Visual Analytics
1. Creating computer-human visual cognition
environments
2. Integrating interactive simulation and analytics
3. Solving specific scale issues and cross-scale issues
4. Managing uncertainty and time
5. Enabling risk-based decision making
environments
6. Developing the Science of Interaction for Visual
Analytics
April 2012
55. Visual Analytics At Real-World Scale
• Utilize advanced HPC • Example: Longhorn
techniques to enable Exascale Visual Analytic
interactive spatiotemporal Platform
analysis (spatiotemporal • 2048 compute cores (Nehalem
clustering, prediction) quad-core)
• Cluster-based and cloud- • 512 GPUs (128 NVIDIA Quadro
based solutions Plex S4s, each containing 4
NVIDIA FX 5800s)
• GPGPU solutions • 13.5 TB of distributed memory
• Develop easily usable • 210 TB global file system
HPC visual analytic
environments
April 2012
56. The Science of Interaction
• Definition: The study of methods by which humans create knowledge through
the manipulation of an interface.
• …interaction and inquiry are inextricable. It is through the interactive manipulation of a visual
interface – the analytic discourse – that knowledge is constructed, tested, refined and shared.”
Stasko et al., IV2009
5 Challenges:
1.Visual Discourse - Interactive visual thinking tools for the exploration, understanding, collaboration, description,
explanation, decision, dissemination, persuasion of concepts & data.
2.Multi-modal Sensemaking In The Large - Enable large-scale, distributed teams to interactively
make sense of big multi-modal data and problems.
3.Fluid Interaction - Designing fluid, high-bandwidth, and powerful interaction models and paradigms for the purpose
of individuals reaching their full potential in viewing, analyzing, and understanding large and complex data.
4. Collaboration – beyond space and time- synergizing technologies and human users
5. Mixed Initiative Data Discovery and Manipulation - Balancing active user input with systematic
guidance to enable visual data manipulation and analysis.
April 2012
57. Visual Analytics: Remember…
• We need to be cognizant of parameters for visual
representations
• Appropriate analysis can guide users to interesting
features in the data
• Refined analysis through user interaction and their
domain knowledge can help discover hidden problems
• There is no single catch-all visual representation or
analysis
April 2012
58. Keys for Success
• User and problem driven
• Balance human cognition and automated analysis and
modeling
• Often applied on-the-fly for specific components identified by the user
• Interactivity and easy interaction
• Utilizing HPC and novel analysis approaches
• Understandability of why predicted value is what it is
• Intuitive visual cognition
• Not overloaded with features
April 2012
59. For Further Information
www.VisualAnalytics-CCI.org
vaccine@purdue.edu
ebertd@purdue.edu
April 2012