Download to read offline
![International Research Journal of Engineering and Technology (IRJET) e-ISSN: 2395-0056
Volume: 07 Issue: 02 | Feb 2020 www.irjet.net p-ISSN: 2395-0072
© 2020, IRJET | Impact Factor value: 7.34 | ISO 9001:2008 Certified Journal | Page 2625
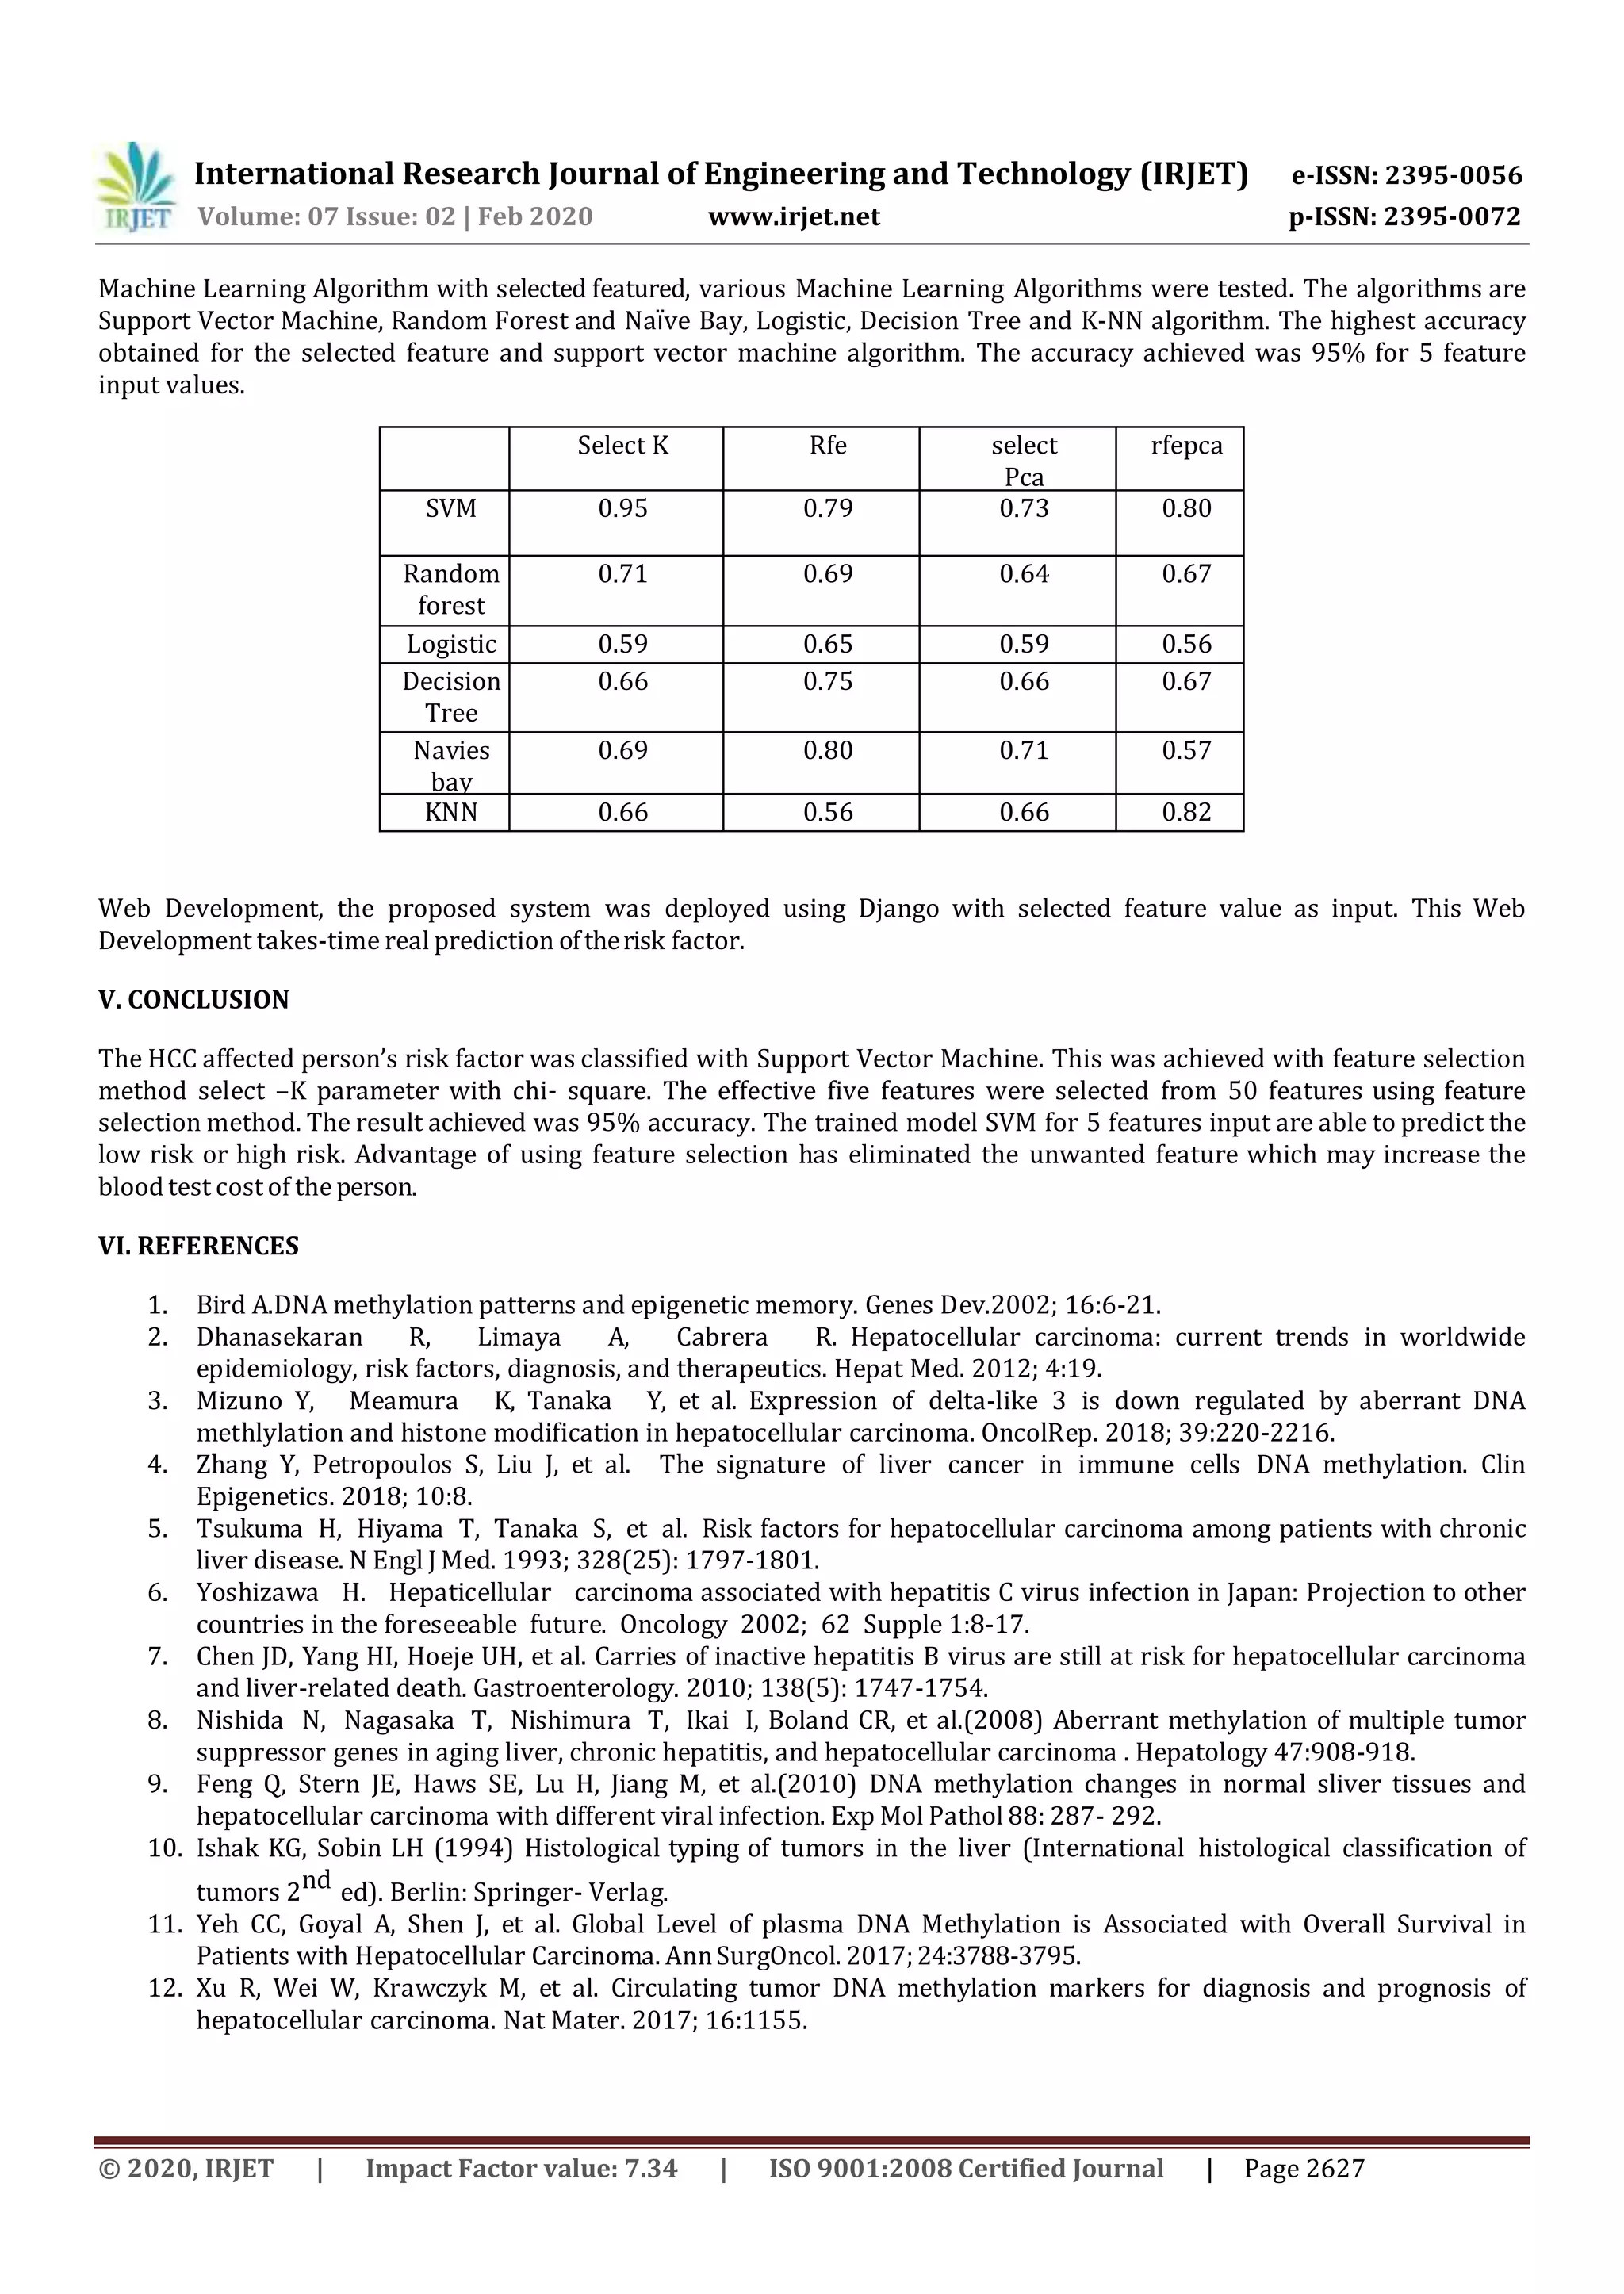
calculated by the confusion matrix. The final model will be optimized by selecting the best accuracy of the algorithm. This
model helps us to find the future prediction of survival of liver cancer affected patients.
The trained mode will be saved and loaded for web development. With the help of build model and with a selected feature.
Web development will have an input variable of selected features, by submitting the answer of the selected feature, the
prediction will be done.
II. LITERATURE SURVEY
First, we have investigated various papers and discussions on Machine Learning for Liver Cancer.[1]The title of the paper is
Hepatocellular Carcinoma current trends in worldwide epidemiology, risk factors, diagnosis and therapeutics, In this paper
they described Liver transplantation and surgical resection remains the corner stone of curative treatment. But major
advances in loco regional therapies and molecular –targeted therapies for the treatment of advanced HCC have occurred
recently.[2]The title of the paper is Computed aided diagnosis system developed for ultrasound diagnosis of liver lesions
using deep learning, they described the accuracy of this 2-class classification CADx was 94.8%, the sensitivity was 93.8%,
and he specificity was 95.2%. Both 4-classclassification and
2-class classification CADx had relatively high accuracy. However in this study they used only a small amount data
collected from a single facility.[3] Comparison of the Machine Learning approaches for prediction of advanced liver fibrosis in
chronic hepatitis C patients, they described about age, platelet count ,AST and albumin were found to be statistically
significant to advanced fibrosis.[4]Developing an expert system for diagnosing liver disease ,they described about 3
categories of disease diagnostic factors, questions corresponding sub section, and the response range are determined on
mocklar chart, and finally the tables are designed to express the system interference according to users answers to the
questions.
III. METHODS AND ALGORITHMS
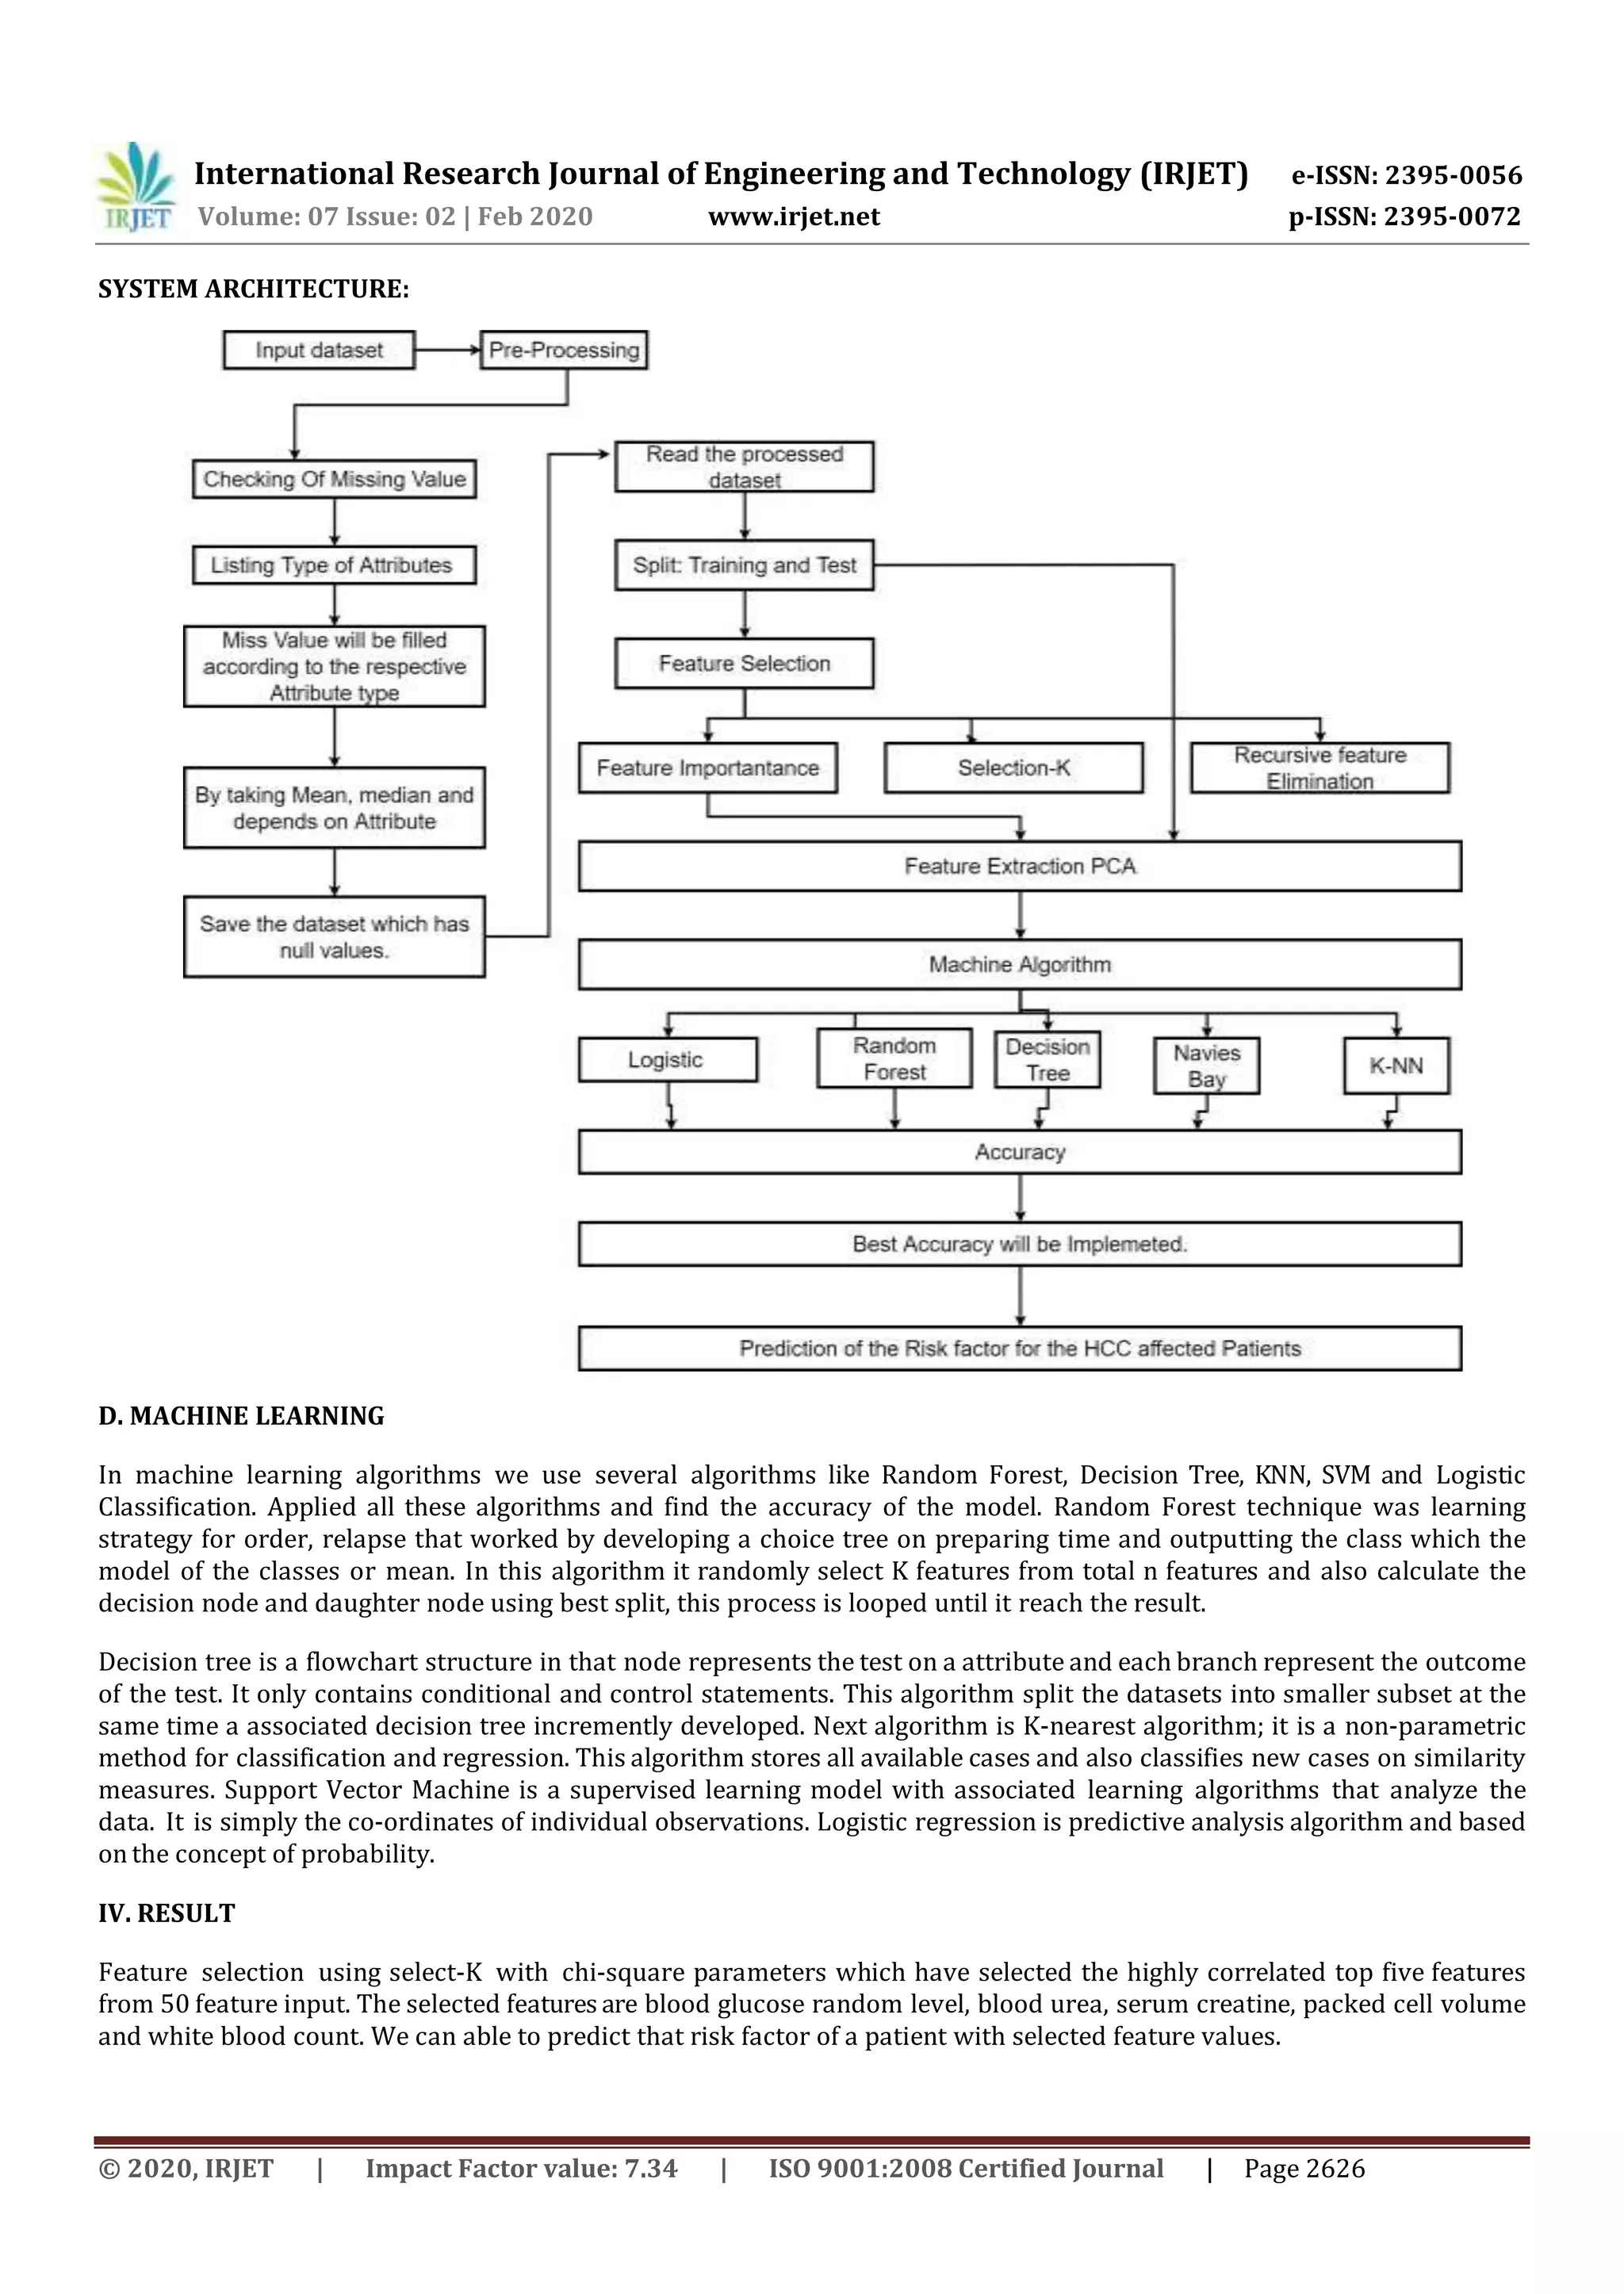
A. DATA PREPROCESSING
Data preprocessing technique is used to convertthe raw data into clean data. Raw data is nothing but, the data was collected
from various sources and that format was not feasible for analysis process. In our dataset they are 50 attributes are
present out of that 8 patients details are fully filed. In preprocessing technique we fill the missing values of attributes. It can
be predicted by remaining by output variables. The data can be classified into three categories namely nominal, categorical
and ordinal. Nominal information was named information that can beisolatedinto discrete classifications which don’t cover.
Example of nominal data is gender, hair color, and eye color. Categorical data is a numerical data, Example of categorical
is age. Ordinal data was a data that can be placed in an order or scale. Using preprocessing technique we filled all kinds of
data that type has any missing values.
B. FEATURE SELECTION
Feature selection is the method of decreasing the number of input variables when developing a predictive model. It is
difficult to analyze every attribute so feature selection select the most important attribute for prediction. It is also increase
the performance of model. In feature selection we use Select-K Best algorithm, it was simply retains the first K features of
X with highest scope. And also we used RFE (Recursive Feature Selection) algorithm to remove the less importance
features.RFE playsamainrolein prediction model.
C.FEATURE EXTRACTION
Feature Extraction is the process of reduce the number of features and also it create a new feature from existing one. It
also extracts the new patterns available in features. In feature extraction we use PCA (Principal Component Analysis), it
combines the same attributes and also create a new patterns which is superior to original attributes. It does not combine
the attributeit just evaluates the quality, predictive power and selects the best one for model.](https://image.slidesharecdn.com/irjet-v7i2555-201127022538/75/IRJET-Prediction-of-Risk-Factor-of-the-Patient-with-Hepatocellular-Carcinoma-using-Machine-Learning-2-2048.jpg)

This document discusses using machine learning to predict the risk factor of patients with hepatocellular carcinoma (HCC or liver cancer) based on medical test results. It involves collecting patient data, preprocessing the data, feature selection to identify key predictive features, and using machine learning algorithms like support vector machines (SVM) and random forests. The best model achieved 95% accuracy using SVM with 5 selected features to classify patients as high or low risk, where high risk means less than one year lifetime. The system could help predict survival time and guide treatment decisions for liver cancer patients.


![[IJCT-V3I2P26] Authors: Sunny Sharma](https://cdn.slidesharecdn.com/ss_thumbnails/ijct-v3i2p26-160609063241-thumbnail.jpg?width=640&height=640&fit=bounds)


