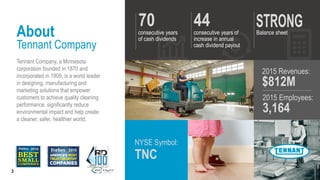
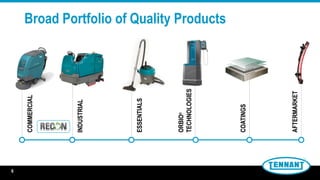
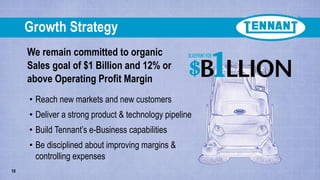
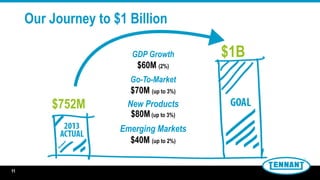
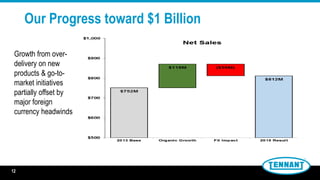
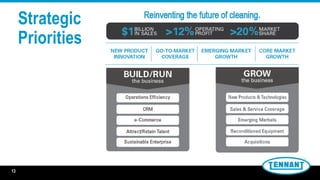
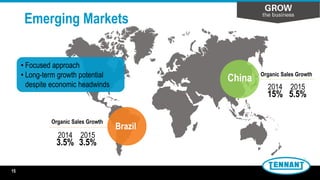
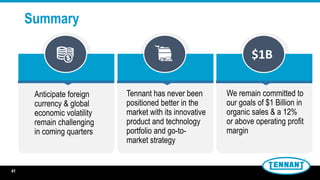
SlideShare a Scribd company logo
TENNANTCO.COM
REINVENTING
the future of cleaning.
INVESTOR PRESENTATION
April 2016
This presentation contains certain statements that are considered “forward-looking statements”
within the meaning of the Private Securities Litigation Reform Act of 1995. Forward-looking
statements generally can be identified by the use of forward-looking terminology such as “may,”
“will,” “expect,” “intend,” “estimate,” “anticipate,” “believe,” “project,” or “continue” or similar words
or the negative thereof. These statements do not relate to strictly historical or current facts and
provide current expectations of forecasts of future events. Any such expectations or forecasts of
future events are subject to a variety of factors. We caution that forward-looking statements must
be considered carefully and that actual results may differ in material ways due to risks and
uncertainties both known and unknown. Information about factors that could materially affect our
results can be found in Part I, Item 1A, Risk Factors in our Annual Report on Form 10-K for the
year ended December 31, 2015. Shareholders and potential investors are urged to consider
these factors in evaluating forward-looking statements and are cautioned not to place undue
reliance on such forward-looking statements.
We undertake no obligation to update or revise any forward-looking statement, whether as a
result of new information, future events or otherwise. Investors are advised to consult any further
disclosures by us in our filings with the Securities and Exchange Commission and in other written
statements on related subjects. It is not possible to anticipate or foresee all risk factors, and
investors should not consider any list of such factors to be an exhaustive or complete list of all
risks or uncertainties.
Safe Harbor
Statement
2
About
Tennant Company
Tennant Company, a Minnesota
corporation founded in 1870 and
incorporated in 1909, is a world leader
in designing, manufacturing and
marketing solutions that empower
customers to achieve quality cleaning
performance, significantly reduce
environmental impact and help create
a cleaner, safer, healthier world.
70consecutive years
of cash dividends
44consecutive years of
increase in annual
cash dividend payout
Balance sheet
NYSE Symbol:
TNC
2015 Revenues:
$812M
3
2015 Employees:
3,164
OUR VISION
We will lead our global industry in
sustainable cleaning innovation that
empowers our customers to create a
cleaner, safer and healthier world.
4
5
Competitive Landscape
2011 Global Market Size – $4.6 Billion*
17%Tennant | Nobles | Alfa
Nilfisk | Clarke | Viper
Hako | Minuteman |
PowerBoss
Karcher | Windsor |
TecServ | ProChem
Taski
of the market
consists of
others with a
market share
of 3% or less
*Market share data is based on company
revenue and estimates for like categories
18%
12%
7% 4%
42%
5
Broad Portfolio of Quality Products
COMMERCIAL
INDUSTRIAL
AFTERMARKET
ESSENTIALS
ORBIO®
TECHNOLOGIES
COATINGS
6
STRONG DIRECT SALES
& SERVICE ORGANIZATIONS
Strong Direct Sales & Service Organizations
Global Sales Employees Global Direct Service EmployeesGlobal Revenue by Sales Channel
25%
75%
Distribution
Direct
Distribution Partners
More than 80 countries
around the world
Global Strategic Accounts
Cross-functional teams &
market specialists
Factory-Service Direct
Locally based & factory-trained
service technicians
0
100
200
300
400
500
600
2012 2013 2014 2015
Americas EMEA APAC
0
100
200
300
400
500
600
700
800
900
2012 2013 2014 2015
Americas EMEA APAC
7
8
Broad Range of Global Customers
MARKETS
8
9
2015 Revenue of $812M
73%
17%
10%
Americas
EMEA
APACNet Sales by
Geography
22%
14%
61%
3%
Service &
Other
Equipment*
Coatings
Net Sales by
Product Group
Parts &
Consumables
*Equipment Mix
Commercial | 52%
Industrial | 44%
Outdoor | 4%
9
We remain committed to organic
Sales goal of $1 Billion and 12% or
above Operating Profit Margin
Growth Strategy
10
• Reach new markets and new customers
• Deliver a strong product & technology pipeline
• Build Tennant’s e-Business capabilities
• Be disciplined about improving margins &
controlling expenses
$1B
$752M
GDP Growth
$60M (2%)
Go-To-Market
$70M (up to 3%)
New Products
$80M(up to 3%)
Emerging Markets
$40M (up to 2%)
11
Our Journey to $1 Billion
11
Our Progress toward $1 Billion
12
Growth from over-
delivery on new
products & go-to-
market initiatives
partially offset by
major foreign
currency headwinds
Strategic
Priorities
13
.
Sales & Service Coverage
Increasing our Presence
×Education Healthcare
Industrial Retail
ENHANCED
GO-TO-MARKET STRATEGY3 COMPONENTS OF
MARKET SHARE
Product
Portfolio
Market
Coverage
(Presence)
Hit
Rate
VERTICAL MARKETS & MARKETING ANALYTICS
14
Emerging Markets
China
Brazil
• Focused approach
• Long-term growth potential
despite economic headwinds
Organic Sales Growth
15
2014
3.5%
2015
3.5%
2014
15%
2015
5.5%
Organic Sales Growth
Operations Efficiency
Strategy Deployment to Drive Four Key Initiatives
VELOCITY & LEAN
Be the absolute leader for
serving the customer!
SERVICE LEVELS
SUPPLY CHAIN
OPTIMIZATION
QUALITY
FOCUS
16
CRM & Marketing Automation
Perpetual Lead Generation
Speed-to-Lead
• Better lead visibility and new
processes mean we can
convert leads faster
• Keep the lead pipeline full
with automated marketing
capabilities embedded
inside CRM
Prospecting
• Leverage deep history to
prioritize the known
• Visualize the potential to
discover the new
17
e-Commerce
Cleaning solutions made easy online
• Empower our customers
• Anticipate their needs
• Enhance their experience
Good Experience Increase Revenue
• New customers
• New geographies
• Expand products
Lower Cost of Sale
• Self-service
• Reduce manual interventions
• Cost avoidance
18
Reconditioned Equipment
Attracting a New Set of Customers
19
New Commercial Recon Facility New e-Commerce Website
19
Attract & Retain Talent
Tennant Employee Value Proposition
1
2
3
Build a world-class talent acquisition function
Develop leadership & key talent capabilities
Align high-performance culture with
business strategy
Talent Management Focus
A Focus on
Stewardship
Strong
Legacy
Rewarding work
with opportunity
for career growth
4 Reward performance that creates value
Commitment
to Innovation
20
Sustainable Enterprise
21
Score 2012 CY
(‘13 Report)
2013 CY
(‘14 Report)
2014 CY
(‘15 Report)
Disclosure 68 80 95
Performance Band D C C
Industry Average 49/C 53/C 60/D
Tennant Corporate
Sustainability Report
552012-2014
362015
New Product Development
Strongest Product Pipeline Ever!
132016
22
M17
Battery Rider Sweeper/Scrubber
VERTICAL MARKETS
Logistics & Manufacturing
VALUE PROPOSITION
• Full single-pass cleaning capability
(sweeping/scrubbing) & fume-free operation
• ProPanel™ provides a high-visibility, operator-centric
interface with PerformanceView camera, operator
security log-in, safety checklists & onboard training
• Improved shrinkwrap recover answers significant
market need
23
ec-H2O NanoClean™
The Responsible Way to Clean
Next generation ec-H2O | Cleans more soils in more applications
HOW IT WORKS:ec-H2O™ SCRUBBERS | 2008-2015
$896 million+
cumulative revenue
8,000+
customers
30,000+
sites
77,000+
machines
24
Record Sales of $157M in 2015
ORBIO® Technologies
On-Site Generation Technology
FOCUS ON “3Cs”
CAMPUS | CHAINS | CONTRACTORS
Improving health and safety for the environment, employees
and people in their care while reducing costs.
GENERATES
cleaner & disinfectant/sanitizer on-site
25
Customer Insights
Reinventing the Way the World Cleans
EMOTIONAL
BENEFITS
FUNCTIONAL
BENEFITS
FEATURES &
BENEFITS
PRODUCTS SOLUTIONS
Traditional Approach
Voice of customer & needs
identification to shape new
product development
NEW Thinking
• Acknowledge the reality of our customer’s business
• Deploy new tools for better insights
• Think solutions, not just products
• Objective research from innovation experts
• Challenge status quo – new lens for opportunities
• Embrace a holistic view of our customers
26
• Lithium-Ion, Fuel Cell, etc.
• Improving cost & availability
• ROI for customer
• Reduced weight & footprint size
• Sustainability
• Productivity
• Game-changing solution
– +
Water RecyclingBattery Technologies Robotics (AGV)Asset Management
• Manage cleaning
programs better
• Fleet management
• Lower cost-to-clean
• Addresses labor costs
• Largest potential growth
opportunity
Advanced Product Development
Future Technologies
27
IRIS® Asset Management System
ON-BOARD MACHINE
DIAGNOSTICS
CUSTOMERS
• Manage cleaning
programs better
• Fleet management
• Lower cost-to-clean
• Increased Market
Differentiation
• Service Efficiency
• Customer Intimacy
28
Acquisitions
Strategic Filters
Sales & Service
Coverage
Technology
Platforms
Complementary
Products
Underserved
Markets
29
FINANCIAL
Summary
Reinventing the future of cleaning.
30
2015
SALES
GROSS MARGIN
R&D EXPENSE (% of sales)
Adjusted*
S&A EXPENSE (% of sales)
Adjusted*
OPERATING PROFIT
Adjusted*
OPERATING PROFIT MARGIN
Adjusted*
DILUTED EPS
2014 CHANGE
$811.8 M
43.0%
4.0%
30.6%
$68.1 M
8.4%
$2.49
$822.0 M
42.9%
3.6%
30.5%
$72.1 M
8.8%
$2.70
(1.2%)
+10 bps
+40 bps
+10 bps
(5.5%)
(40 bps)
(7.8%)
*2015 results are adjusted to exclude restructuring charge in S&A of $3.7M pre-tax ($0.17 per diluted
share) and non-cash long-lived asset impairment of $11.2M pre-tax ($0.58 per diluted share).
2015 Full Year
Organic Sales Growth 4.3% | Americas Sales up 6.4% Organically
31
SALES
GROSS MARGIN
Adjusted*
OPERATING PROFIT
Adjusted*
OPERATING PROFIT MARGIN
Adjusted*
DILUTED EPS
2015 2014 CHANGE
CONSTANT(1)
CURRENCY
2015
AS
REPORTED
(1)“Constant Currency”: estimated income statement which assumes no change in exchange rates from prior year.
*2015 results are adjusted to exclude restructuring charge in S&A of $3.7M pre-tax ($0.17 per diluted share) and non-cash
long-lived asset impairment of $11.2M pre-tax ($0.58 per diluted share).
$857.1 M
43.8%
$81.4 M
9.5%
$3.00
$822.0 M
42.9%
$72.1 M
8.8%
$2.70
+4.3%
+90 bps
+12.9%
+70 bps
+11.1%
$811.8 M
43.0%
$68.1 M
8.4%
$2.49
2015 Full Year “Constant Currency” View
(excludes estimated foreign exchange impact)
32
4.3% Organic Sales Growth in 2015 Full Year
APACEMEAAmericas
2015 Organic Sales
6.4%
2015 Organic Sales
(2.1%)
2015 Organic Sales
1.3%
33
34
SALES
GROSS MARGIN
R&D EXPENSE (% of sales)
S&A EXPENSE (% of sales)
OPERATING PROFIT
OPERATING PROFIT MARGIN
DILUTED EPS
Q1’16 Q1’15 CHANGE
$179.9 M
43.1%
4.4%
34.7%
$7.1 M
3.9%
$0.25
$185.7 M
42.0%
4.2%
33.4%
$8.3 M
4.4%
$0.27
(3.2%)
+110 bps
+20 bps
+130 bps
(14.0%)
(50 bps)
(7.4%)
TENNANT COMPANY
2016 First Quarter
Organic Sales Growth 0% | Americas Sales up 1.7% organically
35
SALES
GROSS MARGIN
OPERATING PROFIT
OPERATING PROFIT MARGIN
DILUTED EPS
Q1’16 Q1’15 CHANGE
$183.5 M
43.5%
$8.2 M
4.5%
$0.29
$185.7 M
42.0%
$8.3 M
4.4%
$0.27
(1.2%)*
+150 bps
(0.8%)
+10 bps
+7.4%
TENNANT COMPANY
2016 First Quarter
“CONSTANT CURRENCY” VIEW (excludes estimated foreign exchange impact)
CONSTANT(1)
CURRENCY
Q1’16
AS
REPORTED
$179.9 M
43.1%
$7.1 M
3.9%
$0.25
(1)“Constant Currency”: estimated income statement which assumes no change in exchange rates from prior year.
*Organic Sales Growth, excluding approximately 2.0% unfavorable foreign currency exchange impact and the impact from the divestiture of the
Green Machines outdoor city cleaning line of 1.2%, was 0%.
36
History of Sales Growth
2010-2015 Average Organic Sales Growth of 7%
36
$553
$599
$664
$701
$596
$668
$754 $739 $752
$822 $812
$0
$100
$200
$300
$400
$500
$600
$700
$800
2005 2006 2007 2008 2009 2010 2011 2012 2013 2014 2015 2016
‘16 Guidance
$795M
to
$825M
NETSALES(inmillions)
Organic Growth
8% 7% 6% 0%-4%<1.5%> <13%> 12% 10.5% 0% 3% 10.3% 4.3%
Anticipated
Organic Growth
37
TENNANT COMPANY
Strong Balance Sheet
Commitment To Shareholder Return
1Q’161Q’15FY’15
$223,102
$194,299
$214,423
$206,954
$212,016
$227,543
$223,940
8.8%
20.2%
25.7%
30.3% 30.9% 31.7%
30.3%
0.0%
5.0%
10.0%
15.0%
20.0%
25.0%
30.0%
35.0%
$170,000
$180,000
$190,000
$200,000
$210,000
$220,000
$230,000
$240,000
$000s
38
Improved Profitability & Balance Sheet Leverage
Return on Invested Capital Improvement 2009 – 2015*
*On a “Constant Currency” basis, 2015 ROIC would have been 33.7%.
‘09 ‘10 ‘15‘11 ‘12 ‘13 ‘14
AverageInvestedCapital
Adj OP
$19.5M
Adj OP
$39.2M
Adj OP
$55.2M
Adj OP
$62.7M
Adj OP
$65.4M
OP
$72.1M
Adj OP
$68.1M
38
Operating Profit Margin Goal
Drive organic revenue
growth in mid- to high-
single digits
39
Remain committed to at least 12% OP Margin
Hold fixed costs essentially flat in
manufacturing as volume rises
Strive for zero net inflation
at gross profit line
Standardize & simplify
processes to improve
scalability of business model
Continue to invest in
innovative new products
& technologies
S, G & A
Expense
27-28%
R&D
3-4%
Gross
Margins
43-44%
Sales
Growth
5-9%
2016 Financial Outlook
$2.25 to $2.55 | $795M to $825M
• Net sales in the range of $795M to $825M versus $811.8M in 2015.
• Slower economic growth in North America, modest improvement in
Europe, and growth in emerging markets.
• Foreign currency impact on sales in the range of an unfavorable 1%
to 2%.
• Sales decline from divestiture of approximately 1%.
• Organic sales growth, excluding foreign currency exchange impact
and divestiture, in the range of 0% to 4%.
• Foreign currency exchange headwinds estimated to negatively
impact operating profit in the range of $3M to $6M, or approximately
$0.10 to $0.20 EPS.
• Gross margin of approximately 43%.
• R&D expense of approximately 4% of sales.
• Effective tax rate of approximately 31% (negatively impacting 2016
by approximately $0.05 EPS).
• Capital expenditures in the range of $25M to $30M.
28
2016 EPS & Sales Guidance
2015 ACTUAL
$1.74
EPS
$811.8M
SALES
$2.49
EPS
$811.8M
SALES
As Reported As Adjusted
40
Summary
41
Anticipate foreign
currency & global
economic volatility
remain challenging
in coming quarters
Tennant has never been
positioned better in the
market with its innovative
product and technology
portfolio and go-to-
market strategy
We remain committed to
our goals of $1 Billion in
organic sales & a 12%
or above operating profit
margin
$1B

More Related Content

What's hot

Nestle Purina Power Point(withVideo)
Nestle Purina Power Point(withVideo)Nestle Purina Power Point(withVideo)
Nestle Purina Power Point(withVideo)
David Friedman
 
Apresentação de resultados q312 final en(1)
Apresentação de resultados q312 final en(1)Apresentação de resultados q312 final en(1)
Apresentação de resultados q312 final en(1)
vigor_ri
 
Apresentação en_1q14
Apresentação en_1q14Apresentação en_1q14
Apresentação en_1q14
Profarma
 
Td securities-forest-products-forum
Td securities-forest-products-forumTd securities-forest-products-forum
Td securities-forest-products-forum
greif2015
 
P&G Delivers at Top End of Increased Earnings Expectations
P&G Delivers at Top End of Increased Earnings ExpectationsP&G Delivers at Top End of Increased Earnings Expectations
P&G Delivers at Top End of Increased Earnings Expectations
finance3
 

What's hot (20)

Tnc q2 2016_earnings_presentation_final
Tnc q2 2016_earnings_presentation_finalTnc q2 2016_earnings_presentation_final
Tnc q2 2016_earnings_presentation_final
 
Tnc q1 2017_earnings_presentation_final
Tnc q1 2017_earnings_presentation_finalTnc q1 2017_earnings_presentation_final
Tnc q1 2017_earnings_presentation_final
 
Investor presentation march_2017
Investor presentation march_2017Investor presentation march_2017
Investor presentation march_2017
 
Tennant Q2 EARNINGS
Tennant Q2 EARNINGS Tennant Q2 EARNINGS
Tennant Q2 EARNINGS
 
Invest m nt presentation august 2016
Invest m nt presentation august 2016Invest m nt presentation august 2016
Invest m nt presentation august 2016
 
Q1 2015 Earnings Presentation
Q1 2015 Earnings PresentationQ1 2015 Earnings Presentation
Q1 2015 Earnings Presentation
 
Tnc q2 2015_earnings_presentation_final
Tnc q2 2015_earnings_presentation_finalTnc q2 2015_earnings_presentation_final
Tnc q2 2015_earnings_presentation_final
 
Baird november 2017_presentation
Baird november 2017_presentationBaird november 2017_presentation
Baird november 2017_presentation
 
1 q15
1 q151 q15
1 q15
 
Investor presentation nov. 2017
Investor presentation nov. 2017Investor presentation nov. 2017
Investor presentation nov. 2017
 
Clorox investor deck (fy18 q1)
Clorox investor deck (fy18 q1)Clorox investor deck (fy18 q1)
Clorox investor deck (fy18 q1)
 
2018 UBS Global Industrials and Transportation Conference Presentation
2018 UBS Global Industrials and Transportation Conference Presentation2018 UBS Global Industrials and Transportation Conference Presentation
2018 UBS Global Industrials and Transportation Conference Presentation
 
April/May 2018 Investor Presentation
April/May 2018 Investor PresentationApril/May 2018 Investor Presentation
April/May 2018 Investor Presentation
 
Nestle Purina Power Point(withVideo)
Nestle Purina Power Point(withVideo)Nestle Purina Power Point(withVideo)
Nestle Purina Power Point(withVideo)
 
May 2018 investor presentation
May 2018 investor presentationMay 2018 investor presentation
May 2018 investor presentation
 
Apresentação de resultados q312 final en(1)
Apresentação de resultados q312 final en(1)Apresentação de resultados q312 final en(1)
Apresentação de resultados q312 final en(1)
 
Apresentação en_1q14
Apresentação en_1q14Apresentação en_1q14
Apresentação en_1q14
 
Td securities-forest-products-forum
Td securities-forest-products-forumTd securities-forest-products-forum
Td securities-forest-products-forum
 
P&G Delivers at Top End of Increased Earnings Expectations
P&G Delivers at Top End of Increased Earnings ExpectationsP&G Delivers at Top End of Increased Earnings Expectations
P&G Delivers at Top End of Increased Earnings Expectations
 
Hershey CAGNY 2015
Hershey CAGNY 2015Hershey CAGNY 2015
Hershey CAGNY 2015
 

Similar to Investor presentation april_2016

Summit CTD Final rv4 web
Summit CTD Final rv4 webSummit CTD Final rv4 web
Summit CTD Final rv4 web
Lacey Anderson
 
Symantec Corporate Presentation
Symantec Corporate PresentationSymantec Corporate Presentation
Symantec Corporate Presentation
InvestorSymantec
 
Greif 2016 investor day
Greif 2016 investor dayGreif 2016 investor day
Greif 2016 investor day
greif2015
 

Similar to Investor presentation april_2016 (20)

Investor presentation may 2017
Investor presentation may 2017Investor presentation may 2017
Investor presentation may 2017
 
Investor presentation august_2017
Investor presentation august_2017Investor presentation august_2017
Investor presentation august_2017
 
Current Investor Presentation – May 2015
Current Investor Presentation – May 2015Current Investor Presentation – May 2015
Current Investor Presentation – May 2015
 
Jefferies presentation august 2016
Jefferies presentation august 2016Jefferies presentation august 2016
Jefferies presentation august 2016
 
Hi investor presentation 19_mar18 - final for print
Hi investor presentation 19_mar18 - final for printHi investor presentation 19_mar18 - final for print
Hi investor presentation 19_mar18 - final for print
 
Investor presentation feb 2015 short version
Investor presentation feb 2015 short versionInvestor presentation feb 2015 short version
Investor presentation feb 2015 short version
 
Summit CTD Final rv4 web
Summit CTD Final rv4 webSummit CTD Final rv4 web
Summit CTD Final rv4 web
 
Jefferies global industrials 2015 conf
Jefferies global industrials 2015 confJefferies global industrials 2015 conf
Jefferies global industrials 2015 conf
 
Achieving Your Promotional Objectives with Science, Forecasting, and Analytics
Achieving Your Promotional Objectives with Science, Forecasting, and AnalyticsAchieving Your Promotional Objectives with Science, Forecasting, and Analytics
Achieving Your Promotional Objectives with Science, Forecasting, and Analytics
 
Nokia Capital market Day Nov 2014 HERE Sean Fernback
Nokia Capital market Day Nov 2014 HERE Sean FernbackNokia Capital market Day Nov 2014 HERE Sean Fernback
Nokia Capital market Day Nov 2014 HERE Sean Fernback
 
Symantec Corporate Presentation
Symantec Corporate PresentationSymantec Corporate Presentation
Symantec Corporate Presentation
 
Hi presentation ubs conference 13_jun18_
Hi presentation ubs conference 13_jun18_Hi presentation ubs conference 13_jun18_
Hi presentation ubs conference 13_jun18_
 
Current Investor Presentation – November 2015
Current Investor Presentation – November 2015Current Investor Presentation – November 2015
Current Investor Presentation – November 2015
 
The InvestMNt 2015 Conference
The InvestMNt 2015 ConferenceThe InvestMNt 2015 Conference
The InvestMNt 2015 Conference
 
Greif 2016 investor day
Greif 2016 investor dayGreif 2016 investor day
Greif 2016 investor day
 
Customer Retention Strategies
Customer Retention StrategiesCustomer Retention Strategies
Customer Retention Strategies
 
Finance Transformation Agenda Resulting In Tangible Business Benefits
Finance Transformation Agenda Resulting In Tangible Business BenefitsFinance Transformation Agenda Resulting In Tangible Business Benefits
Finance Transformation Agenda Resulting In Tangible Business Benefits
 
Investor Presentation November 2014
Investor Presentation November 2014Investor Presentation November 2014
Investor Presentation November 2014
 
Confirmit: An Introduction
Confirmit: An IntroductionConfirmit: An Introduction
Confirmit: An Introduction
 
Aegon Americas strategy update
Aegon Americas strategy updateAegon Americas strategy update
Aegon Americas strategy update
 

More from TennantCorporation

More from TennantCorporation (12)

Tnc q2 2018_earnings_presentation--final
Tnc q2 2018_earnings_presentation--finalTnc q2 2018_earnings_presentation--final
Tnc q2 2018_earnings_presentation--final
 
Tnc q2 2018_earnings_presentation final
Tnc q2 2018_earnings_presentation finalTnc q2 2018_earnings_presentation final
Tnc q2 2018_earnings_presentation final
 
2018 tnc investor_presentation_may2018_final
2018 tnc investor_presentation_may2018_final2018 tnc investor_presentation_may2018_final
2018 tnc investor_presentation_may2018_final
 
2018 tnc investor_presentation_may2018_final
2018 tnc investor_presentation_may2018_final2018 tnc investor_presentation_may2018_final
2018 tnc investor_presentation_may2018_final
 
Tnc q1 2018_earnings_presentation final
Tnc q1 2018_earnings_presentation finalTnc q1 2018_earnings_presentation final
Tnc q1 2018_earnings_presentation final
 
2018 tnc investor_presentation_final_march-2018
2018 tnc investor_presentation_final_march-20182018 tnc investor_presentation_final_march-2018
2018 tnc investor_presentation_final_march-2018
 
2018 tnc investor_presentation_final_march2018
2018 tnc investor_presentation_final_march20182018 tnc investor_presentation_final_march2018
2018 tnc investor_presentation_final_march2018
 
Tnc q4 2017_earnings_presentation - updated
Tnc q4 2017_earnings_presentation - updatedTnc q4 2017_earnings_presentation - updated
Tnc q4 2017_earnings_presentation - updated
 
Baml presentation nov. 2017
Baml presentation nov. 2017Baml presentation nov. 2017
Baml presentation nov. 2017
 
Investor presentation nov. 2017
Investor presentation nov. 2017Investor presentation nov. 2017
Investor presentation nov. 2017
 
Tennant Company Reports 2017 Third Quarter Results
Tennant Company Reports 2017 Third Quarter ResultsTennant Company Reports 2017 Third Quarter Results
Tennant Company Reports 2017 Third Quarter Results
 
Jefferies aug. 2017 presentation
Jefferies aug. 2017 presentationJefferies aug. 2017 presentation
Jefferies aug. 2017 presentation
 

Recently uploaded

一比一原版CBU毕业证卡普顿大学毕业证成绩单如何办理
一比一原版CBU毕业证卡普顿大学毕业证成绩单如何办理一比一原版CBU毕业证卡普顿大学毕业证成绩单如何办理
一比一原版CBU毕业证卡普顿大学毕业证成绩单如何办理
btohy
 
一比一原版MQU毕业证麦考瑞大学毕业证成绩单如何办理
一比一原版MQU毕业证麦考瑞大学毕业证成绩单如何办理一比一原版MQU毕业证麦考瑞大学毕业证成绩单如何办理
一比一原版MQU毕业证麦考瑞大学毕业证成绩单如何办理
aytyn
 

Recently uploaded (10)

一比一原版CBU毕业证卡普顿大学毕业证成绩单如何办理
一比一原版CBU毕业证卡普顿大学毕业证成绩单如何办理一比一原版CBU毕业证卡普顿大学毕业证成绩单如何办理
一比一原版CBU毕业证卡普顿大学毕业证成绩单如何办理
 
Collective Mining | Corporate Presentation - May 2024
Collective Mining | Corporate Presentation - May 2024Collective Mining | Corporate Presentation - May 2024
Collective Mining | Corporate Presentation - May 2024
 
BRL - Investor Presentation - May 2024.pdf
BRL - Investor Presentation - May 2024.pdfBRL - Investor Presentation - May 2024.pdf
BRL - Investor Presentation - May 2024.pdf
 
Collective Mining | Corporate Presentation - May 2024
Collective Mining | Corporate Presentation - May 2024Collective Mining | Corporate Presentation - May 2024
Collective Mining | Corporate Presentation - May 2024
 
Investor Day 2024 Presentation Sysco 2024
Investor Day 2024 Presentation Sysco 2024Investor Day 2024 Presentation Sysco 2024
Investor Day 2024 Presentation Sysco 2024
 
cyberagent_For New Investors_EN_240424.pdf
cyberagent_For New Investors_EN_240424.pdfcyberagent_For New Investors_EN_240424.pdf
cyberagent_For New Investors_EN_240424.pdf
 
Investor Day 2024 Presentation Sysco 2024
Investor Day 2024 Presentation Sysco 2024Investor Day 2024 Presentation Sysco 2024
Investor Day 2024 Presentation Sysco 2024
 
Teck Investor Presentation - May 23, 2024
Teck Investor Presentation - May 23, 2024Teck Investor Presentation - May 23, 2024
Teck Investor Presentation - May 23, 2024
 
Investor Day 2024 Presentation Sysco 2024
Investor Day 2024 Presentation Sysco 2024Investor Day 2024 Presentation Sysco 2024
Investor Day 2024 Presentation Sysco 2024
 
一比一原版MQU毕业证麦考瑞大学毕业证成绩单如何办理
一比一原版MQU毕业证麦考瑞大学毕业证成绩单如何办理一比一原版MQU毕业证麦考瑞大学毕业证成绩单如何办理
一比一原版MQU毕业证麦考瑞大学毕业证成绩单如何办理
 

Investor presentation april_2016

  • 1. TENNANTCO.COM REINVENTING the future of cleaning. INVESTOR PRESENTATION April 2016
  • 2. This presentation contains certain statements that are considered “forward-looking statements” within the meaning of the Private Securities Litigation Reform Act of 1995. Forward-looking statements generally can be identified by the use of forward-looking terminology such as “may,” “will,” “expect,” “intend,” “estimate,” “anticipate,” “believe,” “project,” or “continue” or similar words or the negative thereof. These statements do not relate to strictly historical or current facts and provide current expectations of forecasts of future events. Any such expectations or forecasts of future events are subject to a variety of factors. We caution that forward-looking statements must be considered carefully and that actual results may differ in material ways due to risks and uncertainties both known and unknown. Information about factors that could materially affect our results can be found in Part I, Item 1A, Risk Factors in our Annual Report on Form 10-K for the year ended December 31, 2015. Shareholders and potential investors are urged to consider these factors in evaluating forward-looking statements and are cautioned not to place undue reliance on such forward-looking statements. We undertake no obligation to update or revise any forward-looking statement, whether as a result of new information, future events or otherwise. Investors are advised to consult any further disclosures by us in our filings with the Securities and Exchange Commission and in other written statements on related subjects. It is not possible to anticipate or foresee all risk factors, and investors should not consider any list of such factors to be an exhaustive or complete list of all risks or uncertainties. Safe Harbor Statement 2
  • 3. About Tennant Company Tennant Company, a Minnesota corporation founded in 1870 and incorporated in 1909, is a world leader in designing, manufacturing and marketing solutions that empower customers to achieve quality cleaning performance, significantly reduce environmental impact and help create a cleaner, safer, healthier world. 70consecutive years of cash dividends 44consecutive years of increase in annual cash dividend payout Balance sheet NYSE Symbol: TNC 2015 Revenues: $812M 3 2015 Employees: 3,164
  • 4. OUR VISION We will lead our global industry in sustainable cleaning innovation that empowers our customers to create a cleaner, safer and healthier world. 4
  • 5. 5 Competitive Landscape 2011 Global Market Size – $4.6 Billion* 17%Tennant | Nobles | Alfa Nilfisk | Clarke | Viper Hako | Minuteman | PowerBoss Karcher | Windsor | TecServ | ProChem Taski of the market consists of others with a market share of 3% or less *Market share data is based on company revenue and estimates for like categories 18% 12% 7% 4% 42% 5
  • 6. Broad Portfolio of Quality Products COMMERCIAL INDUSTRIAL AFTERMARKET ESSENTIALS ORBIO® TECHNOLOGIES COATINGS 6
  • 7. STRONG DIRECT SALES & SERVICE ORGANIZATIONS Strong Direct Sales & Service Organizations Global Sales Employees Global Direct Service EmployeesGlobal Revenue by Sales Channel 25% 75% Distribution Direct Distribution Partners More than 80 countries around the world Global Strategic Accounts Cross-functional teams & market specialists Factory-Service Direct Locally based & factory-trained service technicians 0 100 200 300 400 500 600 2012 2013 2014 2015 Americas EMEA APAC 0 100 200 300 400 500 600 700 800 900 2012 2013 2014 2015 Americas EMEA APAC 7
  • 8. 8 Broad Range of Global Customers MARKETS 8
  • 9. 9 2015 Revenue of $812M 73% 17% 10% Americas EMEA APACNet Sales by Geography 22% 14% 61% 3% Service & Other Equipment* Coatings Net Sales by Product Group Parts & Consumables *Equipment Mix Commercial | 52% Industrial | 44% Outdoor | 4% 9
  • 10. We remain committed to organic Sales goal of $1 Billion and 12% or above Operating Profit Margin Growth Strategy 10 • Reach new markets and new customers • Deliver a strong product & technology pipeline • Build Tennant’s e-Business capabilities • Be disciplined about improving margins & controlling expenses
  • 11. $1B $752M GDP Growth $60M (2%) Go-To-Market $70M (up to 3%) New Products $80M(up to 3%) Emerging Markets $40M (up to 2%) 11 Our Journey to $1 Billion 11
  • 12. Our Progress toward $1 Billion 12 Growth from over- delivery on new products & go-to- market initiatives partially offset by major foreign currency headwinds
  • 14. Sales & Service Coverage Increasing our Presence ×Education Healthcare Industrial Retail ENHANCED GO-TO-MARKET STRATEGY3 COMPONENTS OF MARKET SHARE Product Portfolio Market Coverage (Presence) Hit Rate VERTICAL MARKETS & MARKETING ANALYTICS 14
  • 15. Emerging Markets China Brazil • Focused approach • Long-term growth potential despite economic headwinds Organic Sales Growth 15 2014 3.5% 2015 3.5% 2014 15% 2015 5.5% Organic Sales Growth
  • 16. Operations Efficiency Strategy Deployment to Drive Four Key Initiatives VELOCITY & LEAN Be the absolute leader for serving the customer! SERVICE LEVELS SUPPLY CHAIN OPTIMIZATION QUALITY FOCUS 16
  • 17. CRM & Marketing Automation Perpetual Lead Generation Speed-to-Lead • Better lead visibility and new processes mean we can convert leads faster • Keep the lead pipeline full with automated marketing capabilities embedded inside CRM Prospecting • Leverage deep history to prioritize the known • Visualize the potential to discover the new 17
  • 18. e-Commerce Cleaning solutions made easy online • Empower our customers • Anticipate their needs • Enhance their experience Good Experience Increase Revenue • New customers • New geographies • Expand products Lower Cost of Sale • Self-service • Reduce manual interventions • Cost avoidance 18
  • 19. Reconditioned Equipment Attracting a New Set of Customers 19 New Commercial Recon Facility New e-Commerce Website 19
  • 20. Attract & Retain Talent Tennant Employee Value Proposition 1 2 3 Build a world-class talent acquisition function Develop leadership & key talent capabilities Align high-performance culture with business strategy Talent Management Focus A Focus on Stewardship Strong Legacy Rewarding work with opportunity for career growth 4 Reward performance that creates value Commitment to Innovation 20
  • 21. Sustainable Enterprise 21 Score 2012 CY (‘13 Report) 2013 CY (‘14 Report) 2014 CY (‘15 Report) Disclosure 68 80 95 Performance Band D C C Industry Average 49/C 53/C 60/D Tennant Corporate Sustainability Report
  • 22. 552012-2014 362015 New Product Development Strongest Product Pipeline Ever! 132016 22
  • 23. M17 Battery Rider Sweeper/Scrubber VERTICAL MARKETS Logistics & Manufacturing VALUE PROPOSITION • Full single-pass cleaning capability (sweeping/scrubbing) & fume-free operation • ProPanel™ provides a high-visibility, operator-centric interface with PerformanceView camera, operator security log-in, safety checklists & onboard training • Improved shrinkwrap recover answers significant market need 23
  • 24. ec-H2O NanoClean™ The Responsible Way to Clean Next generation ec-H2O | Cleans more soils in more applications HOW IT WORKS:ec-H2O™ SCRUBBERS | 2008-2015 $896 million+ cumulative revenue 8,000+ customers 30,000+ sites 77,000+ machines 24 Record Sales of $157M in 2015
  • 25. ORBIO® Technologies On-Site Generation Technology FOCUS ON “3Cs” CAMPUS | CHAINS | CONTRACTORS Improving health and safety for the environment, employees and people in their care while reducing costs. GENERATES cleaner & disinfectant/sanitizer on-site 25
  • 26. Customer Insights Reinventing the Way the World Cleans EMOTIONAL BENEFITS FUNCTIONAL BENEFITS FEATURES & BENEFITS PRODUCTS SOLUTIONS Traditional Approach Voice of customer & needs identification to shape new product development NEW Thinking • Acknowledge the reality of our customer’s business • Deploy new tools for better insights • Think solutions, not just products • Objective research from innovation experts • Challenge status quo – new lens for opportunities • Embrace a holistic view of our customers 26
  • 27. • Lithium-Ion, Fuel Cell, etc. • Improving cost & availability • ROI for customer • Reduced weight & footprint size • Sustainability • Productivity • Game-changing solution – + Water RecyclingBattery Technologies Robotics (AGV)Asset Management • Manage cleaning programs better • Fleet management • Lower cost-to-clean • Addresses labor costs • Largest potential growth opportunity Advanced Product Development Future Technologies 27
  • 28. IRIS® Asset Management System ON-BOARD MACHINE DIAGNOSTICS CUSTOMERS • Manage cleaning programs better • Fleet management • Lower cost-to-clean • Increased Market Differentiation • Service Efficiency • Customer Intimacy 28
  • 29. Acquisitions Strategic Filters Sales & Service Coverage Technology Platforms Complementary Products Underserved Markets 29
  • 31. 2015 SALES GROSS MARGIN R&D EXPENSE (% of sales) Adjusted* S&A EXPENSE (% of sales) Adjusted* OPERATING PROFIT Adjusted* OPERATING PROFIT MARGIN Adjusted* DILUTED EPS 2014 CHANGE $811.8 M 43.0% 4.0% 30.6% $68.1 M 8.4% $2.49 $822.0 M 42.9% 3.6% 30.5% $72.1 M 8.8% $2.70 (1.2%) +10 bps +40 bps +10 bps (5.5%) (40 bps) (7.8%) *2015 results are adjusted to exclude restructuring charge in S&A of $3.7M pre-tax ($0.17 per diluted share) and non-cash long-lived asset impairment of $11.2M pre-tax ($0.58 per diluted share). 2015 Full Year Organic Sales Growth 4.3% | Americas Sales up 6.4% Organically 31
  • 32. SALES GROSS MARGIN Adjusted* OPERATING PROFIT Adjusted* OPERATING PROFIT MARGIN Adjusted* DILUTED EPS 2015 2014 CHANGE CONSTANT(1) CURRENCY 2015 AS REPORTED (1)“Constant Currency”: estimated income statement which assumes no change in exchange rates from prior year. *2015 results are adjusted to exclude restructuring charge in S&A of $3.7M pre-tax ($0.17 per diluted share) and non-cash long-lived asset impairment of $11.2M pre-tax ($0.58 per diluted share). $857.1 M 43.8% $81.4 M 9.5% $3.00 $822.0 M 42.9% $72.1 M 8.8% $2.70 +4.3% +90 bps +12.9% +70 bps +11.1% $811.8 M 43.0% $68.1 M 8.4% $2.49 2015 Full Year “Constant Currency” View (excludes estimated foreign exchange impact) 32
  • 33. 4.3% Organic Sales Growth in 2015 Full Year APACEMEAAmericas 2015 Organic Sales 6.4% 2015 Organic Sales (2.1%) 2015 Organic Sales 1.3% 33
  • 34. 34 SALES GROSS MARGIN R&D EXPENSE (% of sales) S&A EXPENSE (% of sales) OPERATING PROFIT OPERATING PROFIT MARGIN DILUTED EPS Q1’16 Q1’15 CHANGE $179.9 M 43.1% 4.4% 34.7% $7.1 M 3.9% $0.25 $185.7 M 42.0% 4.2% 33.4% $8.3 M 4.4% $0.27 (3.2%) +110 bps +20 bps +130 bps (14.0%) (50 bps) (7.4%) TENNANT COMPANY 2016 First Quarter Organic Sales Growth 0% | Americas Sales up 1.7% organically
  • 35. 35 SALES GROSS MARGIN OPERATING PROFIT OPERATING PROFIT MARGIN DILUTED EPS Q1’16 Q1’15 CHANGE $183.5 M 43.5% $8.2 M 4.5% $0.29 $185.7 M 42.0% $8.3 M 4.4% $0.27 (1.2%)* +150 bps (0.8%) +10 bps +7.4% TENNANT COMPANY 2016 First Quarter “CONSTANT CURRENCY” VIEW (excludes estimated foreign exchange impact) CONSTANT(1) CURRENCY Q1’16 AS REPORTED $179.9 M 43.1% $7.1 M 3.9% $0.25 (1)“Constant Currency”: estimated income statement which assumes no change in exchange rates from prior year. *Organic Sales Growth, excluding approximately 2.0% unfavorable foreign currency exchange impact and the impact from the divestiture of the Green Machines outdoor city cleaning line of 1.2%, was 0%.
  • 36. 36 History of Sales Growth 2010-2015 Average Organic Sales Growth of 7% 36 $553 $599 $664 $701 $596 $668 $754 $739 $752 $822 $812 $0 $100 $200 $300 $400 $500 $600 $700 $800 2005 2006 2007 2008 2009 2010 2011 2012 2013 2014 2015 2016 ‘16 Guidance $795M to $825M NETSALES(inmillions) Organic Growth 8% 7% 6% 0%-4%<1.5%> <13%> 12% 10.5% 0% 3% 10.3% 4.3% Anticipated Organic Growth
  • 37. 37 TENNANT COMPANY Strong Balance Sheet Commitment To Shareholder Return 1Q’161Q’15FY’15
  • 38. $223,102 $194,299 $214,423 $206,954 $212,016 $227,543 $223,940 8.8% 20.2% 25.7% 30.3% 30.9% 31.7% 30.3% 0.0% 5.0% 10.0% 15.0% 20.0% 25.0% 30.0% 35.0% $170,000 $180,000 $190,000 $200,000 $210,000 $220,000 $230,000 $240,000 $000s 38 Improved Profitability & Balance Sheet Leverage Return on Invested Capital Improvement 2009 – 2015* *On a “Constant Currency” basis, 2015 ROIC would have been 33.7%. ‘09 ‘10 ‘15‘11 ‘12 ‘13 ‘14 AverageInvestedCapital Adj OP $19.5M Adj OP $39.2M Adj OP $55.2M Adj OP $62.7M Adj OP $65.4M OP $72.1M Adj OP $68.1M 38
  • 39. Operating Profit Margin Goal Drive organic revenue growth in mid- to high- single digits 39 Remain committed to at least 12% OP Margin Hold fixed costs essentially flat in manufacturing as volume rises Strive for zero net inflation at gross profit line Standardize & simplify processes to improve scalability of business model Continue to invest in innovative new products & technologies S, G & A Expense 27-28% R&D 3-4% Gross Margins 43-44% Sales Growth 5-9%
  • 40. 2016 Financial Outlook $2.25 to $2.55 | $795M to $825M • Net sales in the range of $795M to $825M versus $811.8M in 2015. • Slower economic growth in North America, modest improvement in Europe, and growth in emerging markets. • Foreign currency impact on sales in the range of an unfavorable 1% to 2%. • Sales decline from divestiture of approximately 1%. • Organic sales growth, excluding foreign currency exchange impact and divestiture, in the range of 0% to 4%. • Foreign currency exchange headwinds estimated to negatively impact operating profit in the range of $3M to $6M, or approximately $0.10 to $0.20 EPS. • Gross margin of approximately 43%. • R&D expense of approximately 4% of sales. • Effective tax rate of approximately 31% (negatively impacting 2016 by approximately $0.05 EPS). • Capital expenditures in the range of $25M to $30M. 28 2016 EPS & Sales Guidance 2015 ACTUAL $1.74 EPS $811.8M SALES $2.49 EPS $811.8M SALES As Reported As Adjusted 40
  • 41. Summary 41 Anticipate foreign currency & global economic volatility remain challenging in coming quarters Tennant has never been positioned better in the market with its innovative product and technology portfolio and go-to- market strategy We remain committed to our goals of $1 Billion in organic sales & a 12% or above operating profit margin $1B