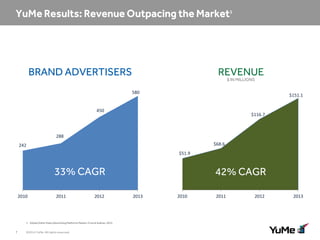
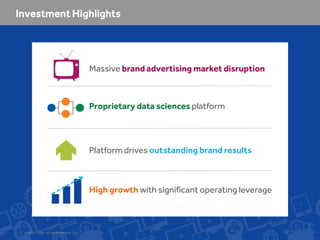
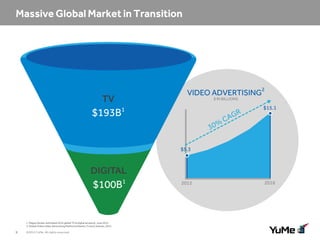
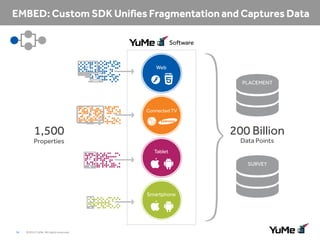
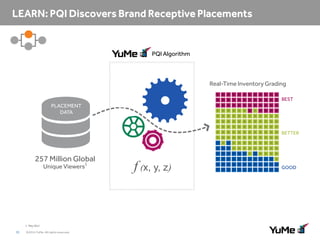
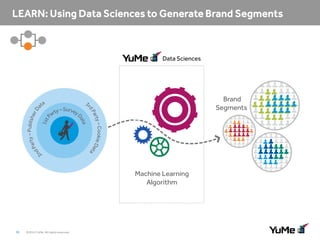
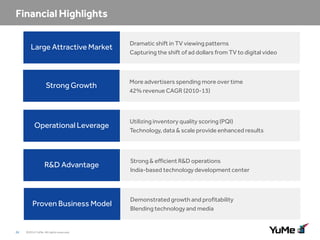
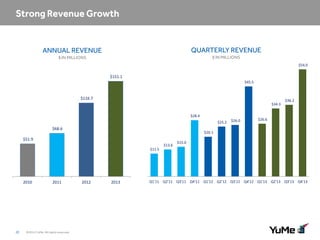
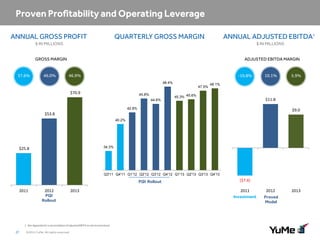
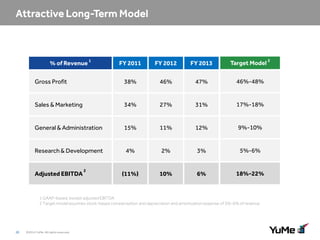
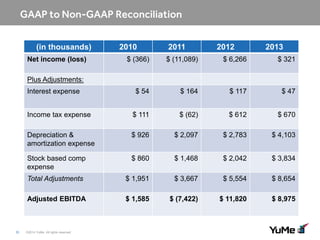
SlideShare a Scribd company logo
Investor Overview
March 2014
The Science Behind Influence
FORWARD-LOOKING STATEMENTS
This presentation contains forward-looking statements. All statements other than statements of historical fact contained in this
presentation are forward-looking statements. These statements are only current predictions and are subject to known and unknown
risks, uncertainties, assumptions, and other factors that may cause our results or our industry’s actual results, levels of activity,
performance or achievements to be materially different from those anticipated by the forward-looking statements. These forwardlooking statements are subject to a number of risks, including those described under the heading “Risk Factors” in our periodic
reports filed with the U.S. Securities and Exchange Commission, including our Form 10-Q for the quarter ended September 30, 2013,
and in our future filings and reports with the SEC, including our Annual Report on Form 10-K for the year ended December 31, 2013. .
Moreover, new risks emerge periodically. It is not possible for us to predict all risks, nor can we assess the impact of all factors on our
business or the extent to which any factor, or combination of factors, may cause actual results to differ materially from those
contained in any forward-looking statements we may make. Actual results could differ materially and adversely from those
anticipated or implied in the forward-looking statements. You should not rely upon forward-looking statements as predictions of
future events. Except as required by law, we are under no duty to update or revise any of the forward-looking statements, whether
as a results of new information, future events or otherwise, after the date of this presentation.
In addition to the U.S. GAAP financials, this presentation includes certain non-GAAP financial measures. These non-GAAP financial
measures are in addition to, and not a substitute for or superior to measures of financial performance prepared in accordance with
U.S. GAAP. See Appendix for reconciliation between each non-GAAP measure and the most comparable GAAP measure.
This presentation contains statistical data that we obtained from industry publications and reports generated by third parties.
Although we believe that the publications and reports are reliable, we have not independently verified this statistical data.

1

©2014 YuMe. All rights reserved.
Overview

2

©2014 YuMe. All rights reserved.
Yesterday
3

3

©2013 YuMe. All rights reserved.
©2014 YuMe. All rights reserved.
Today
4

©2014 YuMe. All rights reserved.
One Screen at Primetime

Multi-Screen Video All the Time

And it’s Happened Before –
Newspaper

5

©2014 YuMe. All rights reserved.

Web

Yellow Pages &
Local Advertising

Search
Media
Strategy

Television

Digital
Video

Reach & Frequency

Data & Analytics

+

6

©2014 YuMe. All rights reserved.
BRAND ADVERTISERS

REVENUE
$ IN MILLIONS

580

$151.1

450

$116.7

288
$68.6

242
$51.9

33% CAGR
2010

2011

2012

1 Global Online Video Advertising Platforms Market, Frost & Sullivan, 2013.

7

©2014 YuMe. All rights reserved.

42% CAGR
2013

2010

2011

2012

2013
Massive brand advertising market disruption

Proprietary data sciences platform

Platform drives outstanding brand results

High growth with significant operating leverage

8

©2014 YuMe. All rights reserved.
2

VIDEO ADVERTISING

TV

$ IN BILLIONS

$15.1

$193B

1

$5.3

DIGITAL

$100B1

1 Magna Global, estimated 2012 global TV & digital ad spend, June 2013
2 Global Online Video Advertising Platforms Market, Frost & Sullivan, 2013.

9

©2014 YuMe. All rights reserved.

2012

2016
2 Billion

Share of Time Spent1
80%

TV

Smartphones3

DIGITAL

70%

60%

332 Million

50%

Tablets Shipped4

40%

30%

500 Million

20%

Connected TVs5

10%

0%

1995
1 MagnaGlobal, 2012
2 Includes Internet & mobile devices

10

©2014 YuMe. All rights reserved.

2003
3 Total by 2015, Strategy Analytics 2012
4 Shipped in 2015, IDC 2013

2012
5 Total by 2015, DisplaySearch, 2011
Content

Screen
Devices
per person

TV 1-5

Cable 5-500

Internet >10,000
2000

Data

11

©2014 YuMe. All rights reserved.

2012

Technology
BRAND CHALLENGES
Data
Which screen
should I target?

12

©2014 YuMe. All rights reserved.

On which
placements
should my
ads run?

How do I find
people
receptive to
my message?
SOLUTION
LEARN
Placement

EMBED

DELIVER

LEARN
Audience

13

©2014 YuMe. All rights reserved.
Software

Web
PLACEMENT

Connected TV

200 Billion

1,500

Data Points

Properties
Tablet

SURVEY

Smartphone

14

©2014 YuMe. All rights reserved.
PQI Algorithm

Real-Time Inventory Grading
BEST

PLACEMENT
DATA

BETTER

257 Million Global
Unique Viewers1

1 May 2013

15

©2014 YuMe. All rights reserved.

f (x, y, z)

GOOD
Data Sciences

Brand
Segments

Machine Learning
Algorithm

16

©2014 YuMe. All rights reserved.
AUDIENCE AMPLIFIER

PQI Inventory

Brand Segments

17

©2014 YuMe. All rights reserved.
Reach
More
Efficient
Brand Spend
Television

Spend
18

©2014 YuMe. All rights reserved.
16% TV Budget Shift to YuMe
Reaching Adults 35-54
15.9 Million
YuMe

Reach and Frequency Results

Exclusive Online Reach

6M

Total Reach
Cross Platform Reach

19

©2014 YuMe. All rights reserved.

+23%

Average Frequency

42.7 Million TV

+14%

+18%
Brand Awareness

1

72.5%

1

Overall CPG Brand Lift

Purchase Intent

1

7x

71.2%
Norm

CONSUMER GOODS

AUTOMOTIVE

1 Data from Nielsen Online Brand Effect (formerly Vizu Ad Catalyst)

20

©2014 YuMe. All rights reserved.

TELECOM &
ELECTRONICS

FINANCIAL

ENTERTAINMENT
Expand share of wallet

Grow customer base

Expand global footprint

Pursue strategic acquisitions

21

©2014 YuMe. All rights reserved.
Ayyappan Sankaran

Tim Laehy

CEO and Co-Founder

CTO and Co-Founder

CFO

Frank Barbieri

Scot McLernon

Corporate Development

Sales

Bryan Everett

Michael Hudes

Jayant Kadambi

Business Development

22

©2014 YuMe. All rights reserved.

Emerging Markets

Ed Haslam
Marketing

Paul Porrini
General Counsel
Financial Overview

23

©2014 YuMe. All rights reserved.
Large Attractive Market

Strong Growth

Operational Leverage

R&D Advantage

Proven Business Model

24

©2014 YuMe. All rights reserved.

Dramatic shift in TV viewing patterns
Capturing the shift of ad dollars from TV to digital video

More advertisers spending more over time
42% revenue CAGR (2010-13)

Utilizing inventory quality scoring (PQI)
Technology, data & scale provide enhanced results

Strong & efficient R&D operations
India-based technology development center

Demonstrated growth and profitability
Blending technology and media
ANNUAL REVENUE

QUARTERLY REVENUE

$ IN MILLIONS

$ IN MILLIONS
$54.0

$151.1
$45.5

$116.7
$34.3
$28.4
$25.2

$68.6

$26.0

$36.2

$26.6

$20.1

$51.9
$13.6

$15.0

$11.5

2010

25

2011

©2014 YuMe. All rights reserved.

2012

2013

Q1'11 Q2'11 Q3'11 Q4'11 Q1'12 Q2'12 Q3'12 Q4'12 Q1'13 Q2'13 Q3'13 Q4'13
TOTAL ADVERTISERS

REVENUE PER ADVERTISER
$ IN 000s

580

$257

REVENUE FROM
TOP 20 ADVERTISERS
$ IN MILLIONS

$255
$58.6

$61.9

449
$237

$37.2
$26.9

288
242

2010

26

$213
2011

2012

©2014 YuMe. All rights reserved.

2013

2010

2011

2012

2013

2010

2011

2012

2013
ANNUAL GROSS PROFIT

QUARTERLY GROSS MARGIN

ANNUAL ADJUSTED EBITDA1

$ IN MILLIONS

$ IN MILLIONS

GROSS MARGIN

37.6%

46.0%

ADJUSTED EBITDA MARGIN

3.1%
-10.8%

46.9%
48.4%
47.5%

$70.9

45.8%
44.6%

(10.8%)
10.1%

10.1%
5.9%

48.1%

45.3% 45.6%

$11.8

42.8%

$9.0

$53.8
40.2%

34.3%

$25.8

Q3'11 Q4'11 Q1'12 Q2'12 Q3'12 Q4'12 Q1'13 Q2'13 Q3'13 Q4'13

PQI Rollout
2011

2012
PQI
Rollout

2013

1 See Appendix for a reconciliation of adjusted EBITA to net income (loss)

27

©2014 YuMe. All rights reserved.

($7.4)
2011
Investment

2012
Proved
Model

2013
FY 2011

FY 2012

FY 2013

Target Model 2

Gross Profit

38%

46%

47%

46%-48%

Sales & Marketing

34%

27%

31%

17%-18%

General & Administration

15%

11%

12%

9%-10%

Research & Development

4%

2%

3%

5%-6%

(11%)

10%

6%

18%-22%

% of Revenue 1

Adjusted EBITDA

2

1 GAAP-based, except adjusted EBITDA
2 Target model assumes stock-based compensation and depreciation and amortization expense of 5%-6% of revenue

28

©2014 YuMe. All rights reserved.
In Conclusion

29

©2014 YuMe. All rights reserved.
Massive disrupted market

Differentiated data sciences platform

High growth with significant operating leverage

30

©2014 YuMe. All rights reserved.
YUME/NYSE

31

©2014 YuMe. All rights reserved.
APPENDIX

32

©2014 YuMe. All rights reserved.
(in thousands)
Net income (loss)

2010

2011

2012

2013

$ (366)

$ (11,089)

$ 6,266

$ 321

$ 54

$ 164

$ 117

$ 47

Income tax expense

$ 111

$ (62)

$ 612

$ 670

Depreciation &
amortization expense

$ 926

$ 2,097

$ 2,783

$ 4,103

Stock based comp
expense

$ 860

$ 1,468

$ 2,042

$ 3,834

Total Adjustments

$ 1,951

$ 3,667

$ 5,554

$ 8,654

Adjusted EBITDA

$ 1,585

$ (7,422)

$ 11,820

$ 8,975

Plus Adjustments:
Interest expense

33

©2014 YuMe. All rights reserved.

More Related Content

What's hot

Across Health Multichannel Maturometer 2020
Across Health Multichannel Maturometer 2020Across Health Multichannel Maturometer 2020
Across Health Multichannel Maturometer 2020
Across Health
 
Analitiği Kullanarak Yüksek Performans Göstermek ve Lider Olmak Hakan Yılmaz...
Analitiği Kullanarak Yüksek Performans Göstermek ve Lider Olmak  Hakan Yılmaz...Analitiği Kullanarak Yüksek Performans Göstermek ve Lider Olmak  Hakan Yılmaz...
Analitiği Kullanarak Yüksek Performans Göstermek ve Lider Olmak Hakan Yılmaz...
Webrazzi
 
Aten q2-earnings
Aten q2-earningsAten q2-earnings
Aten q2-earnings
A10_Networks_IR
 
Inst investor deck 08.04.2017 no video
Inst investor deck 08.04.2017 no videoInst investor deck 08.04.2017 no video
Inst investor deck 08.04.2017 no video
Instructure
 
Navigator365™ advanced uses
Navigator365™ advanced usesNavigator365™ advanced uses
Navigator365™ advanced uses
Across Health
 
Logm investor presentation q1 2015
Logm investor presentation q1 2015Logm investor presentation q1 2015
Logm investor presentation q1 2015
irlogmein
 
The Catalyst @ Health 2.0/Wipfli Survey on the State of Digital Health Result...
The Catalyst @ Health 2.0/Wipfli Survey on the State of Digital Health Result...The Catalyst @ Health 2.0/Wipfli Survey on the State of Digital Health Result...
The Catalyst @ Health 2.0/Wipfli Survey on the State of Digital Health Result...
health2dev
 
Navigating the multichannel maze in COVID-19 times – key tactics: pitfalls an...
Navigating the multichannel maze in COVID-19 times – key tactics: pitfalls an...Navigating the multichannel maze in COVID-19 times – key tactics: pitfalls an...
Navigating the multichannel maze in COVID-19 times – key tactics: pitfalls an...
Across Health
 
C19: Respond, recover & reimagine the future of HCP engagement
C19: Respond, recover & reimagine the future of HCP engagementC19: Respond, recover & reimagine the future of HCP engagement
C19: Respond, recover & reimagine the future of HCP engagement
Across Health
 
Arts & entertainment
Arts & entertainmentArts & entertainment
Arts & entertainment
Asphri457
 
World Quality Report 2015 - 16
World Quality Report 2015 - 16World Quality Report 2015 - 16
World Quality Report 2015 - 16
Piotr Kula
 
Q2 fy15 atento earnings presentation final
Q2 fy15 atento earnings presentation   finalQ2 fy15 atento earnings presentation   final
Q2 fy15 atento earnings presentation final
investorsatento
 
LX Ventures November Investor Presentation
LX Ventures November Investor PresentationLX Ventures November Investor Presentation
LX Ventures November Investor Presentation
mmadvisory
 
Across Health Multichannel Maturometer 2015
Across Health Multichannel Maturometer 2015Across Health Multichannel Maturometer 2015
Across Health Multichannel Maturometer 2015
Across Health
 
Shareholder meeting-2013-slides
Shareholder meeting-2013-slidesShareholder meeting-2013-slides
Shareholder meeting-2013-slides
InvestorOracle
 
Apple Operating and Financial Metrics Review – July 2014
Apple Operating and Financial Metrics Review – July 2014Apple Operating and Financial Metrics Review – July 2014
Apple Operating and Financial Metrics Review – July 2014
Jan Dawson
 
Google.value.analysis.for.business.growth
Google.value.analysis.for.business.growthGoogle.value.analysis.for.business.growth
Google.value.analysis.for.business.growth
Shekhar Bhartiya
 
Omnichannel launch excellence in the never normal
Omnichannel launch excellence in the never normalOmnichannel launch excellence in the never normal
Omnichannel launch excellence in the never normal
Across Health
 
Google Q1 2015 earnings deck
Google Q1 2015 earnings deckGoogle Q1 2015 earnings deck
Google Q1 2015 earnings deck
Jan Dawson
 

What's hot (19)

Across Health Multichannel Maturometer 2020
Across Health Multichannel Maturometer 2020Across Health Multichannel Maturometer 2020
Across Health Multichannel Maturometer 2020
 
Analitiği Kullanarak Yüksek Performans Göstermek ve Lider Olmak Hakan Yılmaz...
Analitiği Kullanarak Yüksek Performans Göstermek ve Lider Olmak  Hakan Yılmaz...Analitiği Kullanarak Yüksek Performans Göstermek ve Lider Olmak  Hakan Yılmaz...
Analitiği Kullanarak Yüksek Performans Göstermek ve Lider Olmak Hakan Yılmaz...
 
Aten q2-earnings
Aten q2-earningsAten q2-earnings
Aten q2-earnings
 
Inst investor deck 08.04.2017 no video
Inst investor deck 08.04.2017 no videoInst investor deck 08.04.2017 no video
Inst investor deck 08.04.2017 no video
 
Navigator365™ advanced uses
Navigator365™ advanced usesNavigator365™ advanced uses
Navigator365™ advanced uses
 
Logm investor presentation q1 2015
Logm investor presentation q1 2015Logm investor presentation q1 2015
Logm investor presentation q1 2015
 
The Catalyst @ Health 2.0/Wipfli Survey on the State of Digital Health Result...
The Catalyst @ Health 2.0/Wipfli Survey on the State of Digital Health Result...The Catalyst @ Health 2.0/Wipfli Survey on the State of Digital Health Result...
The Catalyst @ Health 2.0/Wipfli Survey on the State of Digital Health Result...
 
Navigating the multichannel maze in COVID-19 times – key tactics: pitfalls an...
Navigating the multichannel maze in COVID-19 times – key tactics: pitfalls an...Navigating the multichannel maze in COVID-19 times – key tactics: pitfalls an...
Navigating the multichannel maze in COVID-19 times – key tactics: pitfalls an...
 
C19: Respond, recover & reimagine the future of HCP engagement
C19: Respond, recover & reimagine the future of HCP engagementC19: Respond, recover & reimagine the future of HCP engagement
C19: Respond, recover & reimagine the future of HCP engagement
 
Arts & entertainment
Arts & entertainmentArts & entertainment
Arts & entertainment
 
World Quality Report 2015 - 16
World Quality Report 2015 - 16World Quality Report 2015 - 16
World Quality Report 2015 - 16
 
Q2 fy15 atento earnings presentation final
Q2 fy15 atento earnings presentation   finalQ2 fy15 atento earnings presentation   final
Q2 fy15 atento earnings presentation final
 
LX Ventures November Investor Presentation
LX Ventures November Investor PresentationLX Ventures November Investor Presentation
LX Ventures November Investor Presentation
 
Across Health Multichannel Maturometer 2015
Across Health Multichannel Maturometer 2015Across Health Multichannel Maturometer 2015
Across Health Multichannel Maturometer 2015
 
Shareholder meeting-2013-slides
Shareholder meeting-2013-slidesShareholder meeting-2013-slides
Shareholder meeting-2013-slides
 
Apple Operating and Financial Metrics Review – July 2014
Apple Operating and Financial Metrics Review – July 2014Apple Operating and Financial Metrics Review – July 2014
Apple Operating and Financial Metrics Review – July 2014
 
Google.value.analysis.for.business.growth
Google.value.analysis.for.business.growthGoogle.value.analysis.for.business.growth
Google.value.analysis.for.business.growth
 
Omnichannel launch excellence in the never normal
Omnichannel launch excellence in the never normalOmnichannel launch excellence in the never normal
Omnichannel launch excellence in the never normal
 
Google Q1 2015 earnings deck
Google Q1 2015 earnings deckGoogle Q1 2015 earnings deck
Google Q1 2015 earnings deck
 

Similar to Investor Overview - March 2014

Yu me ir_deck_06jan2015
Yu me ir_deck_06jan2015Yu me ir_deck_06jan2015
Yu me ir_deck_06jan2015
investorsyume
 
Yume ir deck-mar2015
Yume ir deck-mar2015Yume ir deck-mar2015
Yume ir deck-mar2015
investorsyume
 
Investor Presentation Third Quarter 2022
Investor Presentation Third Quarter 2022Investor Presentation Third Quarter 2022
Investor Presentation Third Quarter 2022
Tejal81
 
DV Third Quarter 2022 Investor Presentation
DV Third Quarter 2022 Investor PresentationDV Third Quarter 2022 Investor Presentation
DV Third Quarter 2022 Investor Presentation
Tejal81
 
Investor Presentation Q3 2022 Final
Investor Presentation Q3 2022 FinalInvestor Presentation Q3 2022 Final
Investor Presentation Q3 2022 Final
Tejal81
 
Inst investor deck aug 2016
Inst investor deck   aug 2016Inst investor deck   aug 2016
Inst investor deck aug 2016
Instructure
 
Q4 & FY 2022 Investor Presentation 3.1.2023.pdf
Q4 & FY 2022 Investor Presentation 3.1.2023.pdfQ4 & FY 2022 Investor Presentation 3.1.2023.pdf
Q4 & FY 2022 Investor Presentation 3.1.2023.pdf
Tejal81
 
Q4 & FY 2022 Investor Presentation 3.2.2023.pdf
Q4 & FY 2022 Investor Presentation 3.2.2023.pdfQ4 & FY 2022 Investor Presentation 3.2.2023.pdf
Q4 & FY 2022 Investor Presentation 3.2.2023.pdf
Tejal81
 
Inst investor deck nov 2016pdf
Inst investor deck   nov 2016pdfInst investor deck   nov 2016pdf
Inst investor deck nov 2016pdf
Instructure
 
Inst investor deck 2-13-17 (1)
Inst investor deck   2-13-17 (1)Inst investor deck   2-13-17 (1)
Inst investor deck 2-13-17 (1)
Instructure
 
Logm investor presentation q3 2015
Logm investor presentation q3 2015Logm investor presentation q3 2015
Logm investor presentation q3 2015
irlogmein
 
Logm investor presentation q3 2015
Logm investor presentation q3 2015Logm investor presentation q3 2015
Logm investor presentation q3 2015
irlogmein
 
Logm investor presentation q2 2015
Logm investor presentation q2 2015Logm investor presentation q2 2015
Logm investor presentation q2 2015
irlogmein
 
Logm investor presentation q2 2015
Logm investor presentation q2 2015Logm investor presentation q2 2015
Logm investor presentation q2 2015
irlogmein
 
INST investor deck 05.08.2017
INST investor deck 05.08.2017INST investor deck 05.08.2017
INST investor deck 05.08.2017
Instructure
 
A10_Investor_Presentation
A10_Investor_PresentationA10_Investor_Presentation
A10_Investor_Presentation
A10_Networks_IR
 
Q2 2023 Quarterly Investor Presentation Updated 9.18.23.pdf
Q2 2023 Quarterly Investor Presentation Updated 9.18.23.pdfQ2 2023 Quarterly Investor Presentation Updated 9.18.23.pdf
Q2 2023 Quarterly Investor Presentation Updated 9.18.23.pdf
Tejal81
 
Q2 2023 Quarterly Investor Presentation - Draft 4 FINAL.pdf
Q2 2023 Quarterly Investor Presentation - Draft 4 FINAL.pdfQ2 2023 Quarterly Investor Presentation - Draft 4 FINAL.pdf
Q2 2023 Quarterly Investor Presentation - Draft 4 FINAL.pdf
Tejal81
 
Q2 2023 Quarterly Investor Presentation Updated 9.25.23.pdf
Q2 2023 Quarterly Investor Presentation Updated 9.25.23.pdfQ2 2023 Quarterly Investor Presentation Updated 9.25.23.pdf
Q2 2023 Quarterly Investor Presentation Updated 9.25.23.pdf
Tejal81
 
Q1'23 Quarterly Investor Presentation - FINAL.pdf
Q1'23 Quarterly Investor Presentation - FINAL.pdfQ1'23 Quarterly Investor Presentation - FINAL.pdf
Q1'23 Quarterly Investor Presentation - FINAL.pdf
Tejal81
 

Similar to Investor Overview - March 2014 (20)

Yu me ir_deck_06jan2015
Yu me ir_deck_06jan2015Yu me ir_deck_06jan2015
Yu me ir_deck_06jan2015
 
Yume ir deck-mar2015
Yume ir deck-mar2015Yume ir deck-mar2015
Yume ir deck-mar2015
 
Investor Presentation Third Quarter 2022
Investor Presentation Third Quarter 2022Investor Presentation Third Quarter 2022
Investor Presentation Third Quarter 2022
 
DV Third Quarter 2022 Investor Presentation
DV Third Quarter 2022 Investor PresentationDV Third Quarter 2022 Investor Presentation
DV Third Quarter 2022 Investor Presentation
 
Investor Presentation Q3 2022 Final
Investor Presentation Q3 2022 FinalInvestor Presentation Q3 2022 Final
Investor Presentation Q3 2022 Final
 
Inst investor deck aug 2016
Inst investor deck   aug 2016Inst investor deck   aug 2016
Inst investor deck aug 2016
 
Q4 & FY 2022 Investor Presentation 3.1.2023.pdf
Q4 & FY 2022 Investor Presentation 3.1.2023.pdfQ4 & FY 2022 Investor Presentation 3.1.2023.pdf
Q4 & FY 2022 Investor Presentation 3.1.2023.pdf
 
Q4 & FY 2022 Investor Presentation 3.2.2023.pdf
Q4 & FY 2022 Investor Presentation 3.2.2023.pdfQ4 & FY 2022 Investor Presentation 3.2.2023.pdf
Q4 & FY 2022 Investor Presentation 3.2.2023.pdf
 
Inst investor deck nov 2016pdf
Inst investor deck   nov 2016pdfInst investor deck   nov 2016pdf
Inst investor deck nov 2016pdf
 
Inst investor deck 2-13-17 (1)
Inst investor deck   2-13-17 (1)Inst investor deck   2-13-17 (1)
Inst investor deck 2-13-17 (1)
 
Logm investor presentation q3 2015
Logm investor presentation q3 2015Logm investor presentation q3 2015
Logm investor presentation q3 2015
 
Logm investor presentation q3 2015
Logm investor presentation q3 2015Logm investor presentation q3 2015
Logm investor presentation q3 2015
 
Logm investor presentation q2 2015
Logm investor presentation q2 2015Logm investor presentation q2 2015
Logm investor presentation q2 2015
 
Logm investor presentation q2 2015
Logm investor presentation q2 2015Logm investor presentation q2 2015
Logm investor presentation q2 2015
 
INST investor deck 05.08.2017
INST investor deck 05.08.2017INST investor deck 05.08.2017
INST investor deck 05.08.2017
 
A10_Investor_Presentation
A10_Investor_PresentationA10_Investor_Presentation
A10_Investor_Presentation
 
Q2 2023 Quarterly Investor Presentation Updated 9.18.23.pdf
Q2 2023 Quarterly Investor Presentation Updated 9.18.23.pdfQ2 2023 Quarterly Investor Presentation Updated 9.18.23.pdf
Q2 2023 Quarterly Investor Presentation Updated 9.18.23.pdf
 
Q2 2023 Quarterly Investor Presentation - Draft 4 FINAL.pdf
Q2 2023 Quarterly Investor Presentation - Draft 4 FINAL.pdfQ2 2023 Quarterly Investor Presentation - Draft 4 FINAL.pdf
Q2 2023 Quarterly Investor Presentation - Draft 4 FINAL.pdf
 
Q2 2023 Quarterly Investor Presentation Updated 9.25.23.pdf
Q2 2023 Quarterly Investor Presentation Updated 9.25.23.pdfQ2 2023 Quarterly Investor Presentation Updated 9.25.23.pdf
Q2 2023 Quarterly Investor Presentation Updated 9.25.23.pdf
 
Q1'23 Quarterly Investor Presentation - FINAL.pdf
Q1'23 Quarterly Investor Presentation - FINAL.pdfQ1'23 Quarterly Investor Presentation - FINAL.pdf
Q1'23 Quarterly Investor Presentation - FINAL.pdf
 

Recently uploaded

UnityNet World Environment Day Abraham Project 2024 Press Release
UnityNet World Environment Day Abraham Project 2024 Press ReleaseUnityNet World Environment Day Abraham Project 2024 Press Release
UnityNet World Environment Day Abraham Project 2024 Press Release
LHelferty
 
Collective Mining | Corporate Presentation - June 2024
Collective Mining | Corporate Presentation - June 2024Collective Mining | Corporate Presentation - June 2024
Collective Mining | Corporate Presentation - June 2024
CollectiveMining1
 
ppt-namibia-worldeconomy-standardbank.ppt
ppt-namibia-worldeconomy-standardbank.pptppt-namibia-worldeconomy-standardbank.ppt
ppt-namibia-worldeconomy-standardbank.ppt
TestOrg1
 
Collective Mining | Corporate Presentation - June 2024
Collective Mining  | Corporate Presentation - June 2024Collective Mining  | Corporate Presentation - June 2024
Collective Mining | Corporate Presentation - June 2024
CollectiveMining1
 
Cleades robinson:The Diplomat is Blue
Cleades robinson:The Diplomat is BlueCleades robinson:The Diplomat is Blue
Cleades robinson:The Diplomat is Blue
Cleades Robinson
 
ZKsync airdrop of 3.6 billion ZK tokens is scheduled by ZKsync for next week.pdf
ZKsync airdrop of 3.6 billion ZK tokens is scheduled by ZKsync for next week.pdfZKsync airdrop of 3.6 billion ZK tokens is scheduled by ZKsync for next week.pdf
ZKsync airdrop of 3.6 billion ZK tokens is scheduled by ZKsync for next week.pdf
SOFTTECHHUB
 
Methanex Investor Presentation - April 2024
Methanex Investor Presentation - April 2024Methanex Investor Presentation - April 2024
Methanex Investor Presentation - April 2024
Methanex Corporation
 
快速办理(CUBoulder毕业证书)科罗拉多大学博尔德分校毕业证录取通知书一模一样
快速办理(CUBoulder毕业证书)科罗拉多大学博尔德分校毕业证录取通知书一模一样快速办理(CUBoulder毕业证书)科罗拉多大学博尔德分校毕业证录取通知书一模一样
快速办理(CUBoulder毕业证书)科罗拉多大学博尔德分校毕业证录取通知书一模一样
f3wjr2q2
 
Understanding-the-E-Way-Bill-A-Digital-Transformation-in-Logistics.pptx
Understanding-the-E-Way-Bill-A-Digital-Transformation-in-Logistics.pptxUnderstanding-the-E-Way-Bill-A-Digital-Transformation-in-Logistics.pptx
Understanding-the-E-Way-Bill-A-Digital-Transformation-in-Logistics.pptx
cosmo-soil
 
AGM Presentation Probe June 11 Final.pdf
AGM Presentation Probe June 11 Final.pdfAGM Presentation Probe June 11 Final.pdf
AGM Presentation Probe June 11 Final.pdf
Probe Gold
 
Osisko Gold Royalties Ltd - Corporate Presentation, June 12, 2024
Osisko Gold Royalties Ltd - Corporate Presentation, June 12, 2024Osisko Gold Royalties Ltd - Corporate Presentation, June 12, 2024
Osisko Gold Royalties Ltd - Corporate Presentation, June 12, 2024
Osisko Gold Royalties Ltd
 
Mandalay Resouces June 2024 Investor Relations PPT
Mandalay Resouces June 2024 Investor Relations PPTMandalay Resouces June 2024 Investor Relations PPT
Mandalay Resouces June 2024 Investor Relations PPT
MandalayResources
 
Cyberagent_For New Investors_EN_240424.pdf
Cyberagent_For New Investors_EN_240424.pdfCyberagent_For New Investors_EN_240424.pdf
Cyberagent_For New Investors_EN_240424.pdf
CyberAgent, Inc.
 
Corporate Presentation Probe June 2024.pdf
Corporate Presentation Probe June 2024.pdfCorporate Presentation Probe June 2024.pdf
Corporate Presentation Probe June 2024.pdf
Probe Gold
 

Recently uploaded (14)

UnityNet World Environment Day Abraham Project 2024 Press Release
UnityNet World Environment Day Abraham Project 2024 Press ReleaseUnityNet World Environment Day Abraham Project 2024 Press Release
UnityNet World Environment Day Abraham Project 2024 Press Release
 
Collective Mining | Corporate Presentation - June 2024
Collective Mining | Corporate Presentation - June 2024Collective Mining | Corporate Presentation - June 2024
Collective Mining | Corporate Presentation - June 2024
 
ppt-namibia-worldeconomy-standardbank.ppt
ppt-namibia-worldeconomy-standardbank.pptppt-namibia-worldeconomy-standardbank.ppt
ppt-namibia-worldeconomy-standardbank.ppt
 
Collective Mining | Corporate Presentation - June 2024
Collective Mining  | Corporate Presentation - June 2024Collective Mining  | Corporate Presentation - June 2024
Collective Mining | Corporate Presentation - June 2024
 
Cleades robinson:The Diplomat is Blue
Cleades robinson:The Diplomat is BlueCleades robinson:The Diplomat is Blue
Cleades robinson:The Diplomat is Blue
 
ZKsync airdrop of 3.6 billion ZK tokens is scheduled by ZKsync for next week.pdf
ZKsync airdrop of 3.6 billion ZK tokens is scheduled by ZKsync for next week.pdfZKsync airdrop of 3.6 billion ZK tokens is scheduled by ZKsync for next week.pdf
ZKsync airdrop of 3.6 billion ZK tokens is scheduled by ZKsync for next week.pdf
 
Methanex Investor Presentation - April 2024
Methanex Investor Presentation - April 2024Methanex Investor Presentation - April 2024
Methanex Investor Presentation - April 2024
 
快速办理(CUBoulder毕业证书)科罗拉多大学博尔德分校毕业证录取通知书一模一样
快速办理(CUBoulder毕业证书)科罗拉多大学博尔德分校毕业证录取通知书一模一样快速办理(CUBoulder毕业证书)科罗拉多大学博尔德分校毕业证录取通知书一模一样
快速办理(CUBoulder毕业证书)科罗拉多大学博尔德分校毕业证录取通知书一模一样
 
Understanding-the-E-Way-Bill-A-Digital-Transformation-in-Logistics.pptx
Understanding-the-E-Way-Bill-A-Digital-Transformation-in-Logistics.pptxUnderstanding-the-E-Way-Bill-A-Digital-Transformation-in-Logistics.pptx
Understanding-the-E-Way-Bill-A-Digital-Transformation-in-Logistics.pptx
 
AGM Presentation Probe June 11 Final.pdf
AGM Presentation Probe June 11 Final.pdfAGM Presentation Probe June 11 Final.pdf
AGM Presentation Probe June 11 Final.pdf
 
Osisko Gold Royalties Ltd - Corporate Presentation, June 12, 2024
Osisko Gold Royalties Ltd - Corporate Presentation, June 12, 2024Osisko Gold Royalties Ltd - Corporate Presentation, June 12, 2024
Osisko Gold Royalties Ltd - Corporate Presentation, June 12, 2024
 
Mandalay Resouces June 2024 Investor Relations PPT
Mandalay Resouces June 2024 Investor Relations PPTMandalay Resouces June 2024 Investor Relations PPT
Mandalay Resouces June 2024 Investor Relations PPT
 
Cyberagent_For New Investors_EN_240424.pdf
Cyberagent_For New Investors_EN_240424.pdfCyberagent_For New Investors_EN_240424.pdf
Cyberagent_For New Investors_EN_240424.pdf
 
Corporate Presentation Probe June 2024.pdf
Corporate Presentation Probe June 2024.pdfCorporate Presentation Probe June 2024.pdf
Corporate Presentation Probe June 2024.pdf
 

Investor Overview - March 2014

  • 1. Investor Overview March 2014 The Science Behind Influence
  • 2. FORWARD-LOOKING STATEMENTS This presentation contains forward-looking statements. All statements other than statements of historical fact contained in this presentation are forward-looking statements. These statements are only current predictions and are subject to known and unknown risks, uncertainties, assumptions, and other factors that may cause our results or our industry’s actual results, levels of activity, performance or achievements to be materially different from those anticipated by the forward-looking statements. These forwardlooking statements are subject to a number of risks, including those described under the heading “Risk Factors” in our periodic reports filed with the U.S. Securities and Exchange Commission, including our Form 10-Q for the quarter ended September 30, 2013, and in our future filings and reports with the SEC, including our Annual Report on Form 10-K for the year ended December 31, 2013. . Moreover, new risks emerge periodically. It is not possible for us to predict all risks, nor can we assess the impact of all factors on our business or the extent to which any factor, or combination of factors, may cause actual results to differ materially from those contained in any forward-looking statements we may make. Actual results could differ materially and adversely from those anticipated or implied in the forward-looking statements. You should not rely upon forward-looking statements as predictions of future events. Except as required by law, we are under no duty to update or revise any of the forward-looking statements, whether as a results of new information, future events or otherwise, after the date of this presentation. In addition to the U.S. GAAP financials, this presentation includes certain non-GAAP financial measures. These non-GAAP financial measures are in addition to, and not a substitute for or superior to measures of financial performance prepared in accordance with U.S. GAAP. See Appendix for reconciliation between each non-GAAP measure and the most comparable GAAP measure. This presentation contains statistical data that we obtained from industry publications and reports generated by third parties. Although we believe that the publications and reports are reliable, we have not independently verified this statistical data. 1 ©2014 YuMe. All rights reserved.
  • 3. Overview 2 ©2014 YuMe. All rights reserved.
  • 4. Yesterday 3 3 ©2013 YuMe. All rights reserved. ©2014 YuMe. All rights reserved.
  • 5. Today 4 ©2014 YuMe. All rights reserved.
  • 6. One Screen at Primetime Multi-Screen Video All the Time And it’s Happened Before – Newspaper 5 ©2014 YuMe. All rights reserved. Web Yellow Pages & Local Advertising Search
  • 7. Media Strategy Television Digital Video Reach & Frequency Data & Analytics + 6 ©2014 YuMe. All rights reserved.
  • 8. BRAND ADVERTISERS REVENUE $ IN MILLIONS 580 $151.1 450 $116.7 288 $68.6 242 $51.9 33% CAGR 2010 2011 2012 1 Global Online Video Advertising Platforms Market, Frost & Sullivan, 2013. 7 ©2014 YuMe. All rights reserved. 42% CAGR 2013 2010 2011 2012 2013
  • 9. Massive brand advertising market disruption Proprietary data sciences platform Platform drives outstanding brand results High growth with significant operating leverage 8 ©2014 YuMe. All rights reserved.
  • 10. 2 VIDEO ADVERTISING TV $ IN BILLIONS $15.1 $193B 1 $5.3 DIGITAL $100B1 1 Magna Global, estimated 2012 global TV & digital ad spend, June 2013 2 Global Online Video Advertising Platforms Market, Frost & Sullivan, 2013. 9 ©2014 YuMe. All rights reserved. 2012 2016
  • 11. 2 Billion Share of Time Spent1 80% TV Smartphones3 DIGITAL 70% 60% 332 Million 50% Tablets Shipped4 40% 30% 500 Million 20% Connected TVs5 10% 0% 1995 1 MagnaGlobal, 2012 2 Includes Internet & mobile devices 10 ©2014 YuMe. All rights reserved. 2003 3 Total by 2015, Strategy Analytics 2012 4 Shipped in 2015, IDC 2013 2012 5 Total by 2015, DisplaySearch, 2011
  • 12. Content Screen Devices per person TV 1-5 Cable 5-500 Internet >10,000 2000 Data 11 ©2014 YuMe. All rights reserved. 2012 Technology
  • 13. BRAND CHALLENGES Data Which screen should I target? 12 ©2014 YuMe. All rights reserved. On which placements should my ads run? How do I find people receptive to my message?
  • 15. Software Web PLACEMENT Connected TV 200 Billion 1,500 Data Points Properties Tablet SURVEY Smartphone 14 ©2014 YuMe. All rights reserved.
  • 16. PQI Algorithm Real-Time Inventory Grading BEST PLACEMENT DATA BETTER 257 Million Global Unique Viewers1 1 May 2013 15 ©2014 YuMe. All rights reserved. f (x, y, z) GOOD
  • 18. AUDIENCE AMPLIFIER PQI Inventory Brand Segments 17 ©2014 YuMe. All rights reserved.
  • 20. 16% TV Budget Shift to YuMe Reaching Adults 35-54 15.9 Million YuMe Reach and Frequency Results Exclusive Online Reach 6M Total Reach Cross Platform Reach 19 ©2014 YuMe. All rights reserved. +23% Average Frequency 42.7 Million TV +14% +18%
  • 21. Brand Awareness 1 72.5% 1 Overall CPG Brand Lift Purchase Intent 1 7x 71.2% Norm CONSUMER GOODS AUTOMOTIVE 1 Data from Nielsen Online Brand Effect (formerly Vizu Ad Catalyst) 20 ©2014 YuMe. All rights reserved. TELECOM & ELECTRONICS FINANCIAL ENTERTAINMENT
  • 22. Expand share of wallet Grow customer base Expand global footprint Pursue strategic acquisitions 21 ©2014 YuMe. All rights reserved.
  • 23. Ayyappan Sankaran Tim Laehy CEO and Co-Founder CTO and Co-Founder CFO Frank Barbieri Scot McLernon Corporate Development Sales Bryan Everett Michael Hudes Jayant Kadambi Business Development 22 ©2014 YuMe. All rights reserved. Emerging Markets Ed Haslam Marketing Paul Porrini General Counsel
  • 24. Financial Overview 23 ©2014 YuMe. All rights reserved.
  • 25. Large Attractive Market Strong Growth Operational Leverage R&D Advantage Proven Business Model 24 ©2014 YuMe. All rights reserved. Dramatic shift in TV viewing patterns Capturing the shift of ad dollars from TV to digital video More advertisers spending more over time 42% revenue CAGR (2010-13) Utilizing inventory quality scoring (PQI) Technology, data & scale provide enhanced results Strong & efficient R&D operations India-based technology development center Demonstrated growth and profitability Blending technology and media
  • 26. ANNUAL REVENUE QUARTERLY REVENUE $ IN MILLIONS $ IN MILLIONS $54.0 $151.1 $45.5 $116.7 $34.3 $28.4 $25.2 $68.6 $26.0 $36.2 $26.6 $20.1 $51.9 $13.6 $15.0 $11.5 2010 25 2011 ©2014 YuMe. All rights reserved. 2012 2013 Q1'11 Q2'11 Q3'11 Q4'11 Q1'12 Q2'12 Q3'12 Q4'12 Q1'13 Q2'13 Q3'13 Q4'13
  • 27. TOTAL ADVERTISERS REVENUE PER ADVERTISER $ IN 000s 580 $257 REVENUE FROM TOP 20 ADVERTISERS $ IN MILLIONS $255 $58.6 $61.9 449 $237 $37.2 $26.9 288 242 2010 26 $213 2011 2012 ©2014 YuMe. All rights reserved. 2013 2010 2011 2012 2013 2010 2011 2012 2013
  • 28. ANNUAL GROSS PROFIT QUARTERLY GROSS MARGIN ANNUAL ADJUSTED EBITDA1 $ IN MILLIONS $ IN MILLIONS GROSS MARGIN 37.6% 46.0% ADJUSTED EBITDA MARGIN 3.1% -10.8% 46.9% 48.4% 47.5% $70.9 45.8% 44.6% (10.8%) 10.1% 10.1% 5.9% 48.1% 45.3% 45.6% $11.8 42.8% $9.0 $53.8 40.2% 34.3% $25.8 Q3'11 Q4'11 Q1'12 Q2'12 Q3'12 Q4'12 Q1'13 Q2'13 Q3'13 Q4'13 PQI Rollout 2011 2012 PQI Rollout 2013 1 See Appendix for a reconciliation of adjusted EBITA to net income (loss) 27 ©2014 YuMe. All rights reserved. ($7.4) 2011 Investment 2012 Proved Model 2013
  • 29. FY 2011 FY 2012 FY 2013 Target Model 2 Gross Profit 38% 46% 47% 46%-48% Sales & Marketing 34% 27% 31% 17%-18% General & Administration 15% 11% 12% 9%-10% Research & Development 4% 2% 3% 5%-6% (11%) 10% 6% 18%-22% % of Revenue 1 Adjusted EBITDA 2 1 GAAP-based, except adjusted EBITDA 2 Target model assumes stock-based compensation and depreciation and amortization expense of 5%-6% of revenue 28 ©2014 YuMe. All rights reserved.
  • 30. In Conclusion 29 ©2014 YuMe. All rights reserved.
  • 31. Massive disrupted market Differentiated data sciences platform High growth with significant operating leverage 30 ©2014 YuMe. All rights reserved.
  • 32. YUME/NYSE 31 ©2014 YuMe. All rights reserved.
  • 33. APPENDIX 32 ©2014 YuMe. All rights reserved.
  • 34. (in thousands) Net income (loss) 2010 2011 2012 2013 $ (366) $ (11,089) $ 6,266 $ 321 $ 54 $ 164 $ 117 $ 47 Income tax expense $ 111 $ (62) $ 612 $ 670 Depreciation & amortization expense $ 926 $ 2,097 $ 2,783 $ 4,103 Stock based comp expense $ 860 $ 1,468 $ 2,042 $ 3,834 Total Adjustments $ 1,951 $ 3,667 $ 5,554 $ 8,654 Adjusted EBITDA $ 1,585 $ (7,422) $ 11,820 $ 8,975 Plus Adjustments: Interest expense 33 ©2014 YuMe. All rights reserved.