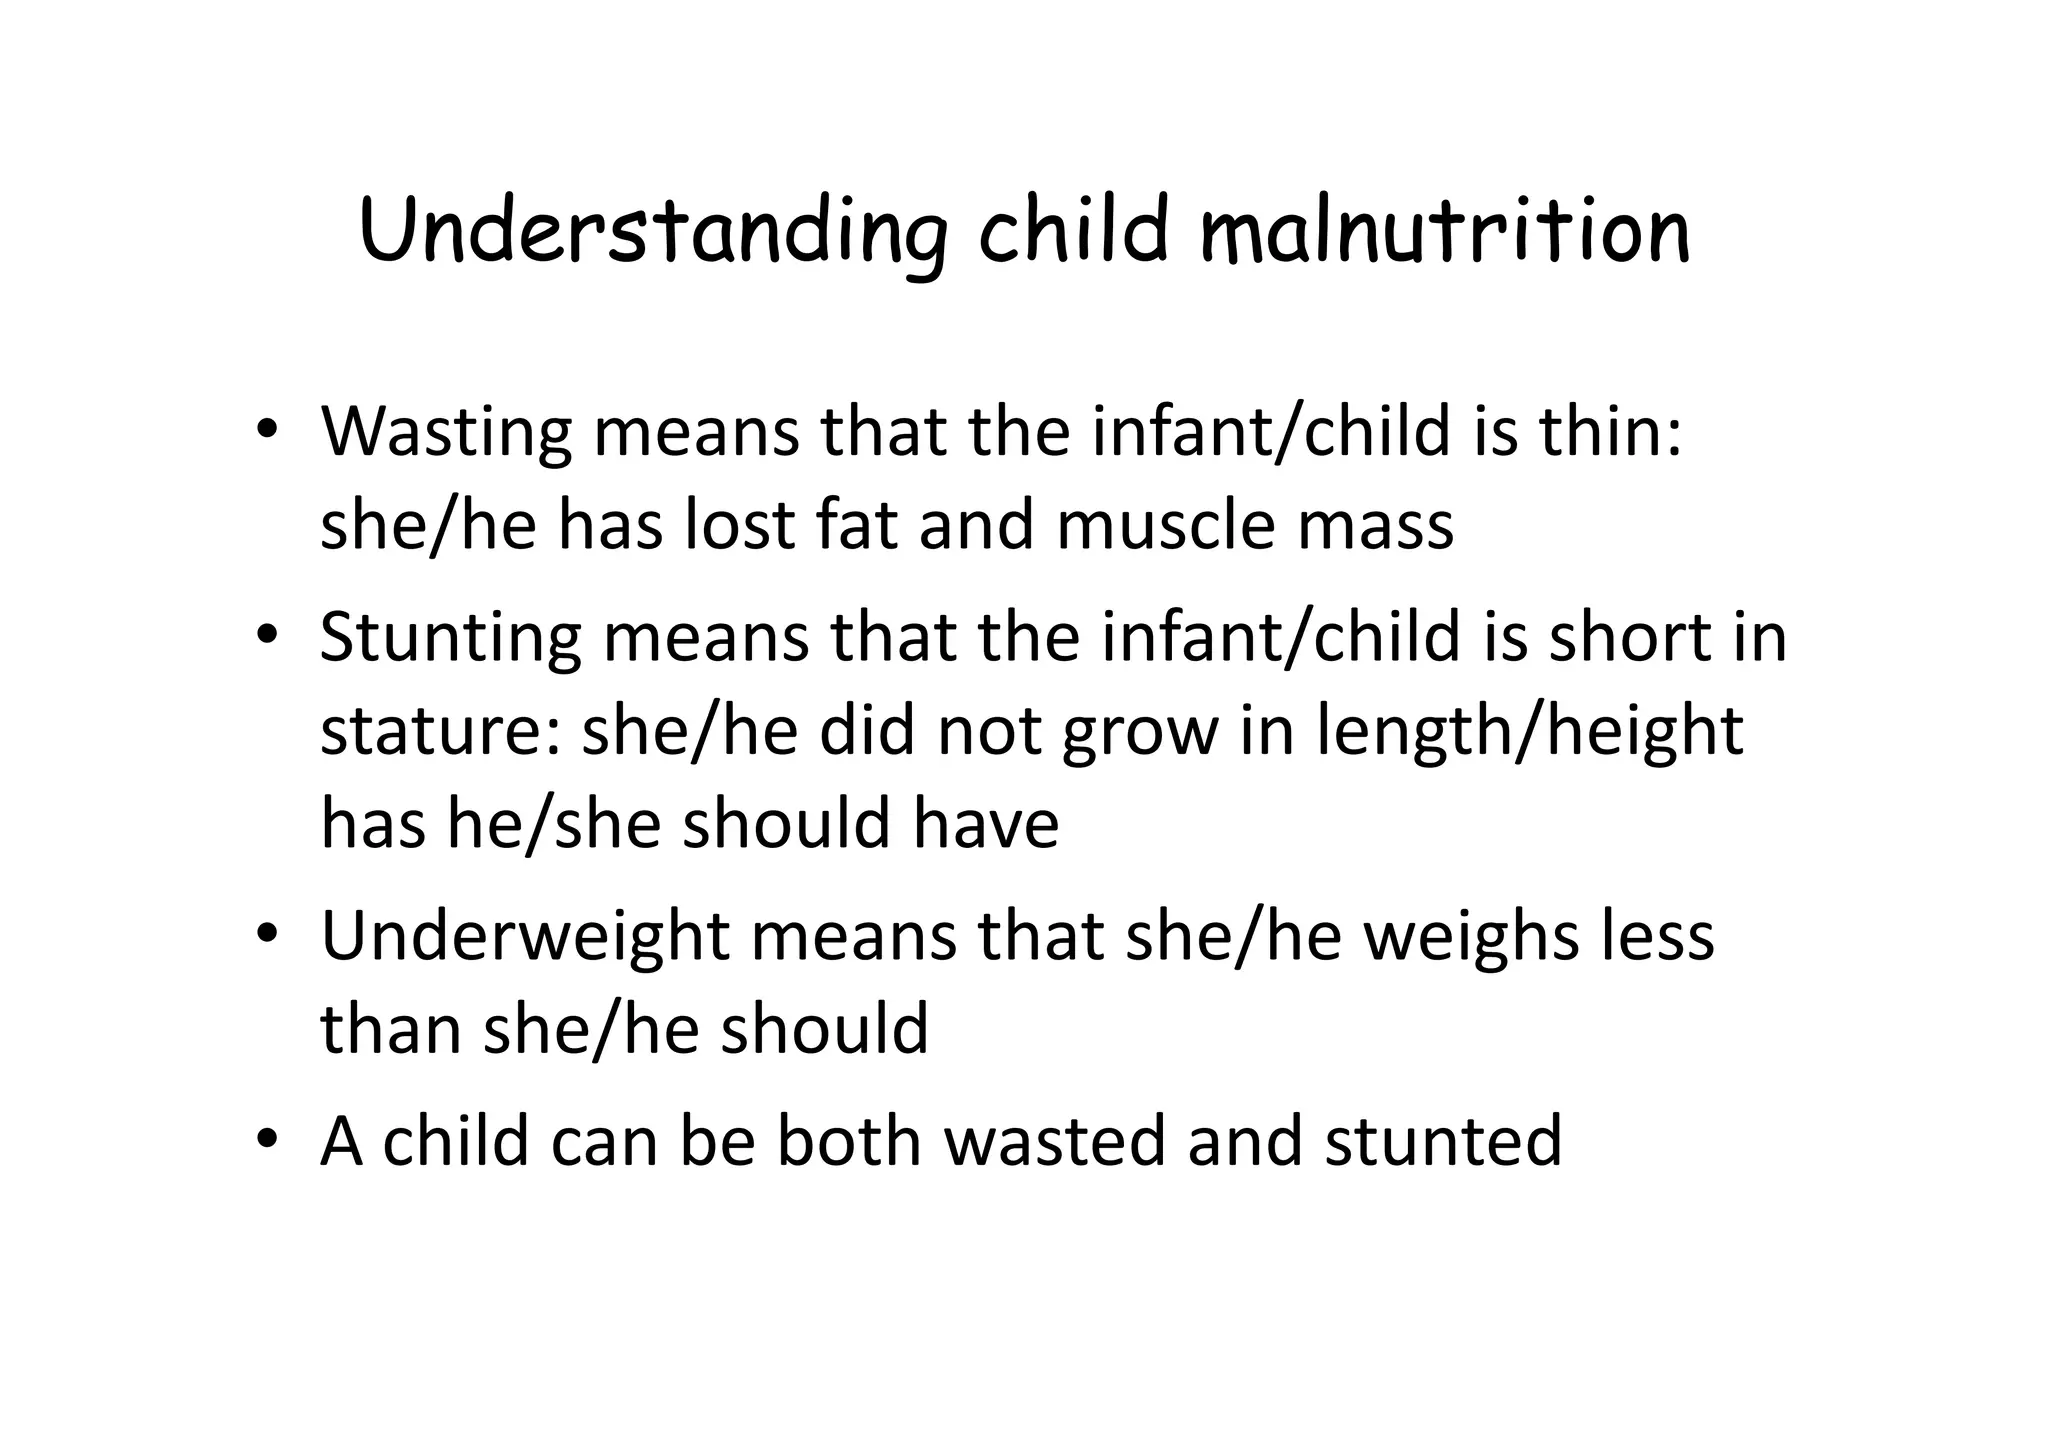
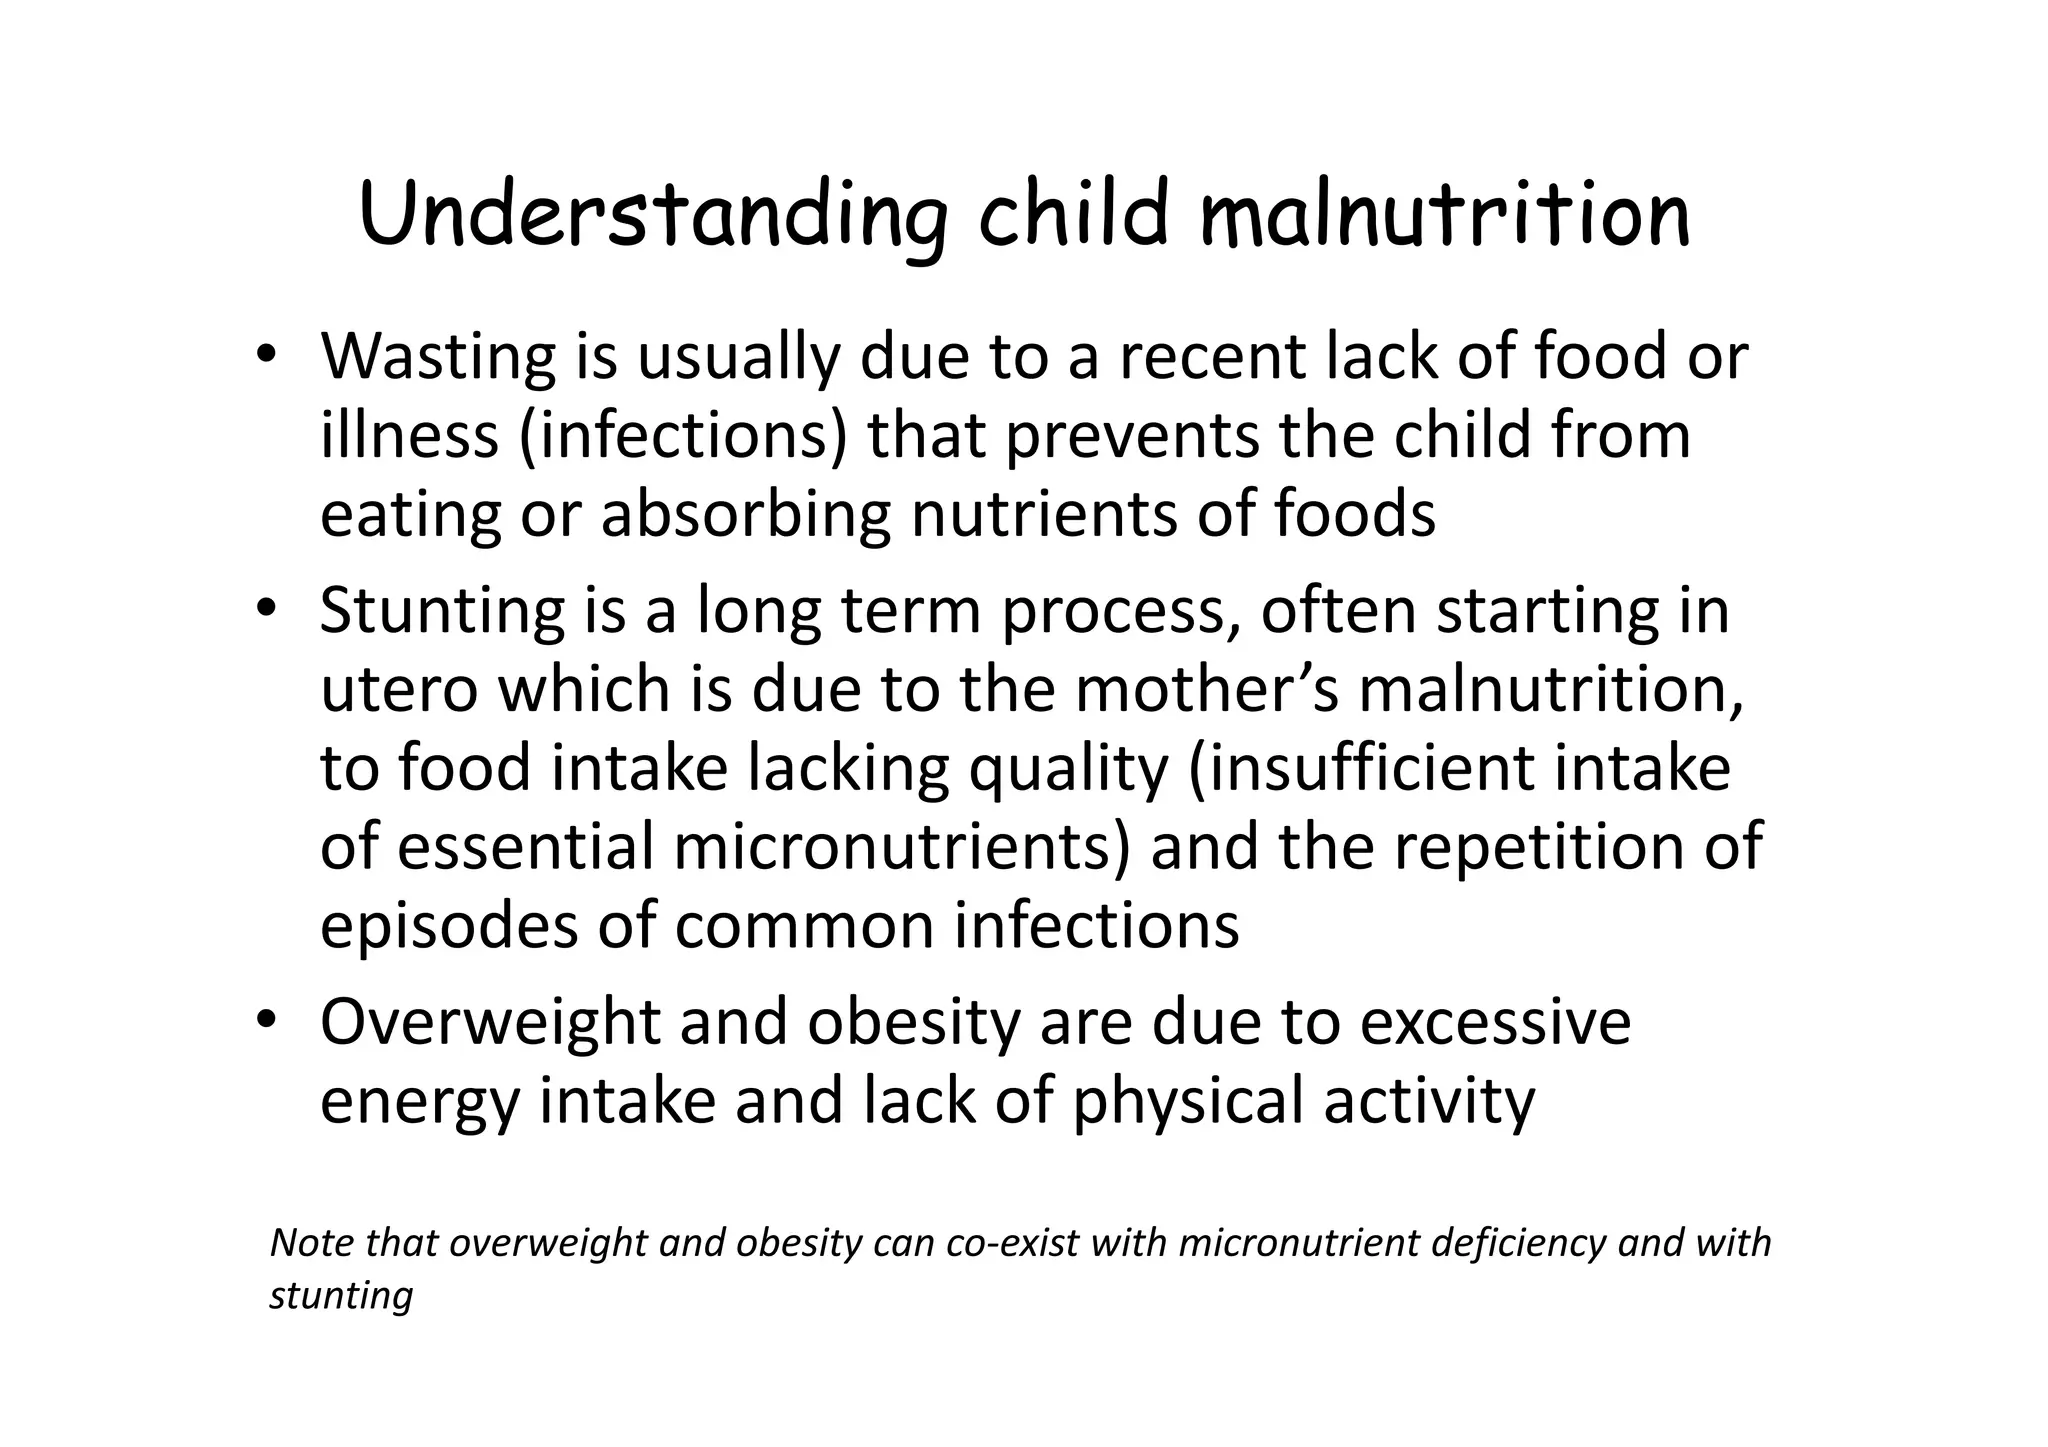
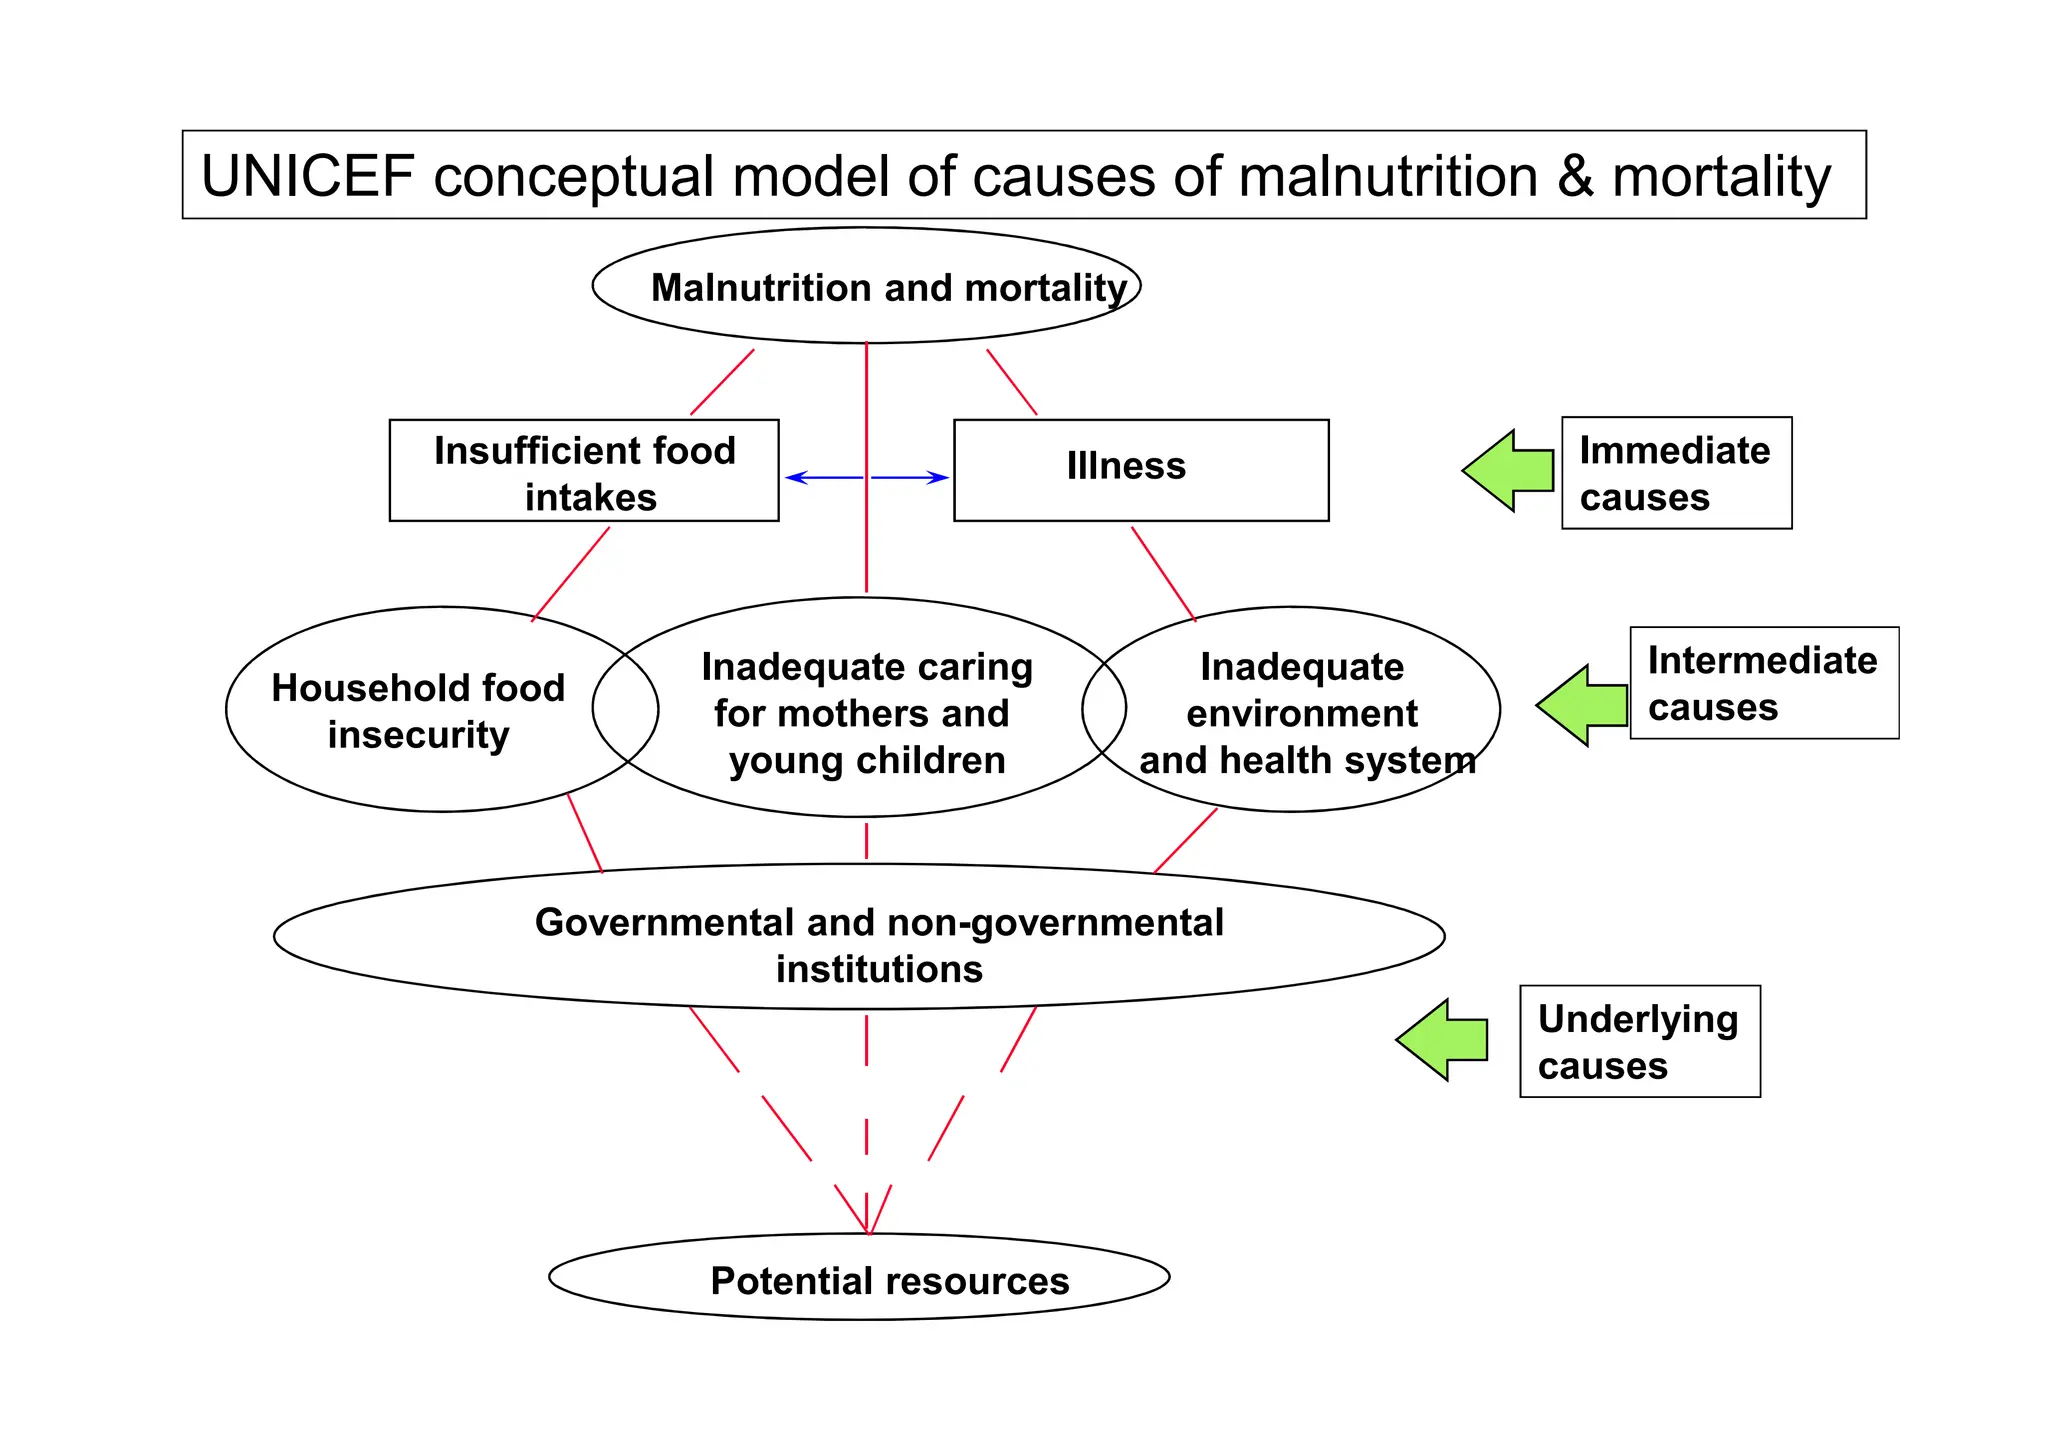
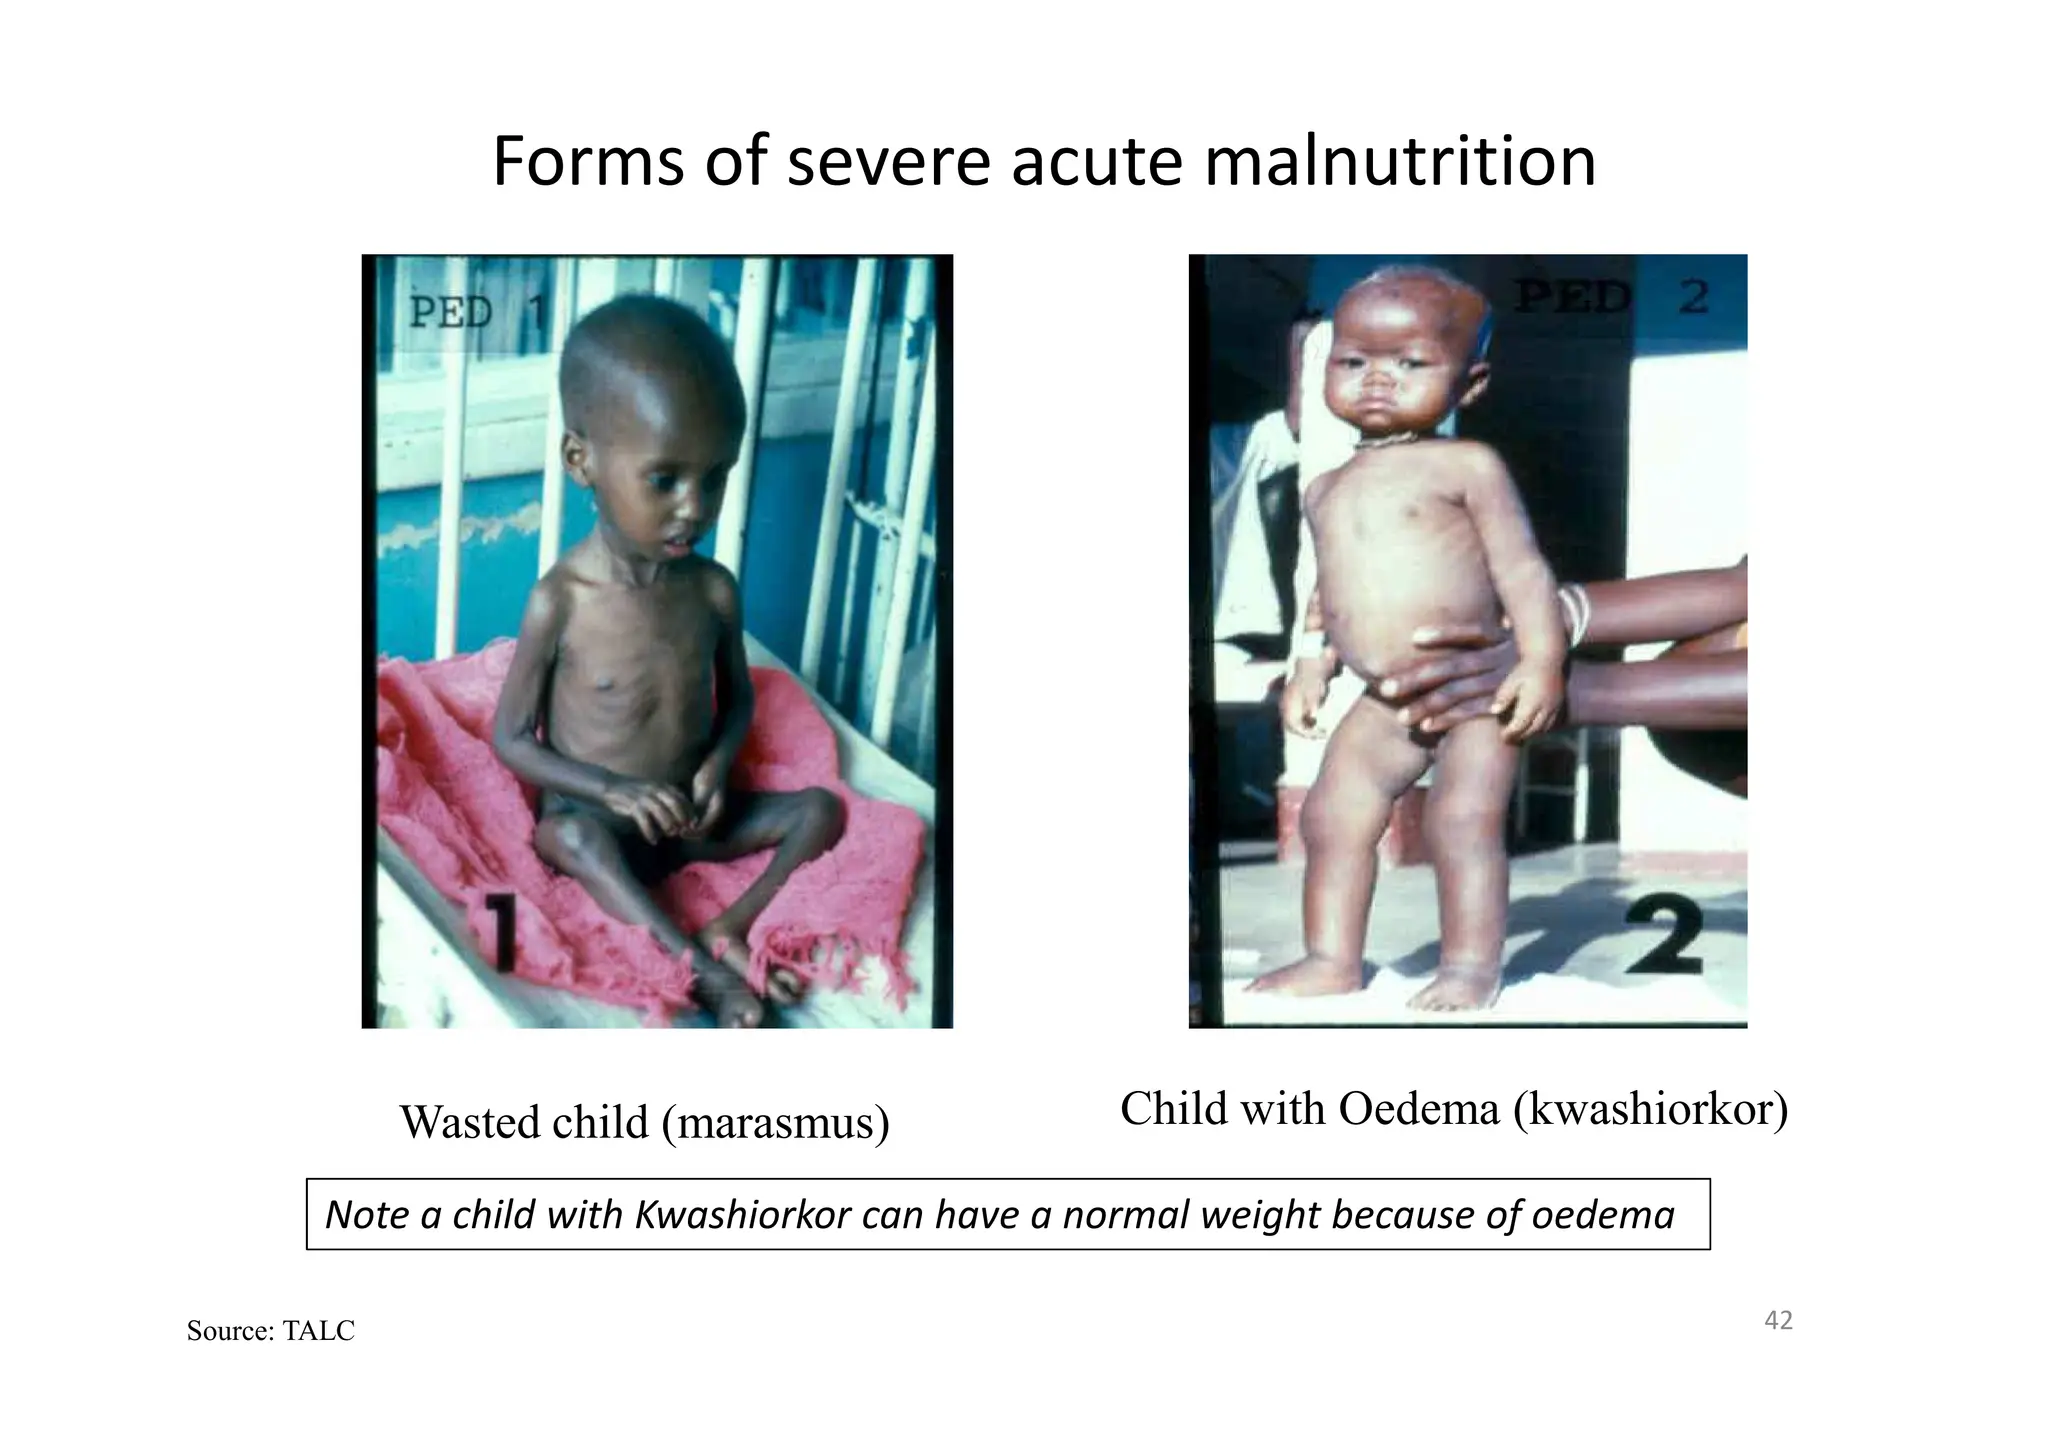
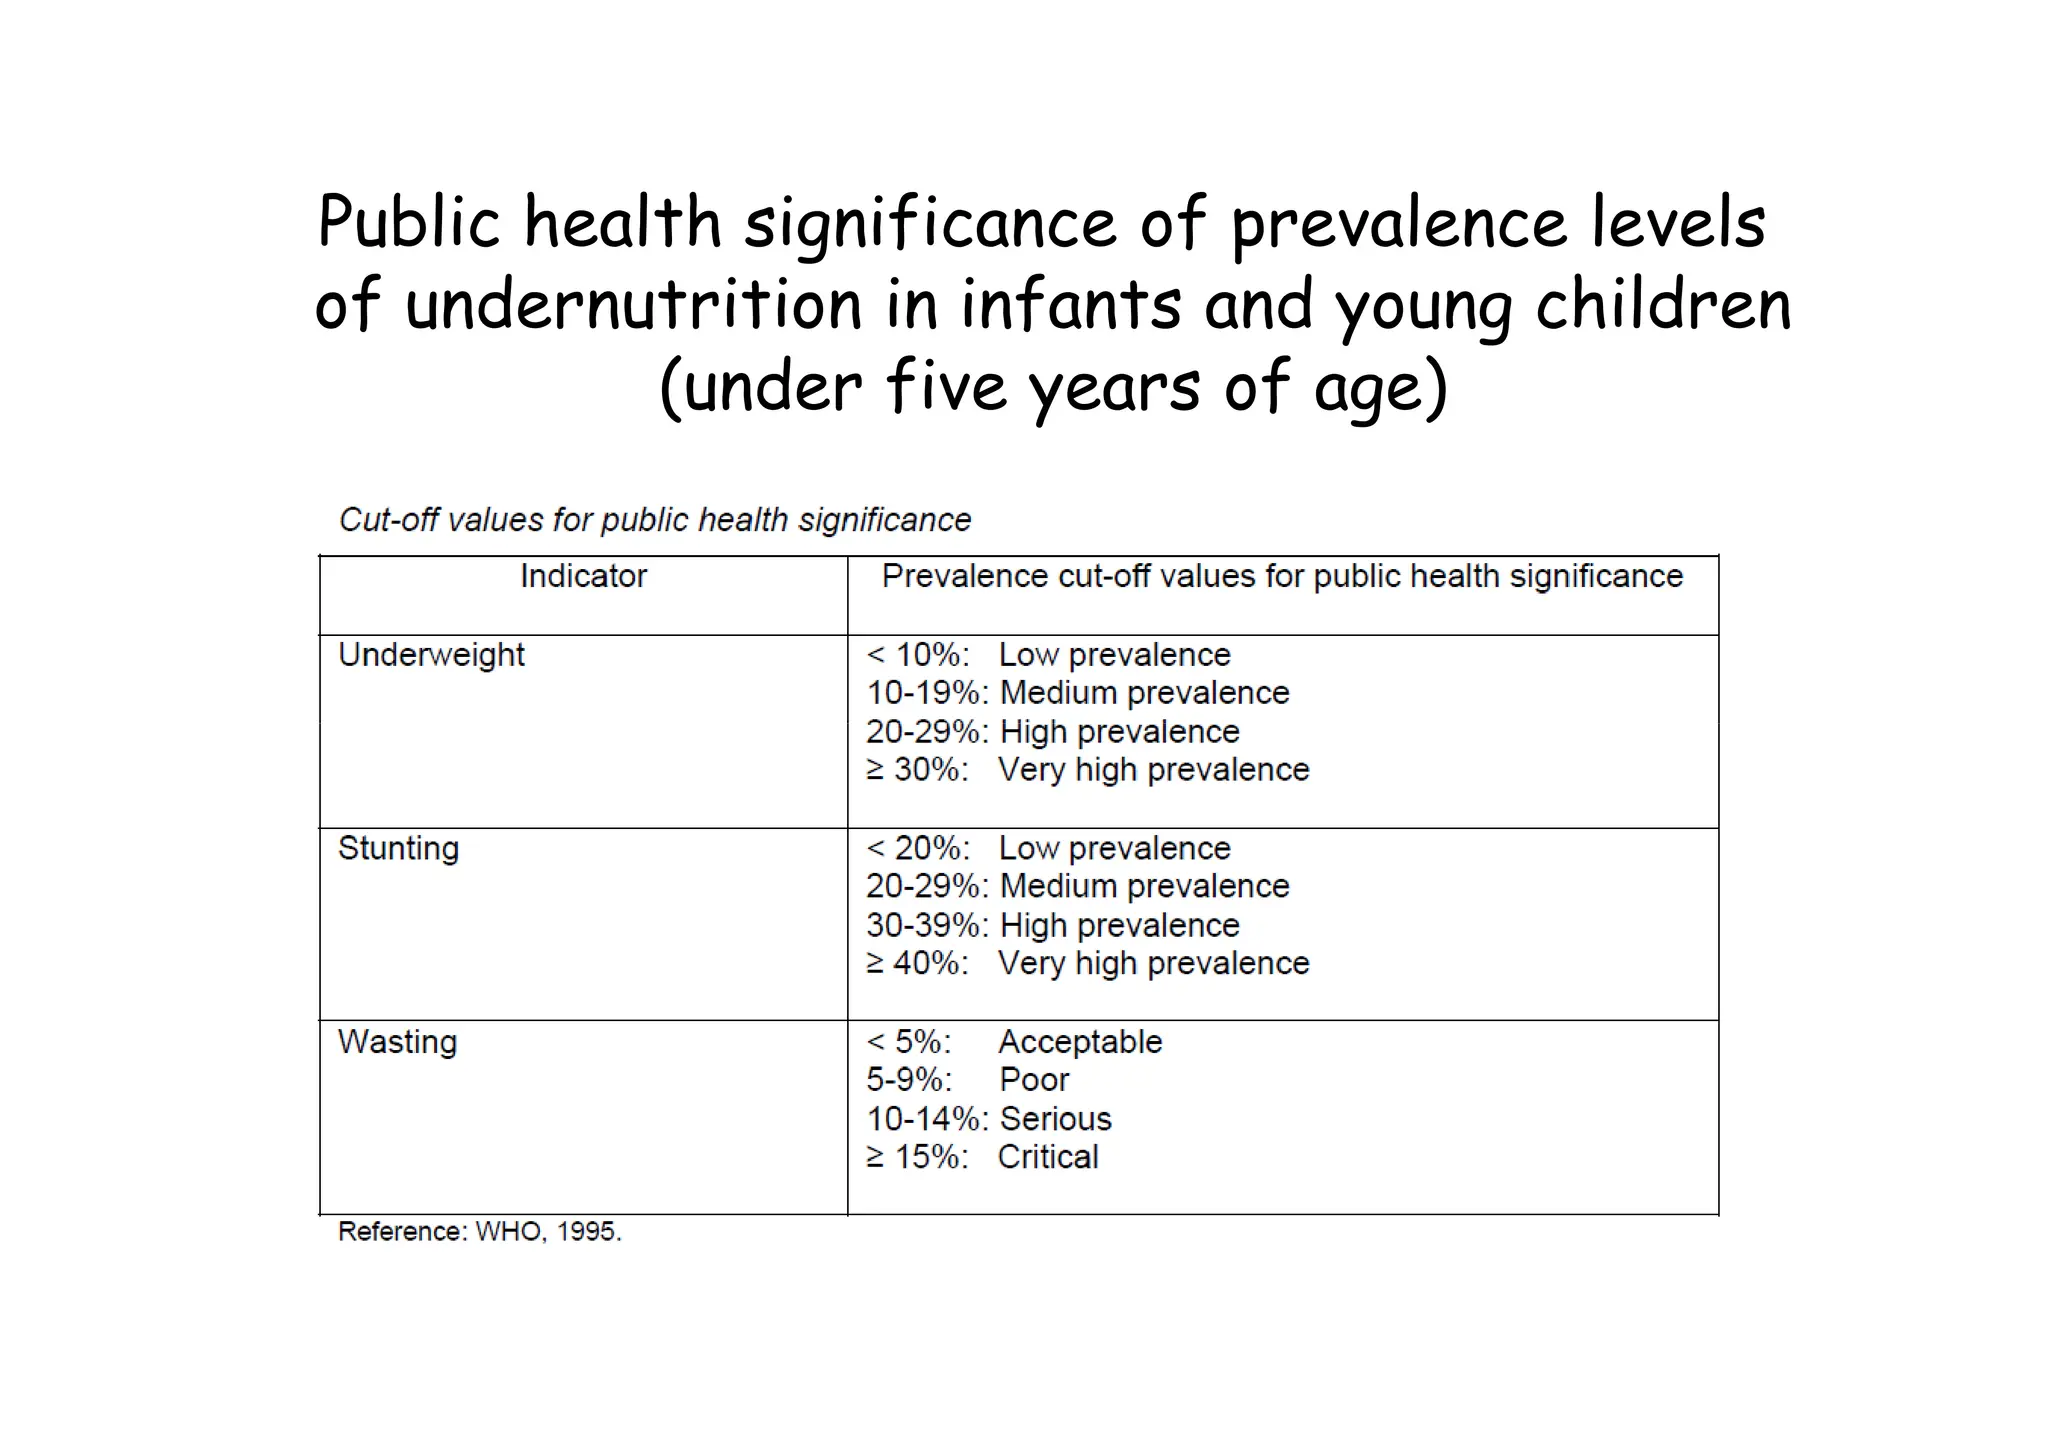
Malnutrition, definition, causes,
indicators for assessment
from a « Public Nutrition » perspective
Master Human Development and Food Security,
Roma III University, May 2016
Marie Claude Dop
Nutripass Nutrition research unit,
Institut de Recherche pour le
Développement,
Montpellier, France
marieclaude.dop@ird.fr
Course objectives
• Understand the concept of malnutrition and linkages to food
security and human development
• Realize the magnitude of the problem of malnutrition at
global level
• Know the principal causes of malnutrition in resource-poor
contexts
contexts
• Identify vulnerable groups
• Understand the key indicators for assessing under and
overnutrition
• Know the most important population-based preventive
strategies for fighting malnutrition and the indicators that are
useful for monitoring their impact
• Be able to read critically reports on assessment of
malnutrition
Outline of the course
• Introduction
• Part I: anthropometric indicators
• Part II: indicators of micronutrient deficiencies
• Part III: the nutrition transition and the
obesity epidemic
• Part IV: Nutrition-sensitive interventions and
programmes
Introduction
Why does nutrition matter ?
• Why include nutrition in a Master curriculum
on Human Development and Food Security ?
• What is the relationship between food
security and nutrition ?
• Why does nutrition matter to human
development ?
• Where does nutrition feature in Sustainable
Development Goals ?
Why does nutrition matter ?
• Is food insecurity related to nutrition ?
– Nutrition is in the definition of food insecurity
• Good nutrition is the basis of good health and
human well-being
– Therefore it is central to human development
• Poor nutrition
– affects populations’ health, intellectual and physical
capacities;
– it is a cause of poverty ;
– it is often transmitted from one generation to the next
Nutrition and the SDGs
SDG2: End hunger, achieve food security and improved nutrition
and promote sustainable agriculture
Definitions
Nutrition is the provision of adequate energy
and nutrients (in terms of amount and mix and
timeliness) to the cells to enable them to
perform their physiological function (of
growth, reproduction, defense, repair, etc).
Malnutrition is the result of a lack or an excess in
the provision of energy and/or nutrients to the
body (undernutrition or overweight/obesity)
Definitions (cont’d)
• Nutritional status is the state of the body in
relation to nutrition:
– Clinical, i.e. apparent signs of poor nutrition
– Growth and development of the body:
dimensions (anthropometric measures) such as
– Growth and development of the body:
dimensions (anthropometric measures) such as
weight and height
– Composition of the body and biochemical
parameters
• Dietary intake is separate from nutritional
status
Issues with terminology
• Malnutrition refers to poor nutritional status
• Undernourishment* is an FAO concept : it is the
number or proportion of persons whose energy
consumption is less than their minimum energy
needs
needs
• “Malnourished” can refer to the state of
malnutrition or to inadequate food intakes
• Hunger is defined as “a feeling of discomfort or
weakness caused by lack of food, coupled with
the desire to eat”
* Also designated as “chronic hunger”
Types of malnutrition
• Undernutrition:
– Protein-energy malnutrition
– Micronutrient deficiencies
• Overnutrition:
– Overweight and obesity
– Health consequences (diabetes, cardiovascular diseases)
• Co-existence of under and overnutrition: “double
burden of malnutrition”
– Obesity and PEM in the same family
– Obesity and micronutrient deficiencies in the same
individual
• Chronic and acute malnutrition
Note that this illustration does not include Childhood overweight/obesity which are also
forms of malnutrition
Examples of stunted children
13
Children of the same age
Understanding child malnutrition
• Wasting means that the infant/child is thin:
she/he has lost fat and muscle mass
• Stunting means that the infant/child is short in
stature: she/he did not grow in length/height
has he/she should have
• Underweight means that she/he weighs less
than she/he should
• A child can be both wasted and stunted
Understanding child malnutrition
• Wasting is usually due to a recent lack of food or
illness (infections) that prevents the child from
eating or absorbing nutrients of foods
• Stunting is a long term process, often starting in
utero which is due to the mother’s malnutrition,
to food intake lacking quality (insufficient intake
utero which is due to the mother’s malnutrition,
to food intake lacking quality (insufficient intake
of essential micronutrients) and the repetition of
episodes of common infections
• Overweight and obesity are due to excessive
energy intake and lack of physical activity
Note that overweight and obesity can co-exist with micronutrient deficiency and with
stunting
Wasted child (source TALC)
Obese boys
UNICEF conceptual model of causes of malnutrition & mortality
Intermediate
causes
Immediate
causes
Household food
insecurity
Inadequate caring
for mothers and
Inadequate
environment
Insufficient food
intakes
Illness
Malnutrition and mortality
causes
Underlying
causes
insecurity
for mothers and
young children
environment
and health system
Governmental and non-governmental
institutions
Political and ideological structure
Economic context
Potential resources
Comments on the UNICEF
conceptual model
• The model is useful for understanding and
distinguishing the causes of malnutrition: it
distinguishes the short and long “routes” for
fighting malnutrition
• The model doesn’t take into consideration
overweight/obesity as a form of malnutrition or
the double burden of malnutrition
• It is focused on child malnutrition while
malnutrition can affect all ages, but the concept
can be applied to other age groups
Impact of undernutrition on child
mortality*
Undernutrition is rarely a
direct cause of death.
It is most often an
underlying cause of death
from common illnesses of
which it increases the
occurrence and severity:
Undernutrition is rarely a
direct cause of death.
It is most often an
underlying cause of death
from common illnesses of
which it increases the
occurrence and severity:
* Among infants and children under five years, excluding neo-natal mortality
occurrence and severity:
approx. 45% of mortality
due to common illnesses is
attributed to malnutrition.
Most deaths occur in
moderately malnourished
children
occurrence and severity:
approx. 45% of mortality
due to common illnesses is
attributed to malnutrition.
Most deaths occur in
moderately malnourished
children
Nutrition throughout the life-cycle
Example: The life-cycle approach applied to micronutrient deficiency
The concept of the « 1000 days »
window of opportunity
• Undernutrition often starts in utero when mothers are
malnourished and /or stunted : intra-uterine growth
retardation
• Undernutrition impairs physical growth and cognitive
development
development
• After the age of 2 years damage is usually irreversible
• Therefore it is crucial to fight malnutrition during
pregnancy and the first 2 years of the child, i.e. the 1000
days between conception and the child’s second
birthday
• Many preventive interventions target this period of time
(see SUN initiative)
Purpose of nutrition assessment at
population level
• What proportion of the population is affected by
malnutrition? how severely?
• Who, Where and When are population groups affected?
– age, sex, socio-economic or occupational status etc;
– is seasonality a factor?
• Is the problem worsening or improving (trends)?
• What are the causes of malnutrition?
• What can be changed to reduce the prevalence of
malnutrition?
• Are interventions efficient to reduce the prevalence of
malnutrition? (impact assessment)
Note : While food insecurity is often assessed at household level, nutrition is
defined at individual level
Types of indicators of nutritional status
• Clinical indicators
– Marasmus and Kwashiorkor (oedema)
– Goiter
– Xerophtalmia
– Xerophtalmia
• Anthropometric indicators (based on body
measurements)
• Biochemical indicators
http://www.who.int/nutrition/nlis_interpretation_guide.pdf
Part I: Anthropometric
measurements and indicators
Measurements, indices and indicators
• Measurements of body dimensions cannot be
interpreted directly
• Indices have a biological interpretation :
– e.g. height for age
– they can be expressed in comparison to a reference
population (standard deviation from the median of a
– they can be expressed in comparison to a reference
population (standard deviation from the median of a
reference population = standard)
• Indicators :
– a cut-point for the index is defined, differentiating normal
and at risk individuals
– the indicator is the % of individuals below (or above) the
cut-point
The most commonly used body
measurements and indices derived
• Weight:
– birth weight
– weight for age
• Height:
– height for age
– height for age
– weight for height
– body mass index
• Mid upper arm circumference (MUAC)
• Waist circumference
On the basis of the indices, indicators are defined that
correspond to a state of malnutrition
Infant and young child anthropometric
indices and indicators of undernutrition
Wasting: low weight-for-height is a sign of acute malnutrition :
Indicator = prevalence of wasting
Stunting: low height-for-age is a sign of chronic malnutrition :
Indicator = prevalence of stunting
Underweight: low weight-for-age is a sign of acute or chronic
malnutrition or both :
Indicator = prevalence of underweight
Underweight is an internationally recognized public health indicator for
monitoring nutritional status and health in populations
MUAC is also used to assess acute malnutrition, especially in situations
where it is difficult to weigh children
Measuring infants and young children
• Measurements need to be exact and precise
• Strict protocol for taking measurements
• Sources of error are many
• Imprecise age is a source of error
• Personnel needs to be skilled
• There exist standard tests for checking the skills
of personnel at the start of a survey
• Some checks of the validity of the collected data
are possible
How do we measure height/length?
Children under 2 years Children from 2 years
29
How to weigh children?
Using a hanging scale Using an electronic scale
30
For infants and young children indicators
based on height and weight cannot be
interpreted without sex*
• Sex of the infant/child is needed to interpret
indices of height-for-age, weight-for-age and
weight-for-height
weight-for-height
• Precise age is needed for height-for-age,
weight-for-age*
• Age is not needed for weight-for-height
* If the child doesn’t have a valid birth certificate an historical calendar will be used
to identify the date of birth (see FAO guidelines for determining of age of infants
and young children=
Mid-Upper Arm Circumference (MUAC) of children
6-60 months
See:http://www.unicef.org/nutrition/trai
In emergency situations use of the 3 colored
tape:
Red under 115 mm = severe acute
malnutrition
Yellow from 115 to 124 mm = moderate
Green from 125 mm = normal
32
http://www.who.int/childgrowth/standar
ds/second_set/chts_acfa_girls_z/en/inde
x.html
See:http://www.unicef.org/nutrition/trai
ning/3.1.3/2.html
In non-emergency situations use standards
by sex and age
Interpretation of anthropometric indices
• WHO has developed growth standards based on the
growth of healthy adequately fed* infants and young
children from several countries (2006)
• Normal growth is defined as the interval around the
median and +/- 2 standard deviations of these
children
• Weight and height of a child can be interpreted by
comparison to the age/sex standard (i.e. calculation
of the deviation from the median in standard
deviations or z-scores)
See: http://www.who.int/childgrowth/standards/en/
*Exclusively breastfed until 6 months, inter alia
Height and weight at a given age in a healthy population follow a normal distribution :
Height and weight for age of children surveyed can be described in terms
of standard deviations from the median of the reference (healthy) population
Height or weight for age less than -2 standard deviations from the reference median is
considered as stunting or underweight.
Weight for height less then -2 sd from the reference defines wasting.
Weight for height of more than +2 sd defines overweight
Height for age
measured in a
survey
Example of a stunted population: height for age is much lower than the reference
NB: standard deviation and z-score are synonymous
WHO Growth standard: Girls from birth to 24 months: Length for age
Month L M S SD SD3neg SD2neg SD1neg SD0 SD1 SD2 SD3
0 1 49.1477 0.03790 1.8627 43.6 45.4 47.3 49.1 51.0 52.9 54.7
1 1 53.6872 0.03640 1.9542 47.8 49.8 51.7 53.7 55.6 57.6 59.5
2 1 57.0673 0.03568 2.0362 51.0 53.0 55.0 57.1 59.1 61.1 63.2
3 1 59.8029 0.03520 2.1051 53.5 55.6 57.7 59.8 61.9 64.0 66.1
4 1 62.0899 0.03486 2.1645 55.6 57.8 59.9 62.1 64.3 66.4 68.6
WHO growth standards for infants and young children (WHO, 2006)
Example : girls’ length for age from birth to 24 months of age (partial)
http://www.who.int/childgrowth/standards/en/
Calculation of z-scores*
and prevalence of undernutrition in a population
4 1 62.0899 0.03486 2.1645 55.6 57.8 59.9 62.1 64.3 66.4 68.6
5 1 64.0301 0.03463 2.2174 57.4 59.6 61.8 64.0 66.2 68.5 70.7
6 1 65.7311 0.03448 2.2664 58.9 61.2 63.5 65.7 68.0 70.3 72.5
7 1 67.2873 0.03441 2.3154 60.3 62.7 65.0 67.3 69.6 71.9 74.2
8 1 68.7498 0.03440 2.3650 61.7 64.0 66.4 68.7 71.1 73.5 75.8
9 1 70.1435 0.03444 2.4157 62.9 65.3 67.7 70.1 72.6 75.0 77.4
In the reference population girls aged 9 months measure 70.1 cm on average (median
length). The standard deviation (SD) or z-score of the median is 2.4 cm
Girls with a length of less than -2 SD of the median, e.g measuring less than 65.3 cm
are considered stunted
Prevalence of stunting at 9 months is the % of girls with a length of less than 65.3 cm
Calculation of z-scores*(cont’d)
• For a particular child the z-score is:
z-score of the child= (observed height - median of the
standard) / z-score of the standard
• Example: the height of Adam, a boy aged 26 months, is 90 cm
• The median of the standard for boys of this age is 88.8 cm and
the z-score is 3.2 cm
• The z-score of Adam is: (90-88.8)/3.2=0.38
Adam’s height is in the normal range
• If Adam’s height were less than -2 z-score of the median, he
would be considered to be stunted
*NB : z-score and SD are synonymous
Calculation of z-scores
and prevalence of undernutrition (cont’d)
• Example: Anna, a girl aged 13 months,
measures 69.9 cm
• The median of the standard for girls of this age
is 75.2 cm and the z-score is 2.6 cm
• What is Anna’s Z-score ?
• Is she stunted ?
Calculation of z-scores (cont’d)
• Solution: Anna’s length, a girl aged 13 months, is
69.9 cm
• The median of the standard for girls of this age is
75.2 cm and the z-score is 2.6 cm
• The z-score of Anna is: (69.9-75.2)/2.6=-2.04
• Anna’s length is less than -2 z-score of the
median, she is stunted
• The proportion or % of children who have a
length/height for age less than -2 z-scores is the
prevalence of stunting
Note: the same principle is used for weight for age and weight for height
A table of z-scores or the Anthro freeware can be used to obtain a child’s z-score
Presenting results of a survey as mean
Z-scores : advantages
• The mean Z-score describes the nutritional status
of the whole population
• Less prone to error than prevalence because less
sensitive to outliers (due to measurement error)
• Value of the SD of the mean Z-score provides an
indication of data quality (SDs of mean z-scores
should be <1.3)
http://www.who.int/nutgrowthdb/about/introduction/en/index5.
html
Type of malnutrition and severity
• Chronic versus acute malnutrition
– Wasting is acute malnutrition
– GAM (global acute malnutrition is wasting and/or
oedema): GAM over 10% is an emergency (triggers an
immediate intervention) or based on MUAC
• Severity of malnutrition: -2 to <-3 z-scores is
moderate malnutrition, less than -3 is severe
– Severe wasting
– SAM (severe acute malnutrition): severe wasting
and/or oedema
– Severe stunting
Forms of severe acute malnutrition
42
Source: TALC
Wasted child (marasmus) Child with Oedema (kwashiorkor)
Note a child with Kwashiorkor can have a normal weight because of oedema
Remarks on the difference between
wasting and stunting
• Wasting is more easily detectable than stunting
• Wasting is the result of recent lack of food and
illness while stunting develops over time, often
starting during pregnancy
• Stunted mothers produce stunted babies
• Stunting has long term and permanent
consequences on health and cognitive
development
• Stunting is a cause and a consequence of poor
human development
Conclusion on Stunting:
indicator of poverty and loss of human capital
potential
Prevalence of stunting is highest amongst the poorest
segments of the population
Stunting is mostly irreversible after 2 years of life
Economic impact of stunting:
High rates of stunting persist in sub Saharan Africa and
parts of Asia (e.g. India)
- Decreased school attendance and learning ability
- Shorter adult height & lower income-earning capacity
- Decreased offspring birth weight
- Increased probability of transfer of poverty to next generation
Recognition of the importance of stunting for
human development:
Stunting is included in SDG 2
The Millenium Development Goals did not refer to reduction of
stunting
Since then stunting has been recognized as an indicator of poverty
Reduction of prevalence of childhood stunting marks success of
sustainable actions to alleviate hunger and poverty
Reducing stunting leads to higher levels of human development and
economic growth
Public health significance of prevalence levels
of undernutrition in infants and young children
(under five years of age)
Prevalence of stunting in infants and
young children <5 years
Region Prevalence
1990 (%)
Prevalence
2014 (%)
Numbers in
2014 (millions)
Africa 52 38 60
Americas 15 7 5
Americas 15 7 5
South East Asia 59 34 61
Eastern
Mediterranean
40 26 21
Global 40 24 159
Source: WHO Global health observatory data repository
Note: Although reduction in % has been important in South East Asia it is
still the continent with the highest number of stunted children
Prevalence of stunting by country
Source: Lancet series 2008
Prevalence of overweight/obesity in
infants and young children <5 years*
Region Prevalence
1990 (%)
Prevalence
2014 (%)
Numbers in
2014 (millions)
Africa 5.0 5.2 8.2
Americas 6.5 7.5 5.7
South East Asia 2.1 4.9 8.8
Source: WHO Global health observatory data repository
* Based on % of children with a weight-for-height of more than +2SD
of the median WHO standard
Body Mass Index (BMI)
ADULTS: BMI standards for adult men and women (except pregnant
women):
Below 18.5 = Underweight
BMI is equal to weight in kg divided by height in meters squared:
BMI = Weight (kg) / (Height (m) x Height (m))
Below 18.5 = Underweight
18.5 – 24.9 = Normal
25.0 – 29.9 = Overweight
30.0 and Above = Obese
INFANTS & CHILDREN : standards of BMI for age and sex
See: http://apps.who.int/bmi/index.jsp?introPage=intro_3.html
Note: BMI norms do not depend on age and sex for adults
while for all other age groups there is a standard for each age and sex group
WHO BMI for age growth curve
Characteristics of a good indicator
• Validity: provides an exact measure of the
phenomenon/variable of interest
• Has been validated in diverse contexts
• Specific of the variable of interest
• Sensitive to changes in the variable of interest
• Easy to measure and reproducible
• Relevant for the situation it is being used in:
Certain indicators are useful in situations of crisis and
others are more relevant outside of crisis
52
Data sources on anthropometric
assessment
• WHO global database on child growth and
malnutrition
http://www.who.int/nutgrowthdb/en/
• Nutrition landscaping indicator guide:
http://www.who.int/nutrition/nlis_interpretation_
guide.pdf
• Demographic and Health surveys (reports and
statcompiler)
http://www.measuredhs.com/

Introduction to malnutriton-dop-part-I.pdf

  • 1.
    Malnutrition, definition, causes, indicatorsfor assessment from a « Public Nutrition » perspective Master Human Development and Food Security, Roma III University, May 2016 Marie Claude Dop Nutripass Nutrition research unit, Institut de Recherche pour le Développement, Montpellier, France marieclaude.dop@ird.fr
  • 2.
    Course objectives • Understandthe concept of malnutrition and linkages to food security and human development • Realize the magnitude of the problem of malnutrition at global level • Know the principal causes of malnutrition in resource-poor contexts contexts • Identify vulnerable groups • Understand the key indicators for assessing under and overnutrition • Know the most important population-based preventive strategies for fighting malnutrition and the indicators that are useful for monitoring their impact • Be able to read critically reports on assessment of malnutrition
  • 3.
    Outline of thecourse • Introduction • Part I: anthropometric indicators • Part II: indicators of micronutrient deficiencies • Part III: the nutrition transition and the • Part III: the nutrition transition and the obesity epidemic • Part IV: Nutrition-sensitive interventions and programmes
  • 4.
  • 5.
    Why does nutritionmatter ? • Why include nutrition in a Master curriculum on Human Development and Food Security ? • What is the relationship between food security and nutrition ? security and nutrition ? • Why does nutrition matter to human development ? • Where does nutrition feature in Sustainable Development Goals ?
  • 6.
    Why does nutritionmatter ? • Is food insecurity related to nutrition ? – Nutrition is in the definition of food insecurity • Good nutrition is the basis of good health and human well-being – Therefore it is central to human development • Poor nutrition – affects populations’ health, intellectual and physical capacities; – it is a cause of poverty ; – it is often transmitted from one generation to the next
  • 7.
    Nutrition and theSDGs SDG2: End hunger, achieve food security and improved nutrition and promote sustainable agriculture
  • 8.
    Definitions Nutrition is theprovision of adequate energy and nutrients (in terms of amount and mix and timeliness) to the cells to enable them to perform their physiological function (of growth, reproduction, defense, repair, etc). growth, reproduction, defense, repair, etc). Malnutrition is the result of a lack or an excess in the provision of energy and/or nutrients to the body (undernutrition or overweight/obesity)
  • 9.
    Definitions (cont’d) • Nutritionalstatus is the state of the body in relation to nutrition: – Clinical, i.e. apparent signs of poor nutrition – Growth and development of the body: dimensions (anthropometric measures) such as – Growth and development of the body: dimensions (anthropometric measures) such as weight and height – Composition of the body and biochemical parameters • Dietary intake is separate from nutritional status
  • 10.
    Issues with terminology •Malnutrition refers to poor nutritional status • Undernourishment* is an FAO concept : it is the number or proportion of persons whose energy consumption is less than their minimum energy needs needs • “Malnourished” can refer to the state of malnutrition or to inadequate food intakes • Hunger is defined as “a feeling of discomfort or weakness caused by lack of food, coupled with the desire to eat” * Also designated as “chronic hunger”
  • 11.
    Types of malnutrition •Undernutrition: – Protein-energy malnutrition – Micronutrient deficiencies • Overnutrition: – Overweight and obesity – Overweight and obesity – Health consequences (diabetes, cardiovascular diseases) • Co-existence of under and overnutrition: “double burden of malnutrition” – Obesity and PEM in the same family – Obesity and micronutrient deficiencies in the same individual • Chronic and acute malnutrition
  • 12.
    Note that thisillustration does not include Childhood overweight/obesity which are also forms of malnutrition
  • 13.
    Examples of stuntedchildren 13 Children of the same age
  • 14.
    Understanding child malnutrition •Wasting means that the infant/child is thin: she/he has lost fat and muscle mass • Stunting means that the infant/child is short in stature: she/he did not grow in length/height stature: she/he did not grow in length/height has he/she should have • Underweight means that she/he weighs less than she/he should • A child can be both wasted and stunted
  • 15.
    Understanding child malnutrition •Wasting is usually due to a recent lack of food or illness (infections) that prevents the child from eating or absorbing nutrients of foods • Stunting is a long term process, often starting in utero which is due to the mother’s malnutrition, to food intake lacking quality (insufficient intake utero which is due to the mother’s malnutrition, to food intake lacking quality (insufficient intake of essential micronutrients) and the repetition of episodes of common infections • Overweight and obesity are due to excessive energy intake and lack of physical activity Note that overweight and obesity can co-exist with micronutrient deficiency and with stunting
  • 16.
    Wasted child (sourceTALC) Obese boys
  • 17.
    UNICEF conceptual modelof causes of malnutrition & mortality Intermediate causes Immediate causes Household food insecurity Inadequate caring for mothers and Inadequate environment Insufficient food intakes Illness Malnutrition and mortality causes Underlying causes insecurity for mothers and young children environment and health system Governmental and non-governmental institutions Political and ideological structure Economic context Potential resources
  • 18.
    Comments on theUNICEF conceptual model • The model is useful for understanding and distinguishing the causes of malnutrition: it distinguishes the short and long “routes” for fighting malnutrition • The model doesn’t take into consideration • The model doesn’t take into consideration overweight/obesity as a form of malnutrition or the double burden of malnutrition • It is focused on child malnutrition while malnutrition can affect all ages, but the concept can be applied to other age groups
  • 19.
    Impact of undernutritionon child mortality* Undernutrition is rarely a direct cause of death. It is most often an underlying cause of death from common illnesses of which it increases the occurrence and severity: Undernutrition is rarely a direct cause of death. It is most often an underlying cause of death from common illnesses of which it increases the occurrence and severity: * Among infants and children under five years, excluding neo-natal mortality occurrence and severity: approx. 45% of mortality due to common illnesses is attributed to malnutrition. Most deaths occur in moderately malnourished children occurrence and severity: approx. 45% of mortality due to common illnesses is attributed to malnutrition. Most deaths occur in moderately malnourished children
  • 20.
    Nutrition throughout thelife-cycle Example: The life-cycle approach applied to micronutrient deficiency
  • 21.
    The concept ofthe « 1000 days » window of opportunity • Undernutrition often starts in utero when mothers are malnourished and /or stunted : intra-uterine growth retardation • Undernutrition impairs physical growth and cognitive development development • After the age of 2 years damage is usually irreversible • Therefore it is crucial to fight malnutrition during pregnancy and the first 2 years of the child, i.e. the 1000 days between conception and the child’s second birthday • Many preventive interventions target this period of time (see SUN initiative)
  • 22.
    Purpose of nutritionassessment at population level • What proportion of the population is affected by malnutrition? how severely? • Who, Where and When are population groups affected? – age, sex, socio-economic or occupational status etc; – is seasonality a factor? • Is the problem worsening or improving (trends)? • What are the causes of malnutrition? • What can be changed to reduce the prevalence of malnutrition? • Are interventions efficient to reduce the prevalence of malnutrition? (impact assessment) Note : While food insecurity is often assessed at household level, nutrition is defined at individual level
  • 23.
    Types of indicatorsof nutritional status • Clinical indicators – Marasmus and Kwashiorkor (oedema) – Goiter – Xerophtalmia – Xerophtalmia • Anthropometric indicators (based on body measurements) • Biochemical indicators http://www.who.int/nutrition/nlis_interpretation_guide.pdf
  • 24.
  • 25.
    Measurements, indices andindicators • Measurements of body dimensions cannot be interpreted directly • Indices have a biological interpretation : – e.g. height for age – they can be expressed in comparison to a reference population (standard deviation from the median of a – they can be expressed in comparison to a reference population (standard deviation from the median of a reference population = standard) • Indicators : – a cut-point for the index is defined, differentiating normal and at risk individuals – the indicator is the % of individuals below (or above) the cut-point
  • 26.
    The most commonlyused body measurements and indices derived • Weight: – birth weight – weight for age • Height: – height for age – height for age – weight for height – body mass index • Mid upper arm circumference (MUAC) • Waist circumference On the basis of the indices, indicators are defined that correspond to a state of malnutrition
  • 27.
    Infant and youngchild anthropometric indices and indicators of undernutrition Wasting: low weight-for-height is a sign of acute malnutrition : Indicator = prevalence of wasting Stunting: low height-for-age is a sign of chronic malnutrition : Indicator = prevalence of stunting Underweight: low weight-for-age is a sign of acute or chronic malnutrition or both : Indicator = prevalence of underweight Underweight is an internationally recognized public health indicator for monitoring nutritional status and health in populations MUAC is also used to assess acute malnutrition, especially in situations where it is difficult to weigh children
  • 28.
    Measuring infants andyoung children • Measurements need to be exact and precise • Strict protocol for taking measurements • Sources of error are many • Imprecise age is a source of error • Imprecise age is a source of error • Personnel needs to be skilled • There exist standard tests for checking the skills of personnel at the start of a survey • Some checks of the validity of the collected data are possible
  • 29.
    How do wemeasure height/length? Children under 2 years Children from 2 years 29
  • 30.
    How to weighchildren? Using a hanging scale Using an electronic scale 30
  • 31.
    For infants andyoung children indicators based on height and weight cannot be interpreted without sex* • Sex of the infant/child is needed to interpret indices of height-for-age, weight-for-age and weight-for-height weight-for-height • Precise age is needed for height-for-age, weight-for-age* • Age is not needed for weight-for-height * If the child doesn’t have a valid birth certificate an historical calendar will be used to identify the date of birth (see FAO guidelines for determining of age of infants and young children=
  • 32.
    Mid-Upper Arm Circumference(MUAC) of children 6-60 months See:http://www.unicef.org/nutrition/trai In emergency situations use of the 3 colored tape: Red under 115 mm = severe acute malnutrition Yellow from 115 to 124 mm = moderate Green from 125 mm = normal 32 http://www.who.int/childgrowth/standar ds/second_set/chts_acfa_girls_z/en/inde x.html See:http://www.unicef.org/nutrition/trai ning/3.1.3/2.html In non-emergency situations use standards by sex and age
  • 33.
    Interpretation of anthropometricindices • WHO has developed growth standards based on the growth of healthy adequately fed* infants and young children from several countries (2006) • Normal growth is defined as the interval around the median and +/- 2 standard deviations of these median and +/- 2 standard deviations of these children • Weight and height of a child can be interpreted by comparison to the age/sex standard (i.e. calculation of the deviation from the median in standard deviations or z-scores) See: http://www.who.int/childgrowth/standards/en/ *Exclusively breastfed until 6 months, inter alia
  • 34.
    Height and weightat a given age in a healthy population follow a normal distribution : Height and weight for age of children surveyed can be described in terms of standard deviations from the median of the reference (healthy) population Height or weight for age less than -2 standard deviations from the reference median is considered as stunting or underweight. Weight for height less then -2 sd from the reference defines wasting. Weight for height of more than +2 sd defines overweight
  • 35.
    Height for age measuredin a survey Example of a stunted population: height for age is much lower than the reference NB: standard deviation and z-score are synonymous
  • 36.
    WHO Growth standard:Girls from birth to 24 months: Length for age Month L M S SD SD3neg SD2neg SD1neg SD0 SD1 SD2 SD3 0 1 49.1477 0.03790 1.8627 43.6 45.4 47.3 49.1 51.0 52.9 54.7 1 1 53.6872 0.03640 1.9542 47.8 49.8 51.7 53.7 55.6 57.6 59.5 2 1 57.0673 0.03568 2.0362 51.0 53.0 55.0 57.1 59.1 61.1 63.2 3 1 59.8029 0.03520 2.1051 53.5 55.6 57.7 59.8 61.9 64.0 66.1 4 1 62.0899 0.03486 2.1645 55.6 57.8 59.9 62.1 64.3 66.4 68.6 WHO growth standards for infants and young children (WHO, 2006) Example : girls’ length for age from birth to 24 months of age (partial) http://www.who.int/childgrowth/standards/en/ Calculation of z-scores* and prevalence of undernutrition in a population 4 1 62.0899 0.03486 2.1645 55.6 57.8 59.9 62.1 64.3 66.4 68.6 5 1 64.0301 0.03463 2.2174 57.4 59.6 61.8 64.0 66.2 68.5 70.7 6 1 65.7311 0.03448 2.2664 58.9 61.2 63.5 65.7 68.0 70.3 72.5 7 1 67.2873 0.03441 2.3154 60.3 62.7 65.0 67.3 69.6 71.9 74.2 8 1 68.7498 0.03440 2.3650 61.7 64.0 66.4 68.7 71.1 73.5 75.8 9 1 70.1435 0.03444 2.4157 62.9 65.3 67.7 70.1 72.6 75.0 77.4 In the reference population girls aged 9 months measure 70.1 cm on average (median length). The standard deviation (SD) or z-score of the median is 2.4 cm Girls with a length of less than -2 SD of the median, e.g measuring less than 65.3 cm are considered stunted Prevalence of stunting at 9 months is the % of girls with a length of less than 65.3 cm
  • 37.
    Calculation of z-scores*(cont’d) •For a particular child the z-score is: z-score of the child= (observed height - median of the standard) / z-score of the standard • Example: the height of Adam, a boy aged 26 months, is 90 cm • The median of the standard for boys of this age is 88.8 cm and • The median of the standard for boys of this age is 88.8 cm and the z-score is 3.2 cm • The z-score of Adam is: (90-88.8)/3.2=0.38 Adam’s height is in the normal range • If Adam’s height were less than -2 z-score of the median, he would be considered to be stunted *NB : z-score and SD are synonymous
  • 38.
    Calculation of z-scores andprevalence of undernutrition (cont’d) • Example: Anna, a girl aged 13 months, measures 69.9 cm • The median of the standard for girls of this age • The median of the standard for girls of this age is 75.2 cm and the z-score is 2.6 cm • What is Anna’s Z-score ? • Is she stunted ?
  • 39.
    Calculation of z-scores(cont’d) • Solution: Anna’s length, a girl aged 13 months, is 69.9 cm • The median of the standard for girls of this age is 75.2 cm and the z-score is 2.6 cm • The z-score of Anna is: (69.9-75.2)/2.6=-2.04 • The z-score of Anna is: (69.9-75.2)/2.6=-2.04 • Anna’s length is less than -2 z-score of the median, she is stunted • The proportion or % of children who have a length/height for age less than -2 z-scores is the prevalence of stunting Note: the same principle is used for weight for age and weight for height A table of z-scores or the Anthro freeware can be used to obtain a child’s z-score
  • 40.
    Presenting results ofa survey as mean Z-scores : advantages • The mean Z-score describes the nutritional status of the whole population • Less prone to error than prevalence because less sensitive to outliers (due to measurement error) sensitive to outliers (due to measurement error) • Value of the SD of the mean Z-score provides an indication of data quality (SDs of mean z-scores should be <1.3) http://www.who.int/nutgrowthdb/about/introduction/en/index5. html
  • 41.
    Type of malnutritionand severity • Chronic versus acute malnutrition – Wasting is acute malnutrition – GAM (global acute malnutrition is wasting and/or oedema): GAM over 10% is an emergency (triggers an immediate intervention) or based on MUAC immediate intervention) or based on MUAC • Severity of malnutrition: -2 to <-3 z-scores is moderate malnutrition, less than -3 is severe – Severe wasting – SAM (severe acute malnutrition): severe wasting and/or oedema – Severe stunting
  • 42.
    Forms of severeacute malnutrition 42 Source: TALC Wasted child (marasmus) Child with Oedema (kwashiorkor) Note a child with Kwashiorkor can have a normal weight because of oedema
  • 43.
    Remarks on thedifference between wasting and stunting • Wasting is more easily detectable than stunting • Wasting is the result of recent lack of food and illness while stunting develops over time, often starting during pregnancy • Stunted mothers produce stunted babies • Stunted mothers produce stunted babies • Stunting has long term and permanent consequences on health and cognitive development • Stunting is a cause and a consequence of poor human development
  • 44.
    Conclusion on Stunting: indicatorof poverty and loss of human capital potential Prevalence of stunting is highest amongst the poorest segments of the population Stunting is mostly irreversible after 2 years of life Economic impact of stunting: High rates of stunting persist in sub Saharan Africa and parts of Asia (e.g. India) - Decreased school attendance and learning ability - Shorter adult height & lower income-earning capacity - Decreased offspring birth weight - Increased probability of transfer of poverty to next generation
  • 45.
    Recognition of theimportance of stunting for human development: Stunting is included in SDG 2 The Millenium Development Goals did not refer to reduction of stunting Since then stunting has been recognized as an indicator of poverty Since then stunting has been recognized as an indicator of poverty Reduction of prevalence of childhood stunting marks success of sustainable actions to alleviate hunger and poverty Reducing stunting leads to higher levels of human development and economic growth
  • 46.
    Public health significanceof prevalence levels of undernutrition in infants and young children (under five years of age)
  • 47.
    Prevalence of stuntingin infants and young children <5 years Region Prevalence 1990 (%) Prevalence 2014 (%) Numbers in 2014 (millions) Africa 52 38 60 Americas 15 7 5 Americas 15 7 5 South East Asia 59 34 61 Eastern Mediterranean 40 26 21 Global 40 24 159 Source: WHO Global health observatory data repository Note: Although reduction in % has been important in South East Asia it is still the continent with the highest number of stunted children
  • 48.
    Prevalence of stuntingby country Source: Lancet series 2008
  • 49.
    Prevalence of overweight/obesityin infants and young children <5 years* Region Prevalence 1990 (%) Prevalence 2014 (%) Numbers in 2014 (millions) Africa 5.0 5.2 8.2 Americas 6.5 7.5 5.7 Americas 6.5 7.5 5.7 South East Asia 2.1 4.9 8.8 Source: WHO Global health observatory data repository * Based on % of children with a weight-for-height of more than +2SD of the median WHO standard
  • 50.
    Body Mass Index(BMI) ADULTS: BMI standards for adult men and women (except pregnant women): Below 18.5 = Underweight BMI is equal to weight in kg divided by height in meters squared: BMI = Weight (kg) / (Height (m) x Height (m)) Below 18.5 = Underweight 18.5 – 24.9 = Normal 25.0 – 29.9 = Overweight 30.0 and Above = Obese INFANTS & CHILDREN : standards of BMI for age and sex See: http://apps.who.int/bmi/index.jsp?introPage=intro_3.html Note: BMI norms do not depend on age and sex for adults while for all other age groups there is a standard for each age and sex group
  • 51.
    WHO BMI forage growth curve
  • 52.
    Characteristics of agood indicator • Validity: provides an exact measure of the phenomenon/variable of interest • Has been validated in diverse contexts • Specific of the variable of interest • Specific of the variable of interest • Sensitive to changes in the variable of interest • Easy to measure and reproducible • Relevant for the situation it is being used in: Certain indicators are useful in situations of crisis and others are more relevant outside of crisis 52
  • 53.
    Data sources onanthropometric assessment • WHO global database on child growth and malnutrition http://www.who.int/nutgrowthdb/en/ • Nutrition landscaping indicator guide: • Nutrition landscaping indicator guide: http://www.who.int/nutrition/nlis_interpretation_ guide.pdf • Demographic and Health surveys (reports and statcompiler) http://www.measuredhs.com/