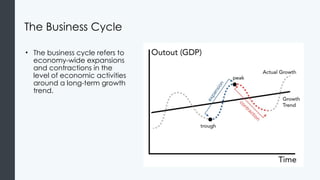
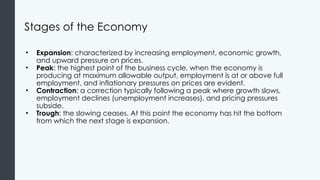
Introduction to Business
Economic Environment
Module Learning Outcomes
Explain fundamental economic principles and describe how they shape the
business environment
2.1: Explain what economics is and why it’s important
2.2: Describe the difference between major different economic systems
2.3: Explain the law of demand
2.4: Explain the law of supply
2.5: Explain market equilibrium, surplus, and shortage
2.6: Describe how economists evaluate the health of an economy
2.7: Identify and explain the four stages of an economy (expansion, peak, contraction, a
nd trough), and describe their impact on business operations
What is Economics?
Learning Outcomes: What is Economics?
2.1: Explain what economics is and why it’s important
2.1.1: Explain scarcity
2.1.2: Explain opportunity cost
2.1.3: Explain division of labor and specialization
2.1.4: Distinguish between macroeconomics and microeconomics
Defining
Economics
Economics is the study of how
humans make decisions in the
face of scarcity. Scarcity exists
when human wants for goods
and services exceed the
available supply. People make
decisions in their own self-
interest, weighing benefits and
costs.
Understanding Economics and Scarcity
The resources that we value—time, money, labor, tools, land, and raw materials
—exist in a limited supply. There are simply never enough resources to meet all
our needs and desires. This condition is known as scarcity.
Every society, at every level, must make choices about how it uses its resources.
Economics helps us understand the decisions that individuals, families,
businesses, or societies make, given the fact that there are never enough
resources to address all needs and desires.
The Concept of Opportunity Cost
Every time you make a choice about how to use resources, you are also
choosing to forego other options. Economists use the term opportunity cost to
indicate what must be given up to obtain something that’s desired. A
fundamental principle of economics is that every choice has an opportunity
cost.
Class Discussion: Individual and Societal Opportunity
Cost
• What are some individual decisions you make that involve opportunity cost?
• What are some societal decisions that involve opportunity cost?
Division of Labor and Specialization
• Division of labor. The work required
to produce a good or service is
separated into tasks performed by
different workers instead of all tasks
being performed by all workers.
• Specialization. When workers or
firms focus on tasks for which they
have an advantage within the
overall production process (special
skills, talents, and interests)
Economies of Scale
Economies of scale: As the level of production increases, the average cost of
producing each individual unit declines.
It is often most efficient to specialize and take advantage of economies of
scale and then use their income to trade for other goods and services.
When workers can use their income to purchase other goods and services the
need, they do not need to know anything about electronics or sound systems
to play music – they just download music on a device like a phone or a
computer, and listen.
Microeconomics and Macroeconomics
Microeconomics focuses on the actions of individual agents within the
economy, like households, workers, and businesses.
In microeconomics households make decisions about how to spend their
budgets. Individuals make decisions about whether to work, and how much
money they should save for the future.
Macroeconomics studies the economy as a whole. It focuses on goals such as
growth in the standard of living, low unemployment, and low inflation.
In macroeconomics governments use monetary policy and fiscal policy to
achieve macroeconomic goals, such as lowering unemployment and
increasing economic growth.
Monetary and Fiscal Policies
Macroeconomic policy pursues its goals through monetary policy and fiscal
policy:
Monetary policy, which involves policies that affect bank lending interest rates,
and financial capital markets, is conducted by a nation’s central bank. For the
United States, this is the Federal Reserve.
Fiscal policy, which involves government spending and taxes, is determined by
a nation’s legislative body. For the United States, this is the Congress and the
executive branch, which establishes a Federal Budget.
Practice Question 1
Suppose that a family decides to spend all of their available money on a fancy
vacation instead of purchasing a much needed new automobile. From an
economist’s perspective, which of the following statements about this decision
are likely to be true?
A. The decision is rational in the sense that it reflects the family’s preference for vacations
over new automobiles.
B. The decision is irrational because anyone can see that choosing a vacation over a
much needed automobile is an improper use of scarce resources.
C. The decision must have been made haphazardly and is therefore irrational.
Practice Question 2
Take a stab at this question (you’ll
need to do some multiplication).
Every day, 500,000 drivers in Los
Angeles incur an additional 30
minutes of traffic delays when
commuting by car to their jobs. In
Boston, the delays amount to 45
minutes for 200,000 drivers. If the
price of time is $15/hour in Los
Angeles and $25/hour in Boston,
which city incurs the largest
opportunity cost?
A. Los Angeles
B. Boston
C. Neither
Practice Question 3
Smith’s theory of the division and
specialization of labor implies that a
worker skilled in engineering will:
A. negatively affect economic output if
employed in anything but engineering
B. yield economic output that is sub-
optimal if she were employed in
something other than engineering-type
functions
C. improve economic output
Practice Question 4
An economy is composed entirely of two
equally sized farms A and B producing
both eggs and milk. Farm A is better at
producing eggs than Farm B which is
better at producing milk. Then in order to
maximize output, Farm A should:
A. Abandon the production of milk to fully
specialize in the production of eggs and
then trade with Farm B for milk.
B. Produce both eggs and milk on its own
and sell its excess eggs to B for additional
milk.
C. Reduce its production of eggs in order to
commit resources to learn how to better
produce milk.
Economic Systems
Learning Outcomes: Economic Systems
2.2: Describe and differentiate between major different economic
systems
2.2.1: Distinguish between market, planned, and mixed economies
Market Economies
A market is any situation that brings together buyers and sellers of goods and
services.
In a market economy, decisions about that products are available and at what
prices are determined through the interaction of supply and demand.
A competitive market has a large numbers of buyers and sellers, so no one can
control the market price.
A free market is one in which the government does not intervene in any way.
A free and competitive market economy is the ideal type of market economy
because what is supplied is exactly what consumers demand.
Planned Economies
In a planned or command economy economic effort is devoted to goals
passed down from a ruler or ruling class, and resources and businesses are
owned by the government.
The government decides which goods and services will be provided and what
prices will be charged for them. The government decides what methods of
production will be used and how much workers will be paid.
Some necessities like health care and education are provided free, as long as
the state determines you need them.
Economic Systems and Globalization
More countries’ economies are evolving into a mixed-economy which has
characteristics of more than one system.
The last few decades have seen globalization evolve as a result of growth in
commercial and financial networks that cross national borders, making
businesses and workers from different economies increasingly interdependent.
Economic Systems Recap
Economic systems determine:
1. What goods and services should be produced to meet consumer needs?
2. How should they be produced, and who should produce them?
3. Who should receive goods and services?
Free market: these decisions are made by the collective decisions of the
market. Producers and consumers make rational decisions about what will
satisfy their self interest and maximize profits.
Even in market economies governments will maintain the rule of law, create
public goods and services such as roads and education, and step in when the
market gets things wrong.
In a planned economy the government makes most decisions about what will
be produced and what the prices will be.
Demand
Learning Outcomes: Demand
2.3: Explain the law of demand
2.3.1: Explain the law of demand
2.3.2: Explain a demand curve
2.3.3: Explain the factors that change demand
What is Demand?
Demand: the amount of some good or
service consumers are willing and able
to purchase at each price.
Price: what a buyer pays for a unit of a
specific good or service.
Quantity demanded: total number of
units purchased at a specific price.
The law of demand states that, other
things being equal, a higher price
typically leads to a lower quantity
demanded.
Demand Curve
A demand curve shows the relationship
between quantity demanded and
price in a given market on a graph
(right).
The Ceteris Paribus Assumption
Ceteris Paribus: the assumption behind a demand curve or a supply curve is
that no relevant economic factors, other than the product’s price, is changing.
Any given demand or supply curve is based on the ceteris paribus assumption
that all else is held equal: a supply curve and a demand curve is the
relationship between two, and only two, variables when all other variables are
held equal.
Change in Quantity Demanded
A change in quantity demanded refers to a movement along the demand
curve, which is caused only by price change.
Change in Demand
A change in demand refers to a shift in the entire demand curve. The entire
demand curve will either shift right or shift left.
Factors affecting demand: preferences, incomes, prices of substitutes and
complements, expectations, population, etc.
Factors Affecting Demand
Income: As income increases, the demand for normal goods increases. A
product whose demand falls when income rises is called an inferior good.
Preferences: From 1980 to 2012 the per-person consumption of chicken rose by
48 lbs a year while the per-person consumption of beef fell by 20 lbs. This
change in consumption would shift the demand curve for chicken to the right
and the demand curve for beef to the left.
Composition of population: The percentage of the U.S. population that is elderly
is projected to be 20% by the year 2030. That’s a 7.4% increase from 2000. A shift
in population composition like this would lead to an increase of demand for
nursing homes and hearing aids.
More Factors Affecting Demand
Changes in price of related goods: The demand for a product can be affected
by changes in the prices of related goods like substitutes and complements.
• A substitute is a good or service that can used in place of another good or
service like electronic books and print books. If the price for a substitute
decreases, demand for that item would increase and would lower demand
for the item with the relatively higher price.
• Complements are goods that are often used together like breakfast cereal
and milk. A lower price for breakfast cereal would increase demand for that
good and likely increase demand for milk, its complement.
Changes in expectations about future prices or other factors that affect
demand: if the price of an item is expected to rise in the future, demand may
be increased now as people buy more to stock up.
Supply
Learning Outcomes: Supply
2.4: Explain the law of supply
2.4.1: Explain the law of supply
2.4.2: Explain a supply curve
2.4.3: Explain the factors that change supply
What is Supply?
• The law of supply says that a
higher price typically leads to a
higher quantity supplied.
• A supply curve (right) shows the
relationship between quantity
supplied and price on a graph.
Supply Curve
When economists talk about supply, they mean the amount of some good or
service a producer is willing to supply at each price.
A rise in price almost always results in an increase in the quantity supplied of
that good or service, while a fall in price would result in a reduction of quantity
supplied.
When economists refer to quantity supplied, they mean only a certain point on
the supply curve, or one quantity on the supply schedule.
Supply Curve Example
Supply Schedule: Example
Price (per gallon) Quantity Supplied (millions of gallons)
$1.00 500
$1.20 550
$1.40 600
$1.60 640
$1.80 680
$2.00 700
$2.20 720
Factors Affecting Supply
A shift in supply means a change in the quantity supplied at every price.
Cost of inputs: when the cost of labor, materials, machinery, etc. decreases, it
makes it less expensive for firms to produce outputs, so their profits increase, and
they will be incentivized to produce more outputs. If the cost of inputs increases,
their profits will go down and they will be incentivized to produce less outputs.
Other factors can affect the cost of production, including:
• Weather or natural conditions
• New technologies for production
• Government policies (taxes, subsidies)
Shifts in Supply
Equilibrium
Learning Outcomes: Equilibrium
2.5: Explain market equilibrium, surplus, and shortage
2.5.1: Explain surpluses and shortages
2.5.2: Explain equilibrium price and quantity
Equilibrium, Price, and Quantity
The equilibrium price and equilibrium quantity occur where the supply and
demand curves cross since the quantity demanded is equal to the quantity
supplied.
Surplus and Shortage
• When the price is below the
equilibrium level, excess demand
or a shortage will exist.
• If the price is above the equilibrium
level, excess supply or a surplus will
exist.
• In either case, economic pressures
will push the price toward the
equilibrium level.
Surplus
• If the price is above the equilibrium
level, excess supply or a surplus will
exist.
Shortage
• When the price is below the
equilibrium level, excess demand
or a shortage will exist.
• In either case of surplus or
shortage, economic pressures will
push the price toward the
equilibrium level.
Equilibrium and Economic Efficiency
If a market is not at equilibrium economic pressures will move the market
towards the equilibrium price and equilibrium quantity. This balance is a natural
function of a free-market economy.
Economists typically define efficiency as: when it is impossible to improve a
situation for one party without imposing a cost on another. If a situation is
inefficient, if becomes possible to benefit at least one party without imposing
costs on others.
Health of the Economy
Learning Outcomes: Health of the Economy
2.6: Describe how economists evaluate the health of an economy
2.6.1: Explain the use of GDP as an economic indicator
Economic Indicators and Economic Goals
An economic indicator is a statistic that provides valuable information about
the economy.
Lagging economic indicators report the status of the economy a few months in
the past.
Leading economic indicators predict the status of the economy three to twelve
months into the future.
The world’s market based economies all share the following three main goals:
1. Growth
2. High employment
3. Price stability
Measuring the Health of the Economy
Economic Goal Economic Indicator
Growth gross domestic product (GDP)—the market
value of all goods and services produced by
the economy in a given year. If GDP goes up,
the economy is growing; if it goes down, the
economy is contracting.
High Employment unemployment rate—the percentage of the
labor force that’s unemployed and actively
seeking work. The unemployment rate goes up
during periods when the economy is in
decline and down when the economy is
expanding.
Price Stability The consumer price index (CPI) measures
inflation by determining the change in prices of
a hypothetical basket of goods bought by a
typical household.
Growth
Measuring growth with Gross Domestic Product (GDP) involves counting up the
production of millions of different goods and services produced in a given year
and summing them to a total dollar value using the price at which each
product was sold.
GDP only refers to the goods produced within a particular country.
Intermediate goods, goods like plywood or steel that are used as inputs to
produce other goods, are not included in this calculation. This would cause a
double accounting.
High Employment
A country’s unemployment level is one of the most important economic
indicators. Unemployment can create a slow down in the economy which can
lead to even more unemployment.
Three categories of unemployment:
• Cyclical unemployment occurs when there is not enough total demand in
the economy to provide jobs for everyone who wants to work.
• Structural unemployment occurs when a labor market is unable to provide
jobs for everyone who wants to work because there is a mismatch between
the skills of the unemployed workers and the skills needed in available jobs.
• Frictional unemployment is the time period between jobs when a worker is
searching or transitioning from one job to another. Sometimes also called
search unemployment.
Price Stability
Price stability occurs when prices remain largely unchanged and there isn’t
rapid inflation or deflation.
Inflation: the rise in the general price level of goods and services during a
period of time.
Deflation: the decrease in the general price level of goods and services during
a period of time.
Hyperinflation: a rapid rise in inflation.
Most economists believe that a steady level of low-to-moderate inflation is are
ideal.
Consumer Price Index (CPI)
Consumer Price Index (CPI): measures changes in the price level of consumer
goods and and services purchase by households.
The CPI market basket consists of 8 major groups:
• Food and beverages
• Housing
• Apparel
• Transportation
• Medical care
• Recreation
• Education and communication
• Other goods and services
Consumer Confidence Index
The Consumer Confidence Index (CCI) measures the degree of optimism that
consumers feel about the overall state of the economy and their personal
financial situation.
How confident people feel about the stability of their incomes determines their
spending activity and therefore serves as one of the key indicators for the
overall shape of the economy. If consumer confidence is lower, they are more
likely to spend less and save more.
If businesses can make predictions about consumer confidence, they can
gauge the willingness of consumers to buy new products. If confidence is
dropping and consumers are expected to buy less, producers will tend to lower
their production.
Economic Stages
Learning Outcomes: Economic Stages
2.7: Identify and explain the four stages of an economy (expansion,
peak, contraction, and trough) and describe their impact on business
operations
2.7.1: Explain the business cycle
2.7.2: Differentiate between expansion, recession, and depression
The Business Cycle
• The business cycle refers to
economy-wide expansions
and contractions in the
level of economic activities
around a long-term growth
trend.
Class Discussion: The Business Cycle and You
What is usually the best time in the business cycle to:
• look for a job?
• start a business?
• buy stock or property?
a) Trough b) Expansion c) Peak d) Contraction
Stages of the Economy
• Expansion: characterized by increasing employment, economic growth,
and upward pressure on prices.
• Peak: the highest point of the business cycle, when the economy is
producing at maximum allowable output, employment is at or above full
employment, and inflationary pressures on prices are evident.
• Contraction: a correction typically following a peak where growth slows,
employment declines (unemployment increases), and pricing pressures
subside.
• Trough: the slowing ceases. At this point the economy has hit the bottom
from which the next stage is expansion.
Business Cycle Fluctuations
Business cycle fluctuations occur around a long-term growth trend just like
economic cycles, but unlike economic cycles they are measured in terms of
the growth rate of real gross domestic product (Real GDP).
Real GDP is the inflation adjusted value of the goods and services produced by
labor and property located in the United States.
Recessions and Depressions
The National Bureau of Economic Research defines a recession as “a
significant decline in economic activity spread across the economy, lasting
more than a few months, normally visible in real GDP, real income,
employment, industrial production.”
If the economy does not begin to expand again, then the economy may be
considered to be in a state of depression.
Practice Question 5
If the economy is currently
experiencing high growth and
inflation combined with low
unemployment, it is likely to be at
which phase of the business cycle?
A. recession or contraction
B. expansion
C. trough
Quick Review
• What is economics?
• What are planned and market economic systems and how do they differ?
• What is the law of demand?
• What is the law of supply?
• What are market equilibrium, surplus, and shortage?
• How do economists evaluate the health of an economy?
• What are the four stages of the economy? How do they impact business
operations?

Introduction to business slides chapter two

  • 1.
  • 2.
    Module Learning Outcomes Explainfundamental economic principles and describe how they shape the business environment 2.1: Explain what economics is and why it’s important 2.2: Describe the difference between major different economic systems 2.3: Explain the law of demand 2.4: Explain the law of supply 2.5: Explain market equilibrium, surplus, and shortage 2.6: Describe how economists evaluate the health of an economy 2.7: Identify and explain the four stages of an economy (expansion, peak, contraction, a nd trough), and describe their impact on business operations
  • 3.
  • 4.
    Learning Outcomes: Whatis Economics? 2.1: Explain what economics is and why it’s important 2.1.1: Explain scarcity 2.1.2: Explain opportunity cost 2.1.3: Explain division of labor and specialization 2.1.4: Distinguish between macroeconomics and microeconomics
  • 5.
    Defining Economics Economics is thestudy of how humans make decisions in the face of scarcity. Scarcity exists when human wants for goods and services exceed the available supply. People make decisions in their own self- interest, weighing benefits and costs.
  • 6.
    Understanding Economics andScarcity The resources that we value—time, money, labor, tools, land, and raw materials —exist in a limited supply. There are simply never enough resources to meet all our needs and desires. This condition is known as scarcity. Every society, at every level, must make choices about how it uses its resources. Economics helps us understand the decisions that individuals, families, businesses, or societies make, given the fact that there are never enough resources to address all needs and desires.
  • 7.
    The Concept ofOpportunity Cost Every time you make a choice about how to use resources, you are also choosing to forego other options. Economists use the term opportunity cost to indicate what must be given up to obtain something that’s desired. A fundamental principle of economics is that every choice has an opportunity cost.
  • 8.
    Class Discussion: Individualand Societal Opportunity Cost • What are some individual decisions you make that involve opportunity cost? • What are some societal decisions that involve opportunity cost?
  • 9.
    Division of Laborand Specialization • Division of labor. The work required to produce a good or service is separated into tasks performed by different workers instead of all tasks being performed by all workers. • Specialization. When workers or firms focus on tasks for which they have an advantage within the overall production process (special skills, talents, and interests)
  • 10.
    Economies of Scale Economiesof scale: As the level of production increases, the average cost of producing each individual unit declines. It is often most efficient to specialize and take advantage of economies of scale and then use their income to trade for other goods and services. When workers can use their income to purchase other goods and services the need, they do not need to know anything about electronics or sound systems to play music – they just download music on a device like a phone or a computer, and listen.
  • 11.
    Microeconomics and Macroeconomics Microeconomicsfocuses on the actions of individual agents within the economy, like households, workers, and businesses. In microeconomics households make decisions about how to spend their budgets. Individuals make decisions about whether to work, and how much money they should save for the future. Macroeconomics studies the economy as a whole. It focuses on goals such as growth in the standard of living, low unemployment, and low inflation. In macroeconomics governments use monetary policy and fiscal policy to achieve macroeconomic goals, such as lowering unemployment and increasing economic growth.
  • 12.
    Monetary and FiscalPolicies Macroeconomic policy pursues its goals through monetary policy and fiscal policy: Monetary policy, which involves policies that affect bank lending interest rates, and financial capital markets, is conducted by a nation’s central bank. For the United States, this is the Federal Reserve. Fiscal policy, which involves government spending and taxes, is determined by a nation’s legislative body. For the United States, this is the Congress and the executive branch, which establishes a Federal Budget.
  • 13.
    Practice Question 1 Supposethat a family decides to spend all of their available money on a fancy vacation instead of purchasing a much needed new automobile. From an economist’s perspective, which of the following statements about this decision are likely to be true? A. The decision is rational in the sense that it reflects the family’s preference for vacations over new automobiles. B. The decision is irrational because anyone can see that choosing a vacation over a much needed automobile is an improper use of scarce resources. C. The decision must have been made haphazardly and is therefore irrational.
  • 14.
    Practice Question 2 Takea stab at this question (you’ll need to do some multiplication). Every day, 500,000 drivers in Los Angeles incur an additional 30 minutes of traffic delays when commuting by car to their jobs. In Boston, the delays amount to 45 minutes for 200,000 drivers. If the price of time is $15/hour in Los Angeles and $25/hour in Boston, which city incurs the largest opportunity cost? A. Los Angeles B. Boston C. Neither
  • 15.
    Practice Question 3 Smith’stheory of the division and specialization of labor implies that a worker skilled in engineering will: A. negatively affect economic output if employed in anything but engineering B. yield economic output that is sub- optimal if she were employed in something other than engineering-type functions C. improve economic output
  • 16.
    Practice Question 4 Aneconomy is composed entirely of two equally sized farms A and B producing both eggs and milk. Farm A is better at producing eggs than Farm B which is better at producing milk. Then in order to maximize output, Farm A should: A. Abandon the production of milk to fully specialize in the production of eggs and then trade with Farm B for milk. B. Produce both eggs and milk on its own and sell its excess eggs to B for additional milk. C. Reduce its production of eggs in order to commit resources to learn how to better produce milk.
  • 17.
  • 18.
    Learning Outcomes: EconomicSystems 2.2: Describe and differentiate between major different economic systems 2.2.1: Distinguish between market, planned, and mixed economies
  • 19.
    Market Economies A marketis any situation that brings together buyers and sellers of goods and services. In a market economy, decisions about that products are available and at what prices are determined through the interaction of supply and demand. A competitive market has a large numbers of buyers and sellers, so no one can control the market price. A free market is one in which the government does not intervene in any way. A free and competitive market economy is the ideal type of market economy because what is supplied is exactly what consumers demand.
  • 20.
    Planned Economies In aplanned or command economy economic effort is devoted to goals passed down from a ruler or ruling class, and resources and businesses are owned by the government. The government decides which goods and services will be provided and what prices will be charged for them. The government decides what methods of production will be used and how much workers will be paid. Some necessities like health care and education are provided free, as long as the state determines you need them.
  • 21.
    Economic Systems andGlobalization More countries’ economies are evolving into a mixed-economy which has characteristics of more than one system. The last few decades have seen globalization evolve as a result of growth in commercial and financial networks that cross national borders, making businesses and workers from different economies increasingly interdependent.
  • 22.
    Economic Systems Recap Economicsystems determine: 1. What goods and services should be produced to meet consumer needs? 2. How should they be produced, and who should produce them? 3. Who should receive goods and services? Free market: these decisions are made by the collective decisions of the market. Producers and consumers make rational decisions about what will satisfy their self interest and maximize profits. Even in market economies governments will maintain the rule of law, create public goods and services such as roads and education, and step in when the market gets things wrong. In a planned economy the government makes most decisions about what will be produced and what the prices will be.
  • 23.
  • 24.
    Learning Outcomes: Demand 2.3:Explain the law of demand 2.3.1: Explain the law of demand 2.3.2: Explain a demand curve 2.3.3: Explain the factors that change demand
  • 25.
    What is Demand? Demand:the amount of some good or service consumers are willing and able to purchase at each price. Price: what a buyer pays for a unit of a specific good or service. Quantity demanded: total number of units purchased at a specific price. The law of demand states that, other things being equal, a higher price typically leads to a lower quantity demanded.
  • 26.
    Demand Curve A demandcurve shows the relationship between quantity demanded and price in a given market on a graph (right).
  • 27.
    The Ceteris ParibusAssumption Ceteris Paribus: the assumption behind a demand curve or a supply curve is that no relevant economic factors, other than the product’s price, is changing. Any given demand or supply curve is based on the ceteris paribus assumption that all else is held equal: a supply curve and a demand curve is the relationship between two, and only two, variables when all other variables are held equal.
  • 28.
    Change in QuantityDemanded A change in quantity demanded refers to a movement along the demand curve, which is caused only by price change.
  • 29.
    Change in Demand Achange in demand refers to a shift in the entire demand curve. The entire demand curve will either shift right or shift left. Factors affecting demand: preferences, incomes, prices of substitutes and complements, expectations, population, etc.
  • 30.
    Factors Affecting Demand Income:As income increases, the demand for normal goods increases. A product whose demand falls when income rises is called an inferior good. Preferences: From 1980 to 2012 the per-person consumption of chicken rose by 48 lbs a year while the per-person consumption of beef fell by 20 lbs. This change in consumption would shift the demand curve for chicken to the right and the demand curve for beef to the left. Composition of population: The percentage of the U.S. population that is elderly is projected to be 20% by the year 2030. That’s a 7.4% increase from 2000. A shift in population composition like this would lead to an increase of demand for nursing homes and hearing aids.
  • 31.
    More Factors AffectingDemand Changes in price of related goods: The demand for a product can be affected by changes in the prices of related goods like substitutes and complements. • A substitute is a good or service that can used in place of another good or service like electronic books and print books. If the price for a substitute decreases, demand for that item would increase and would lower demand for the item with the relatively higher price. • Complements are goods that are often used together like breakfast cereal and milk. A lower price for breakfast cereal would increase demand for that good and likely increase demand for milk, its complement. Changes in expectations about future prices or other factors that affect demand: if the price of an item is expected to rise in the future, demand may be increased now as people buy more to stock up.
  • 32.
  • 33.
    Learning Outcomes: Supply 2.4:Explain the law of supply 2.4.1: Explain the law of supply 2.4.2: Explain a supply curve 2.4.3: Explain the factors that change supply
  • 34.
    What is Supply? •The law of supply says that a higher price typically leads to a higher quantity supplied. • A supply curve (right) shows the relationship between quantity supplied and price on a graph.
  • 35.
    Supply Curve When economiststalk about supply, they mean the amount of some good or service a producer is willing to supply at each price. A rise in price almost always results in an increase in the quantity supplied of that good or service, while a fall in price would result in a reduction of quantity supplied. When economists refer to quantity supplied, they mean only a certain point on the supply curve, or one quantity on the supply schedule.
  • 36.
  • 37.
    Supply Schedule: Example Price(per gallon) Quantity Supplied (millions of gallons) $1.00 500 $1.20 550 $1.40 600 $1.60 640 $1.80 680 $2.00 700 $2.20 720
  • 38.
    Factors Affecting Supply Ashift in supply means a change in the quantity supplied at every price. Cost of inputs: when the cost of labor, materials, machinery, etc. decreases, it makes it less expensive for firms to produce outputs, so their profits increase, and they will be incentivized to produce more outputs. If the cost of inputs increases, their profits will go down and they will be incentivized to produce less outputs. Other factors can affect the cost of production, including: • Weather or natural conditions • New technologies for production • Government policies (taxes, subsidies)
  • 39.
  • 40.
  • 41.
    Learning Outcomes: Equilibrium 2.5:Explain market equilibrium, surplus, and shortage 2.5.1: Explain surpluses and shortages 2.5.2: Explain equilibrium price and quantity
  • 42.
    Equilibrium, Price, andQuantity The equilibrium price and equilibrium quantity occur where the supply and demand curves cross since the quantity demanded is equal to the quantity supplied.
  • 43.
    Surplus and Shortage •When the price is below the equilibrium level, excess demand or a shortage will exist. • If the price is above the equilibrium level, excess supply or a surplus will exist. • In either case, economic pressures will push the price toward the equilibrium level.
  • 44.
    Surplus • If theprice is above the equilibrium level, excess supply or a surplus will exist.
  • 45.
    Shortage • When theprice is below the equilibrium level, excess demand or a shortage will exist. • In either case of surplus or shortage, economic pressures will push the price toward the equilibrium level.
  • 46.
    Equilibrium and EconomicEfficiency If a market is not at equilibrium economic pressures will move the market towards the equilibrium price and equilibrium quantity. This balance is a natural function of a free-market economy. Economists typically define efficiency as: when it is impossible to improve a situation for one party without imposing a cost on another. If a situation is inefficient, if becomes possible to benefit at least one party without imposing costs on others.
  • 47.
  • 48.
    Learning Outcomes: Healthof the Economy 2.6: Describe how economists evaluate the health of an economy 2.6.1: Explain the use of GDP as an economic indicator
  • 49.
    Economic Indicators andEconomic Goals An economic indicator is a statistic that provides valuable information about the economy. Lagging economic indicators report the status of the economy a few months in the past. Leading economic indicators predict the status of the economy three to twelve months into the future. The world’s market based economies all share the following three main goals: 1. Growth 2. High employment 3. Price stability
  • 50.
    Measuring the Healthof the Economy Economic Goal Economic Indicator Growth gross domestic product (GDP)—the market value of all goods and services produced by the economy in a given year. If GDP goes up, the economy is growing; if it goes down, the economy is contracting. High Employment unemployment rate—the percentage of the labor force that’s unemployed and actively seeking work. The unemployment rate goes up during periods when the economy is in decline and down when the economy is expanding. Price Stability The consumer price index (CPI) measures inflation by determining the change in prices of a hypothetical basket of goods bought by a typical household.
  • 51.
    Growth Measuring growth withGross Domestic Product (GDP) involves counting up the production of millions of different goods and services produced in a given year and summing them to a total dollar value using the price at which each product was sold. GDP only refers to the goods produced within a particular country. Intermediate goods, goods like plywood or steel that are used as inputs to produce other goods, are not included in this calculation. This would cause a double accounting.
  • 52.
    High Employment A country’sunemployment level is one of the most important economic indicators. Unemployment can create a slow down in the economy which can lead to even more unemployment. Three categories of unemployment: • Cyclical unemployment occurs when there is not enough total demand in the economy to provide jobs for everyone who wants to work. • Structural unemployment occurs when a labor market is unable to provide jobs for everyone who wants to work because there is a mismatch between the skills of the unemployed workers and the skills needed in available jobs. • Frictional unemployment is the time period between jobs when a worker is searching or transitioning from one job to another. Sometimes also called search unemployment.
  • 53.
    Price Stability Price stabilityoccurs when prices remain largely unchanged and there isn’t rapid inflation or deflation. Inflation: the rise in the general price level of goods and services during a period of time. Deflation: the decrease in the general price level of goods and services during a period of time. Hyperinflation: a rapid rise in inflation. Most economists believe that a steady level of low-to-moderate inflation is are ideal.
  • 54.
    Consumer Price Index(CPI) Consumer Price Index (CPI): measures changes in the price level of consumer goods and and services purchase by households. The CPI market basket consists of 8 major groups: • Food and beverages • Housing • Apparel • Transportation • Medical care • Recreation • Education and communication • Other goods and services
  • 55.
    Consumer Confidence Index TheConsumer Confidence Index (CCI) measures the degree of optimism that consumers feel about the overall state of the economy and their personal financial situation. How confident people feel about the stability of their incomes determines their spending activity and therefore serves as one of the key indicators for the overall shape of the economy. If consumer confidence is lower, they are more likely to spend less and save more. If businesses can make predictions about consumer confidence, they can gauge the willingness of consumers to buy new products. If confidence is dropping and consumers are expected to buy less, producers will tend to lower their production.
  • 56.
  • 57.
    Learning Outcomes: EconomicStages 2.7: Identify and explain the four stages of an economy (expansion, peak, contraction, and trough) and describe their impact on business operations 2.7.1: Explain the business cycle 2.7.2: Differentiate between expansion, recession, and depression
  • 58.
    The Business Cycle •The business cycle refers to economy-wide expansions and contractions in the level of economic activities around a long-term growth trend.
  • 59.
    Class Discussion: TheBusiness Cycle and You What is usually the best time in the business cycle to: • look for a job? • start a business? • buy stock or property? a) Trough b) Expansion c) Peak d) Contraction
  • 60.
    Stages of theEconomy • Expansion: characterized by increasing employment, economic growth, and upward pressure on prices. • Peak: the highest point of the business cycle, when the economy is producing at maximum allowable output, employment is at or above full employment, and inflationary pressures on prices are evident. • Contraction: a correction typically following a peak where growth slows, employment declines (unemployment increases), and pricing pressures subside. • Trough: the slowing ceases. At this point the economy has hit the bottom from which the next stage is expansion.
  • 61.
    Business Cycle Fluctuations Businesscycle fluctuations occur around a long-term growth trend just like economic cycles, but unlike economic cycles they are measured in terms of the growth rate of real gross domestic product (Real GDP). Real GDP is the inflation adjusted value of the goods and services produced by labor and property located in the United States.
  • 62.
    Recessions and Depressions TheNational Bureau of Economic Research defines a recession as “a significant decline in economic activity spread across the economy, lasting more than a few months, normally visible in real GDP, real income, employment, industrial production.” If the economy does not begin to expand again, then the economy may be considered to be in a state of depression.
  • 63.
    Practice Question 5 Ifthe economy is currently experiencing high growth and inflation combined with low unemployment, it is likely to be at which phase of the business cycle? A. recession or contraction B. expansion C. trough
  • 64.
    Quick Review • Whatis economics? • What are planned and market economic systems and how do they differ? • What is the law of demand? • What is the law of supply? • What are market equilibrium, surplus, and shortage? • How do economists evaluate the health of an economy? • What are the four stages of the economy? How do they impact business operations?

Editor's Notes

  • #1 Cover Image: "My desk at home." Authored by: STIL. Provided by: Unsplash. Located at: https://unsplash.com/photos/zv5QSKaP8G8. Content Type: CC Licensed Content, Shared Previously. License: CC0: No Rights Reserved. License Terms: Unsplash License. All text in these slides is taken from https://courses.lumenlearning.com/wmopen-introductiontobusiness where it is published under one or more open licenses. All images in these slides are attributed in the notes of the slide on which they appear and licensed as indicated.
  • #7 Zwei Tu00fcren / Two Doors. Authored by: Stefan W. Located at: https://www.flickr.com/photos/stefan-w/5355424756/. License: CC BY: Attribution
  • #8 Answers may vary, but here are some examples: Individual decisions: If you spend $8 on lunch every day at work but you know bringing lunch from home would cost $3 each day, the opportunity cost of eating at a restaurant is $5 a day. Societal decisions: Universal health case would be beneficial, but the funding would likely have to come out of a different budget like environmental protection, or national defense, because resources are limited.
  • #9 Red Wing Shoes Factory Tour. Authored by: Nina Hale. Located at: https://www.flickr.com/photos/94693506@N00/4643862950/. License: CC BY: Attribution
  • #13 Correct answer: A— Economists have to make broad assumptions about behavior and therefore choices of individual agents under conditions of scarcity. If the family decides to take the vacation instead of the automobile, economists must assume that it reflects their preferences even if the decision may seem irrational to outside observers.
  • #14 Correct answer: C— Both incur the same opportunity cost. Costs in Los Angeles = 0.5 hours x 500,000 drivers at $15/hour imply a cost of $3,750,000. In Boston, 0.75 hours x 200,000 drivers at $25 per hour implies the same $3,750,000. Untitled. Authored by: Pexels. Located at: https://pixabay.com/photos/architecture-buildings-cars-city-1837176/. License: CC0: No Rights Reserved Pixabay License
  • #15 Correct answer: B— According to Smith, output is optimal when workers specialize in a part of the production process that they do best. Red Wing Shoes Factory Tour. Authored by: Nina Hale. Located at: https://www.flickr.com/photos/94693506@N00/4643862950/. License: CC BY: Attribution
  • #16 Correct answer: A— According to Smith’s theory Farm A should fully specialize in the production of eggs then trade eggs for milk. Since it can produce eggs more cheaply than B can produce milk more cheaply than A all resources are being efficiently utilized to maximize output. Cow brought off the hill to calf. Provided by: Geograph. Located at: https://www.geograph.org.uk/photo/36776. License: CC BY-SA: No Rights Reserved
  • #25 Principles of Economics. Provided by: OpenStax College. Located at: http://cnx.org/contents/69619d2b-68f0-44b0-b074-a9b2bf90b2c6@11.69:12/Principles_of_Economics. License: CC BY: Attribution See Table 1. at https://courses.lumenlearning.com/wm-introductiontobusiness/chapter/the-law-of-demand/ for data provided in the picture.
  • #26 Principles of Economics. Provided by: OpenStax College. Located at: http://cnx.org/contents/69619d2b-68f0-44b0-b074-a9b2bf90b2c6@11.69:12/Principles_of_Economics. License: CC BY: Attribution See Table 1. at https://courses.lumenlearning.com/wm-introductiontobusiness/chapter/the-law-of-demand/ for data provided in the picture.
  • #28 Figure 3. Change in Quantity Demanded Authored by: Lumen Learning. Located at: https://courses.lumenlearning.com/wm-introductiontobusiness/chapter/the-law-of-demand/ License: CC BY: Attribution
  • #29 Principles of Microeconomics Chapter 3.2. Authored by: OpenStax College. Provided by: Rice University. Located at: http://cnx.org/contents/ea2f225e-6063-41ca-bcd8-36482e15ef65@10.31:24/Microeconomics. License: CC BY: Attribution. License Terms: Download for free at http://cnx.org/content/col11627/latest
  • #34 Principles of Economics. Provided by: OpenStax College. Located at: http://cnx.org/contents/69619d2b-68f0-44b0-b074-a9b2bf90b2c6@11.69:12/Principles_of_Economics. License: CC BY: Attribution See Table 1. at https://courses.lumenlearning.com/wm-introductiontobusiness/chapter/the-law-of-supply// for data provided in the picture.
  • #36 Principles of Economics. Provided by: OpenStax College. Located at: http://cnx.org/contents/69619d2b-68f0-44b0-b074-a9b2bf90b2c6@11.69:12/Principles_of_Economics. License: CC BY: Attribution See Table 1. at https://courses.lumenlearning.com/wm-introductiontobusiness/chapter/the-law-of-supply// for data provided in the picture.
  • #39 Principles of Macroeconomics Chapter 3.2. Authored by: OpenStax College. Provided by: Rice University. Located at: http://cnx.org/contents/11300f3f-3e5d-45ce-bda7-40f486299062@5/Shifts-in-Demand-and-Supply-fo. License: CC BY: Attribution. License Terms: Download for free at http://cnx.org/content/col11627/latest
  • #42 Figure 2. Demand and Supply for Gasoline Authored by: Lumen Learning. Located at: https://courses.lumenlearning.com/wm-introductiontobusiness/chapter/equilibrium-price-and-quantity/ License: CC BY: Attribution
  • #43 Principles of Economics. Provided by: OpenStax College. Located at: http://cnx.org/contents/69619d2b-68f0-44b0-b074-a9b2bf90b2c6@11.69:12/Principles_of_Economics. License: CC BY: Attribution
  • #44 Principles of Economics. Provided by: OpenStax College. Located at: http://cnx.org/contents/69619d2b-68f0-44b0-b074-a9b2bf90b2c6@11.69:12/Principles_of_Economics. License: CC BY: Attribution
  • #45 Principles of Economics. Provided by: OpenStax College. Located at: http://cnx.org/contents/69619d2b-68f0-44b0-b074-a9b2bf90b2c6@11.69:12/Principles_of_Economics. License: CC BY: Attribution
  • #58 Business Cycle Graph. Located at: http://econ101-powers.wikispaces.com/Business+Cycle,+Recession,+Depression. License: CC BY-SA: Attribution-ShareAlike
  • #59 Expansion is usually the best time to look for a job . Expansion is usually the best time to start a business. Trough is generally the best time to buy stock or property.
  • #63 Correct answer: B— Expansions tend to be characterized by positive GDP growth and decreased unemployment and increasing inflation. Boom & Bust Scrabble  Authored by: Jeff Djevdet. Located at: https://www.flickr.com/photos/jeffdjevdet/18809997126/. License: CC BY: No Rights Reserved